Journal of Geophysical Research: Space Physics
Substructures within a dipolarization front revealed by
high-temporal resolution Cluster observations
Zhonghua Yao1, A. N. Fazakerley1, A. Varsani1,2, I. J. Rae1, C. J. Owen1, D. Pokhotelov1, C. Forsyth1, R. L. Guo3, S. C. Bai4,S. T. Yao4, and N. Doss1
1Mullard Space Science Laboratory, University College London, London, UK,2Now at the Space Research Institute, Austrian Academy of Sciences, Graz, Austria,3School of Earth and Space Sciences, Peking University, Beijing, China, 4Shandong Provincial Key Laboratory of Optical Astronomy and Solar-Terrestrial Environment, School of Space Science and Physics, Shandong University, Weihai, China
Abstract
The dipolarization front (DF), usually observed near the leading edge of a bursty bulk flow (BBF), is thought to carry an intense current sufficient to modify the large-scale near-Earth magnetotail current system. However, the physical mechanism of the current generation associated with DFs is poorly understood. This is primarily due to the limitations of conventional plasma instruments which are unable to provide a sufficient number of unaliased 3-D distribution functions on the timescale of the DF, which usually travels past a spacecraft in only a few seconds. It is thus almost impossible to unambiguously determine the detailed plasma structure of the DF at the usual temporal resolution of such instruments. Here we present detailed plasma measurements using the Cluster Plasma Electron and Current Experiment and Cluster Ion Spectrometry-Composition and Distribution Function ion data for an event during which it was possible to observe the full pitch angle distribution at a cadence of 1/4 s. The observations clearly show details of plasma substructure within the DF, including the presence of field-aligned electron beams. In this event, the current density carried by the electron beam is much larger than the current obtained from the curlometer method. We also suggest that the field-aligned current around the DF obtained from the curlometer method may have been misinterpreted in previous studies. Our results imply that the nature of the DF current system needs to be revisited using high-resolution particle measurements, such as those observations shortly to be available from the Magnetospheric Multiscale mission.1. Introduction
Bursty bulk flows (BBFs) are thought to be key structures in the magnetotail for transporting mass and mag-netic flux from the midtail to the near-Earth region. Angelopoulos et al. [1992, 1993] defined BBFs as intervals of fast (>100 km s−1) earthward plasma flow with peak velocities above 400 km s−1. These intervals were shown
to be associated with decreased plasma pressure or entropy and were of limited cross-tail extent (1–3 RE [Nakamura et al., 2004]), and thus described as plasma bubbles [Chen and Wolf , 1993]. BBFs also have a more dipolar magnetic field orientation than their surroundings, bounded by field-aligned currents [Sergeev et al., 1996; Sitnov et al., 2007; Forsyth et al., 2008; Walsh et al., 2009]. The BBFs propagate toward the Earth and divert in the near-Earth magnetotail at ∼8–10 RE[Shiokawa et al., 1997; Kissinger et al., 2012; Yao et al., 2013a; Shang et al., 2014]. The braking of this flow is suggested to cause flow vortices [Birn et al., 2004; Keiling et al., 2009; Shi et al., 2013] and to form an azimuthal plasma pressure gradient in the near-Earth magnetotail [Yao et al., 2012; Birn and Hesse, 2013], both of which can be sources of magnetic field-aligned currents in the magnetosphere [Sato and Iijima, 1979; Lui, 1996]. Inertial current in the flow braking region is usually ignorable [Shiokawa et al., 1997; Kepko et al., 2001]. Subsequent studies showed that the magnetic field at the earthward edge of BBFs becomes dipolarized over distances equivalent to a few ion skin depths; this region is known as the dipolarization front (DF) [Nakamura et al., 2002].
The interaction between a DF and the ambient plasma ahead of it leads to particle acceleration [Zhou et al., 2010; Artemyev et al., 2012; Eastwood et al., 2015] and current redistribution [Yao et al., 2014, 2015]. Recent multisatellite studies with the four Cluster spacecraft separated by ∼200 km show that the average scale of DFs is ∼1000 km, which is comparable to the local ion gyroradius [Yao et al., 2013b]. Simulation results sug-gested the formation of the ion gyroradius scale structure is due to the action of the ballooning/interchange instability [Pritchett, 2015]. Previous studies also suggested that organized current structures exist ahead of
RESEARCH ARTICLE
10.1002/2015JA022238
Key Points:
• Substructure electron beam on the DF is reported for the first time • The electron beam carried current is
much higher than the field-aligned current previously reported • The parallel electron beams on the DF
at energies of a few hundreds eV
Supporting Information: • Supporting Information S1 Correspondence to: Z. Yao, [email protected] Citation:
Yao, Z., et al. (2016), Substructures within a dipolarization front revealed by high-temporal resolution Clus-ter observations, J. Geophys. Res.
Space Physics, 121, 5185–5202,
doi:10.1002/2015JA022238.
Received 3 DEC 2015 Accepted 5 MAY 2016
Accepted article online 14 MAY 2016 Published online 11 JUN 2016
©2016. The Authors.
This is an open access article under the terms of the Creative Commons Attribution License, which permits use, distribution and reproduction in any medium, provided the original work is properly cited.
and on the DF. The field-aligned component of these current structures is in the Region-2 sense (into the iono-sphere on the duskside) ahead of the DF and the Region-1 sense (into the ionoiono-sphere on the dawnside) on the DF [Liu et al., 2013a, 2013b; Sun et al., 2013]. However, the processes by which field-aligned currents are generated around the DF remain unclear.
Anisotropy of the electron population around DFs has been reported in many previous studies. The electron anisotropy potentially provides a free-energy source to generate a plethora of plasma waves [Chen, 1984; Yoon and Davidson, 1987], which are capable of producing particle acceleration [Horne et al., 2005; Ni et al., 2006; Summers et al., 2007; Zhou et al., 2009] and which may also cause auroral brightening [Watt and Rankin, 2009; Thorne et al., 2010], and to drive substorm onset aurorae [Horne et al., 2003]. Betatron and Fermi acceleration have been proposed as the two main generations of anisotropies [Ashour-Abdalla et al., 2011; Fu et al., 2011; Tang et al., 2013, 2016; Hwang et al., 2014]. This conclusion of Fermi and Betatron accelerations of electrons was mainly based on observations of the electron pitch angle distribution (PAD). However, the same PAD could be generated by other mechanisms. Anisotropy could also arise as a result of beams from the auroral acceleration region as was reported for the case of beams around the DF observed in Zheng et al. [2012], although this beam cannot be directly proved to come from the ionosphere due to the limitation of instrument angular resolution. Previous studies have also presented analyses of parallel electron flux enhancements related to DF [Deng et al., 2010; Zhou et al., 2011; Zheng et al., 2012; Fu et al., 2013]. However, considering the width of the DFs and their propagation speed across the spacecraft, the observations of the particle distribution functions, typically restricted to the spin period of the spacecraft, are not well resolved. Observations of DFs with higher time resolution than a to date typical spin period are essential to reveal the detailed particle structure of DFs. For example, Zhou et al. [2013] reported rapid direction change of field-aligned current within the DF, they were not able to check the corresponding particle behaviors because the time resolution of particle measurements is longer than these structure durations.
In this paper, we present a DF event observed by Cluster on 29 August 2003. As described in Fazakerley et al. [2010], electron PAD (Plasma Electron and Current Experiment (PEACE) snapshot PAD) data product were collected during 1/8 s with high-energy and pitch angle resolution twice per spin but are not continuously available. In this event, for a few seconds, the magnetic field became closely aligned to the spin axis of the Cluster satellites. As a result, observations of the particle distribution at each spin azimuth correspond to a 0∘ –180∘ PAD, which provides us with a unique opportunity to study the dynamic plasma features on the DF with continuous 1/4 s resolution [Khotyaintsev et al., 2006; Schwartz et al., 2011; Varsani et al., 2014]. For the first time, we report the substructures of ion and electron populations on the DF and show details that are not in the spin-resolution observations. We also discuss the inaccuracy of calculating the DF-related field-aligned current calculated from the curlometer method [Dunlop et al., 1988; Robert et al., 1998]. Our results using higher time resolution observations show very different properties of field-aligned currents (FACs) associated with DF, compared to previous studies using spin-resolution particle data [e.g., Runov et al., 2011 and Sun et al., 2014a]. Higher time resolution observations from the Magnetospheric Multiscale (MMS) mission [Curtis, 1999; Mauk et al., 2014] will bring fundamental new understanding about the DF, which we believe will be different from the results from previous studies with spin-resolution observations.
2. Observations
2.1. Event Overview
In this paper, we study a DF event observed at ∼13:43:30 UT on 29 August 2003, when the Cluster satellites were located at [−17.48, −2.97, 1.51]REin Geocentric Solar Ecliptic (GSE) coordinates. At this time, the four Cluster spacecraft were separated by ∼200 km. All results in this paper are presented in GSE coordinates. This event was previously reported by Huang et al. [2012] and Sun et al. [2014a]. In their paper, they focus on the current circuit between the leading and trailing edges of a BBF. Here we examine the dynamic features of ions and electrons and compare these with the currents on the DF. The spacecraft data rate was normal, not burst, so the availability of 3-D PEACE data was limited except on Cluster 2 where PEACE also uses Cluster Ion Spectrometry (CIS) telemetry. PEACE 3-D data are from the 3DR product with 16 azimuths reduced from the measured resolution of 32 azimuths [Fazakerley et al., 2010]. Figure 1 shows magnetic field data of (a) Cluster 1 and (c) Cluster 2 from fluxgate magnetometer (FGM) [Balogh et al., 2001]; Figure 1 shows (b) proton differential energy flux from Cluster 1/Composition and Distribution Function (CODIF) [Rème et al., 2001], (d) electron differential energy flux from Cluster 2/PEACE [Johnstone et al., 1997], and (e) the proton bulk velocity moments from Cluster 1/CODIF.
Journal of Geophysical Research: Space Physics
10.1002/2015JA022238
Figure 1. Overview of the DF event on 29 August 2003. (a) The magnetic field in GSE coordinates, (b) the CODIF ion
energy-time spectrum from Cluster 1 in differential energy flux units, (c) the magnetic field, (d) PEACE electron energy flux spectrum from Cluster 2, and (e) the ion bulk velocity from Cluster 1 CODIF.
The magnetic field data from both spacecraft show a rapid (∼2 s) increase in the Bzcomponent of the magnetic field centered on ∼13:43:29 UT, which precedes an enhancement of the proton velocity observed by Cluster 1, indicating that the spacecraft encountered a DF at the earthward edge of a BBF. The peak velocity of this BBF is ∼900 km s−1. The DF was observed ∼50 s before the flow peak, when the bulk velocity was ∼100 km s−1.
We calculated the propagation speed of the DF with the minimum directional derivation (MDD) [Shi et al., 2005] and spatio-temporal difference (STD) [Shi et al., 2006] methods from the time differences between the four spacecraft in observing the DF magnetic structure. We find that the DF structure passed over the satellite constellation with a velocity of ∼220 ± 40 km s−1in normal direction, i.e., [0.703, − 0.710, 0.037].
The MDD analysis also shows that this DF is a quasi 1-D structure. This velocity is an average of STD result between 13:43:28 UT and 13:43:30 UT, which is very consistent with the timing method (called constant veloc-ity approach) [Russell et al., 1983]. For 1-D structure, the STD and timing method should give similar result. The STD can also be applied in calculating the propagating speed for 2-D and 3-D structures [Shi et al., 2006]. More details about the propagating speed analysis is given in our supporting information Figures S1 and S2. Considering the roughly 2 s duration of the DF observations, we thus estimate a spatial scale of ∼440 km for this structure, which is about twice the satellite spatial separation and comparable to the local ion gyroradius (the ion gyroradius is 758 km for 3 keV ions in the magnetic field of 10 nT) as concluded in previous studies [e.g., Runov et al., 2011 and Yao et al., 2013b].
As mentioned above, the energy flux spectrum of ions and electrons from the 2-D distribution for each azimuthal sweep is available at 1/4 s resolution in each distribution. For the ion data, the 3-D velocity distri-bution was translated for every other spin (∼4 s), while for the electron distridistri-bution, on Cluster 2 only, there are continuous 3-D distributions for the duration of this event. As indicated by the rectangle (4 s duration) in Figure 1, 3-D distribution for ions and electrons are available across the sudden Bzincrease region. Clear variations in both electron and ion features can be identified within the high-resolution spectrum, which we examine in detail in the following sections.
2.2. Continuous PAD Observations of Electrons From Cluster 2/3DR Data
The PEACE electron spectrometers on Cluster can measure the 3-D velocity distribution of electrons in the energy range from ∼0.7 to ∼27 000 eV. They consist of a High Energy Electron Analyser (HEEA) and a Low Energy Electron Analyser (LEEA), which are located on opposite sides of the spacecraft. When the spacecraft is using normal mode telemetry rate, the PAD of the electrons is generated and transmitted once per spin (every ∼4 s) from each sensor and a reduced 3-D distribution is also transmitted less frequently due to telemetry restrictions. However, on Cluster 2, these 3-D data are more frequently transmitted, due to a higher telemetry budget for PEACE on that spacecraft. The 4 s temporal (spin) resolution is often sufficient for analysis of the plasma properties, when the magnetic field or plasma do not exhibit much variation within one spin. However, for fast-varying events such as the DF, the magnetic field and plasma change substantially within a spin as the DF pass the spacecraft; and therefore, a higher temporal resolution is required to study these structures. In special cases, when the magnetic field vector is closely aligned (<30∘) with the spacecraft spin axis, the 3-D distributions can be used to obtain continuous PAD data at a cadence much quicker than 4 s. This method has been previously used by Khotyaintsev et al. [2006], Schwartz et al. [2011], and Varsani et al. [2014] to obtain new insights into fast-varying electrons behavior, respectively, at the reconnection separatrix region, at the bow shock, and within a flux transfer event.
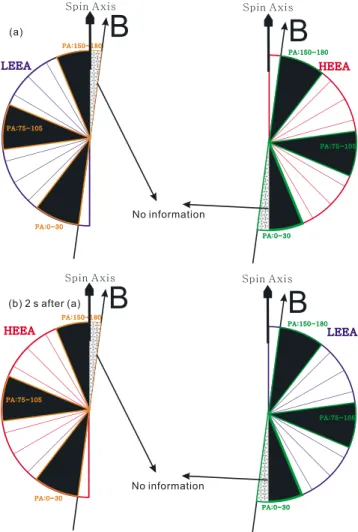
For the DF event that is presented in this paper, both LEEA and HEEA sensors on Cluster 2 were in opera-tion, LEEA measured the 3-D distribution data in High Angular Resolution (HAR) mode (64 sweeps in one spin) across the energy range ∼80 eV to ∼2 keV, and HEEA was in Medium Angular Resolution (MAR) mode (32 sweeps in one spin) covering energies from ∼34 eV to ∼26 keV [Johnstone et al., 1997; Fazakerley et al., 2010]. However, the reduced 3-D distribution that was transmitted has summed together some data to reduce angular and energy resolution, and so the effective energy sweep cadence is 1/4 s. As a result, both sensors can provide continuous subspin PAD from the 3-D data when the orientation of the magnetic field is in our favor. In addition to that, the overlapping energy coverage of the LEEA and HEEA sensors enables us to use simulta-neously collected data from both sensors (mounted opposite side of the spacecraft) and check whether the continuous PAD from a single sensor is affected by spin modulation. Figure 2 is a cartoon to illustrate this effect. As shown in Figure 2a, when there is a small angle (e.g.,<15∘), both LEEA (left) and HEEA (right) sensors can provide the parallel, perpendicular, and antiparallel components (indicated by the black areas) with 3DR data that has 30∘ polar resolution. However, as indicated by the mashed areas in Figure 2a, a part of the antiparallel (PA: 150∘ to 180∘) component is out of the view of the LEEA sensor and a part of parallel (PA: 0∘ to 30∘) is out of the view of the HEEA sensor. So the antiparallel from LEEA and parallel from HEEA will be underestimated. This missed population is modulated by the spin of spacecraft. After a half spin, the underestimated popula-tion would be the antiparallel in the HEEA and parallel in the LEEA sensor, as shown in Figure 2b. In case there are very narrow (within the mashed areas in Figure 2) counterstreaming electrons along the magnetic field, for the situation described in Figure 2a, LEEA will only show the parallel dominant beam and HEEA can only show the antiparallel dominant beam. While after a half spin period as shown in Figure 2b, LEEA will show the antiparallel component, and HEEA only show the parallel component. The PAD becomes very reliable when both LEEA and HEEA sensors have detected the same direction of electrons, although the intensities at both sensor would be different due the spin modulation shown in Figure 2.
Figure 3a shows the magnetic field from Cluster 2. Figure 3b is the angle between magnetic field and the spin axis. During the interval between 13:43:29 UT and 13:43:32 UT, this angle is below 15∘, less than half 3DR polar angular resolution (30∘). We are thus able to obtain higher than spin-resolution PAD for most of the DF intervals for ions and electrons. Figures 3c–3e present the distribution of parallel (PA: 0∘ to 30∘), perpendicular (PA: 60∘ to 120∘), and antiparallel (PA: 150∘ to 180∘) electron phase space density (PSD) from HEEA selected energy channels at 1/4 s time resolution. The plot in Figure 3f is the energy-time spectrum of the difference between parallel and antiparallel electron PSD. We show the data from HEEA sensor in this figure, which has better coverage of energy range for the plasma sheet population. The field-parallel electron flux at a few hundred eV is significantly higher than at other pitch angles at around 13:43:29 UT, while at 13:43:30 UT the antiparallel flux at similar energy range is higher. The parallel flux distribution clearly shows that this pitch angle anisotropy is a beam-like distribution rather than a drifting Maxwellian distribution (see the supporting information). To confirm the measurement reliability of the electron beams in Figure 3f, we compared the distributions from LEEA and HEEA sensors. The LEEA and HEEA data are not collected at precisely the same time at any given energy, and the 3-D data combine four energy sweeps for LEEA and two energy sweeps for HEEA, so differences may include time variations at<1/4 s scales. Figures 3g– 3i show the 2-D full velocity
Journal of Geophysical Research: Space Physics
10.1002/2015JA022238
Figure 2. Cartoon to illustrate how the subspin time resolution PAD is obtained, and the spin modulation that may
affect the subspin-resolution PAD.
distributions of electrons contain the data from LEEA (left side) and HEEA (right side) for three selected sweeps. This determines that the independent sensors LEEA and HEEA detected similar beams for the selected sweeps, which confirms the PADs observations. Figure 3g shows a clear parallel (PA: 0∘ to 30∘) electron beam at energy <500 eV, while is clearly not observed still 0.5 s later as shown in Figure 3h. A further 0.5 s later, Figure 3i shows that the electron PSD is still dominated by the antiparallel component (PA: 150∘ to 180∘) at energy<500 eV. Although the full coverage of pitch angles only became available after 13:43:28.74 UT, the parallel electron beam was seen by HEEA earlier as presented in Figure 3c. The parallel beam feature is not clear in 1/4 s before 13:43:28.74 UT, which is also clearly shown from the supporting information Figure S3. Considering that the DF structure propagates with a speed of ∼200 km s−1, the parallel beam thus should have a scale of<50 km, which
is comparable to the local electron inertial length (∼20 km at 13:43:29 UT). These short duration electron behaviors could not been detected by the spin-resolution observations in the previous papers.
Figure 4 shows the PEACE observations from LEEA sensor in the same format as shown in Figures 3a–3f. It is clear that the parallel electrons were the dominant population between 13:43:28.75 UT and 13:43:29.25 UT, and the antiparallel electrons between 13:43:29.25 UT and 13:43:30 UT. These features are consistent with the HEEA observations as shown in Figure 3. However, between ∼13:43:30 UT and ∼13:43:32 UT, the dominant population was parallel to the magnetic field, in contrary to the observations from HEEA. The same inconsis-tency also exists between 13:43:32 UT and 13:43:36 UT. In addition to that, from HEEA and LEEA observations, the dominant electron fluxes switch between parallel and antiparallel every 2 s (a half spin period), which confirms that this inconsistency is due to the spin modulation discussed in Figure 2.
Figure 3. (a) The magnetic field from Cluster 2 in GSE coordinates. (b) The angle between the magnetic field and spin axis. (c–e) Energy versus time for Cluster 2
HEEA electron phase space density with parallel, perpendicular, and antiparallel pitch angles. (f ) The difference of PSD between parallel and antiparallel, i.e., PSD(PA: 0∘to 30∘)–PSD(PA: 150∘to 180∘). (g–i) Two-dimensional velocity distribution (combing LEEA and HEEA data) of electrons for three selected sweeps, as indicated by the dashed blue lines. The left wheels are from the LEEA sensor, and the right wheels are from the HEEA sensor.
2.3. Pitch Angle Snapshot Data From PEACE
Although continuous PAD data were not available for Cluster 1, Cluster 3, and Cluster 4 during this DF obser-vation, the onboard selection based on 3DR pitch angle snapshots provides full coverage of pitch angles and energies from 125 ms azimuthal sweeps twice each spin. These data can provide important support to the 3DR observations and are available on all four spacecraft. The polar angle resolution is 15∘, which is better than the 30∘ resolution in the reduced 3-D distribution as shown in Figure 3.
Figures 5a–5d show the magnetic field for the four Cluster spacecraft. As noted earlier, the DF was observed at slightly different times, which is clearer in the plot of the angle between the magnetic field and the spin axis shown in Figure 5e. Figure 5f presents the PAD of electron PSD from Cluster 1/LEEA sensor (left half ) during the energy sweep from 13:43:29.588 UT to 13:43:29.646 UT, and PSD from Cluster 1/HEEA sensor (right half ) during
Journal of Geophysical Research: Space Physics
10.1002/2015JA022238
Figure 4. The observations from the LEEA with the same format as Figures 3a–3f.
the energy sweep from 13:43:29.466 UT to 13:43:29.583 UT. Figure 5g presents the PAD from Cluster 2/LEEA (left half ) during the energy sweep from 13:43:28.791 UT to 13:43:28.850 UT and Cluster 2/HEEA sensors (right half ) during the energy sweep from 13:43:28.733 UT to 13:43:28.850 UT. Figure 5h shows the PAD from Cluster 3/LEEA (left half ) and Cluster 3/HEEA (right half ) sensors during the energy sweep from 13:43:28.759 UT to 13:43:28.876 UT. Figure 5i shows the PAD from Cluster 4/LEEA (left half ) and Cluster 4/HEEA (right half ) sensors during the energy sweep from 13:43:30.437 UT to 13:43:30.553 UT. These time intervals are also indicated by the vertical lines in the corresponding panels in Figures 5a–5d. By shifting the times for Cluster 1, Cluster 3, and Cluster 4, we plot the Bzcomponent in Figure 5j. It is clear that the PAD shown in Figures 5f, 5g, and 5h were observed in a large Bzgradient region, while the distribution from Cluster 4 was on a large Bzregion with small gradient. Cluster 2 detected the earliest part of this DF, followed by Cluster 1, and then Cluster 3. This time sequence corresponds to the different parts of the DF as shown in Figure 5j, which is different from the universal time shown in Figures 5f–5i. Figures 5g–5i provide full coverage of the pitch angles from a combination of HEEA and LEEA sensors. As shown in Figures 5f and 5g, a clear parallel beam can be identified from Cluster 1 and Cluster 2 distributions at energy between ∼200 eV and ∼500 eV. This is consistent with the reduced 3-D distribution as shown in Figure 3g. In the distribution obtained at Cluster 3 as shown in Figure 5h, the parallel electron PSD is clearly higher than those population with other pitch angles, while the beam feature is not clear. Regarding the high Bzregion, Figure 5i shows an antiparallel dominant electron PSD, which is also very consistent with the similar region shown in the reduced 3-D distribution from Cluster 2 (Figure 3i). We would like to point out that the electron beam observed by Cluster 2 should be very narrow, since only HEEA sensor with pitch angle<15∘ has detected this beam, while the LEEA sensor with pitch angle between 15∘ and 30∘ did not detect the same beam, as shown in Figure 5g. In Figure 5j, we also show the electron gyroradius (∼15 km) to provide a general structure scale in comparison to the typical electron scale. We use 2 keV (main population as shown in Figure 1) electron in 10 nT magnetic field to calculate the gyroradius.
Figure 5. (a–d) The magnetic field observations from Cluster 1 to Cluster 4 in GSE coordinates. (e) The angles between magnetic field and the spin axis for all
four Cluster spacecraft. (f–i) The PAD from the PEACE snapshot PAD Data for Cluster 1–Cluster 4 at the time point as indicated by the vertical line in
Figures 5a–5d. The left wheels are from LEEA sensors, and the right wheels are from HEEA sensors. (j) The magnetic fieldBzof the four Cluster spacecraft with
time shifting to Cluster 2 based on the shape of theBzvariations.
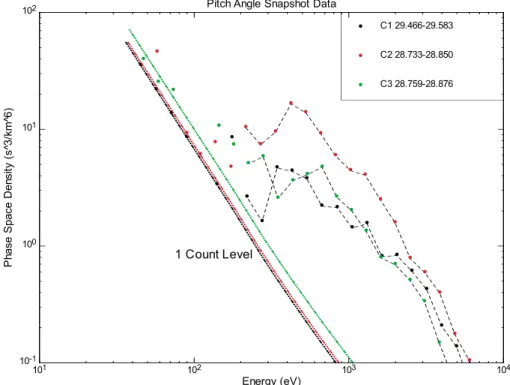
To further study the parallel electron beam on the DF, we compare the PSD versus energy for the distributions in Figures 5f–5h, as shown in Figure 6. The data presented in Figure 6 were all from the HEEA sensor. We can clearly identify a bump distribution at energies between ∼200 eV and ∼1 keV for all three distributions. These observations confirm that a parallel electron beam with energy of a few hundred eV exists on the sharp Bz increase region of a DF. The PSD of this beam at Cluster 2 is clearly higher than at Cluster 1 and Cluster 3. Comparing with the time difference in Figure 5j, it seems that the electron beam was weaker in the region closer to the high Bzregion. We will further discuss the electrical current carried by this beam in section 3.
2.4. Observations of Ions From Cluster 1
The CIS experiments on Cluster consist of two sensors, which measure the 3-D velocity distribution of ions. The Composition and Distribution Function (CODIF) analyser provides the mass per charge composition of ions (H+, He+, He++, and O+), and the hot ion analyser (HIA) which does not provide m/q distribution.
Unfor-tunately, since launch, the CIS instrument on Cluster 2, (the spacecraft that we present PEACE data from) has not been in operation. However, the Cluster constellation gives us the opportunity to look at the simultane-ous observation of ions by Cluster 1 along with electron observation by PEACE on the nearby Cluster 2 during this DF event. During the time interval that is presented in this paper, both HIA and CODIF were returning the full 3-D distribution every other spin, but we only present the CODIF data on Cluster 1, as it was the only instrument that provided the ion velocity distribution at the precise time at which the DF was observed.
Journal of Geophysical Research: Space Physics
10.1002/2015JA022238
Figure 6. Electron phase space density versus energy for Cluster 1, Cluster 2, and Cluster 3 from the PEACE snapshot
PAD Data for Cluster 1, Cluster 2, Cluster 3 at the time points for the electron beam observations on the DF.
Just as with the electron data, we are able to use the individual azimuth sectors of the ion velocity distribution to produce the subspin PAD data during the DF event, the CODIF instrument was providing 16 sweeps per spin, enabling us to generate the PAD, nominally at every 1/4 s. However, the data transmitted from CODIF instrument have reduced azimuthal resolution, for the look directions near the spin axis (shown in the sup-porting information Figure S4), which affects the temporal resolution of the PAD data we produced. As a result, only the perpendicular population is available at 1/4 s cadence, while the parallel and antiparallel population are available at a cadence of 1 s when the magnetic field is close to the spin axis.
Unlike the electrons, depending on the ion population, the thermal velocity of ions may be comparable to their drift velocity. Therefore, when using sweep-resolution data, extra care is required for interpreting any anisotropy in the 2-D velocity distribution and to distinguish whether the flux in a specific direction is caused by thermal motion or bulk motion [Varsani et al., 2014].
Figure 7a shows the magnetic field from Cluster 1. Figure 7b shows the angle between magnetic field observed by Cluster 1 and the spacecraft spin axis. Figures 7c–7e show the ion energy spectrum for paral-lel, perpendicular, and antiparallel pitch angles differential energy fluxes. It is clear that the ion distribution shows two different features during the Bzincrease region. The observation of the field-aligned components became possible after 14:43:29 UT when the magnetic field orientation gets closely enough aligned with the spin axis (<22.5∘). Nevertheless, the perpendicular component was available since 14:43:28 UT, when the mag-netic field orientation was in favor. The perpendicular flux suddenly decreased around 13:43:29 UT, while the parallel and antiparallel fluxes were relatively high. It is noteworthy that the main energy range of ion energy fluxes during this time is>20 keV, corresponding to a velocity (∼2000 km s−1) much larger than the observed
ion bulk velocity shown in Figure 1, i.e., ∼100 km s−1. The bulk velocity is not likely to be a major contributor
to the anisotropies. However, it is also possible that the ion is preferential perpendicular heated to the energy above the instrument upper limit. The perpendicular ion heating in a much larger spatial scale region around dipolarization front has been revealed by observations and simulations [Birn et al., 2015; Runov et al., 2013].
2.5. Field-Aligned Current From Curlometer
In their study of this event, Sun et al. [2014a] used the curlometer method to show that an antiparallel cur-rent flowed on the DF, while ahead of the DF, where there is a magnetic dip, a parallel curcur-rent flowed. As discussed in their paper, the current density inferred from the curlometer appears to be reliable since the
Figure 7. CODIF ion observations from Cluster 1. (a) The magnetic field from Cluster 1 in GSE coordinates. (b)The angle between the magnetic field and spin axis.
(c–e) Energy fluxes for parallel, perpendicular, and antiparallel pitch angles are presented, respectively.
elongation and planarity factors of the four spacecraft tetrahedron were ∼0.2. However, in their calculation of the field-aligned current, an average background magnetic field across the tetrahedron was adopted. As sug-gested in section 2.1, the scale size of the DF structure is about twice the satellites’ separations, which means that the magnetic field inside the tetrahedron may significantly vary, thus using an average field to calcu-late the background magnetic field direction may introduce large uncertainties into the field-aligned current determination. To quantitatively estimate the reliability of the field-aligned current from the average mag-netic field and average current density, we adopt a parameter to represent the consistency of the magmag-netic direction (CMD) from the four spacecraft that is defined as follows.
1. We calculate an average magnetic field for the four spacecraft at each time point.
2. We calculate the angles between the average magnetic field and the magnetic field at each spacecraft. 3. We select the maximum angle from every time point to obtain a parameter to represent CMD.
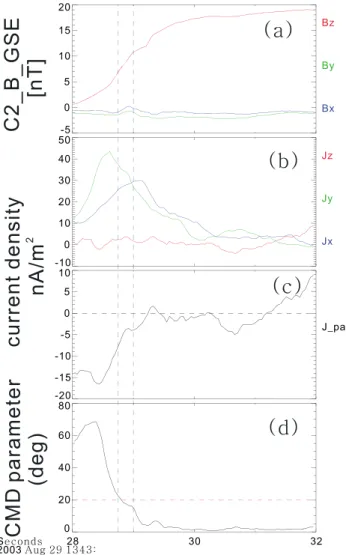
Figure 8 shows the currents calculated from the curlometer alongside our new CMD parameter. Figure 8a presents the three components of magnetic field observed by Cluster 2, while the current density calculated from the four Cluster satellites in GSE coordinates is shown in Figure 8b. Figure 8c shows the field-aligned component of the current density calculated using the averaged magnetic field from the four spacecraft. The CMD parameter is presented in Figure 8d. However, the CMD was up to 70∘ in the region ahead of the DF, which suggest that the field-aligned current calculation may be inaccurate there. Nevertheless, the CMD on the DF was relatively small (<20∘), particularly after 13:43:29 UT, when the electron beams were detected. Thus, we conclude that the field-aligned current indicated by the curlometer shown in Figure 8c between this time period is likely reliable. We suggest that deriving FAC for CMD>30∘ is unreliable at best, which still needs a future study to support. We need to emphasize that the current density derived from the curlometer method is not affected by CMD at all, only the field-aligned component calculation is relevant to the CMD parameter.
Journal of Geophysical Research: Space Physics
10.1002/2015JA022238
Figure 8. (a) The magnetic field from Cluster 2 in GSE coordinates. (b) Current density obtained with the curlometer
technique. (c) The field aligned is referred to the average magnetic field from the four CLUSTER spacecraft. (d) The CMD parameter as defined in this paper.
3. Discussion and Summary
Electron anisotropy is a common phenomenon in the magnetosphere. Hada et al. [1981] use Imp 6 mea-surement to show that electron anisotropy is a common feature in the plasma sheet and address this as a consequence of Fermi acceleration. Chen et al. [2000] also reported the anisotropic electron distribution in the tail current sheet with Wind 3-D plasma instrument, and they further found that this anisotropic electron distribution is usually accompanied by counterstreaming beams. Bistreaming electron distribution is also a common consequence of magnetic reconnection in the magnetotail [Øieroset et al., 2002; Owen et al., 2005; Egedal et al., 2008]. The streaming electron distribution also exists in flux rope [Wang et al., 2010], and in the plasma sheet boundary layer has been reported in many previous papers [Wygant et al., 2002; Walsh et al., 2011]. Cluster and Time History of Events and Macroscale Interactions during Substorm (THEMIS) observa-tions have also shown the electron pitch angle features ahead and after the DF [Fu et al., 2011; Runov et al., 2013] with spin-resolution observations. As shown in the statistical DF studies in Liu et al. [2013a] and Yao et al. [2015], a DF structure usually last less than 7 s, which is comparable to the spin period of 3 s for THEMIS and 4 s for Cluster. It is thus impossible to show the detailed particle features for the DF with spin-resolution mea-surements. Moreover, it is very difficult to obtain a reliable pitch angle distribution with the spin-resolution distributions for DFs, since the magnetic field has significantly changed during one spin period. It is thus nec-essary and essential to investigate the particle features with higher than spin-resolution measurements for such short duration magnetic structures, such as DF.
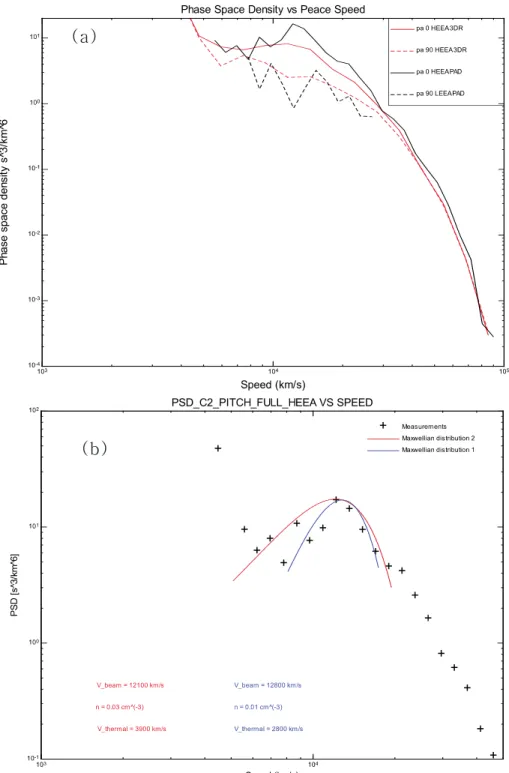
In this paper, we investigated a unique DF event whereby we can study the physics of the DF with continu-ously available unusually high time resolution PAD data for electrons and ions. We identify for the first time that clear electron beams exist on the DF associated with the enhancement of Bzwhen observed with the 1/4 s cadence PAD. These have previously been impossible to be presented in spin-resolution measurements. The PEACE snapshot PAD data from all the four Cluster spacecraft confirm the continuous 3DR PAD observa-tions from Cluster 2 apply over the DF. To estimate the current density carried by the beams, we adopt the velocity distribution for PEACE snapshot PAD data of Cluster 2 from 13:43:28.733 UT to 13:43:28.850 UT (as in Figure 6), since PEACE snapshot PAD data have better angular, energy, and time resolution than the reduced 3-D distribution. We here fit the data with a Maxwellian distribution to estimate the current carried by the electron beam. Figure 9a presents the PSD of parallel and perpendicular electrons from both the reduced 3-D distribution (HEEA) and PEACE snapshot PAD data (HEEA and LEEA). The PSD from both products is quite con-sistent although not exactly the same. Figure 9b shows the measurement of parallel flux (PA: 0∘ to 15∘) from HEEA PEACE snapshot PAD data and the fitted drifting Maxwellian distribution. Due to the limited number of data points of the electron beam distribution, we cannot perform a perfect fitting curve for this beam dis-tribution, instead, we show two drifting Maxwellian distributions to roughly represent the upper and lower density of the current carried by this electron beam. The current density calculation depends on two param-eters, i.e., the drifting velocity and the number density. The velocity (∼1200 km/s) can be reliably identified by eye from the phase space density plot (Figure 6). The main uncertainty is from the density estimation. In fitting the Maxwellian distribution, the integral area represents the density. Clearly, the two fitting function shows the lower and upper boundaries of the area. The beam velocity is ∼12100–12800 km s−1, and the
ther-mal velocity is ∼2800–3900 km s−1, corresponding to an energy of ∼22–43 eV. In the sweep-resolution data,
the information of the perpendicular velocity distribution is missing, we here assume that the beam tempera-ture is isotropic and obtained a density of ∼0.01–0.03 cm−3for this beam. We thus estimate a current density
carried by this electron beam as J = neVe≈20–58 nA/m2. As we discussed in section 2.3, the parallel electron
beam PSD was weaker at Cluster 1 and Cluster 3. The current density estimated from Cluster 1 and Cluster 3 is ∼5 nA/m2(not shown in this paper), which also suggest that this beam had a short duration. As we show in
our supporting information “A brief discussion about the spatial scale of the parallel beam from electron dis-tribution,” the overall duration of the parallel electron beam observation interval is at least 1 s, corresponding to ∼200 km, or about 10 electron inertial lengths/gyroradius. The most intense part of the beam was observed by Cluster 2 on a smaller scale of ∼40 km or about 2 electron inertial lengths/gyroradius. We would also like to point out that when the beam was detected by Cluster 2/HEEA and Cluster 3/HEEA, the center of instru-ment anode was very closely aligned to the magnetic field (∼3∘, in which direction the anode covers ∼15∘, not shown in this paper), which perfectly measured the parallel beam distribution. While when C1/HEEA was measuring the beam population, the center of the anode was not closely aligned the magnetic field (with an angle of ∼12∘), the beam population was thus somehow underestimated. This could explain that Clus-ter 1 measured the beam between ClusClus-ter 2 and ClusClus-ter 3 (shown in Figure 5j), while the beam intensity is weakest from comparing Figures 5f–5h. Here we do not discuss the current carried by ions due to (1) the ion data at Cluster 2 was not available, only available ion data came from Cluster 1 during the DF observation; (2) resolution of the ion data at field-aligned direction is ∼1 s, which is much longer than the electron beam duration, and (3) the particle velocity for the ion at 10 keV is ∼1300 km s−1, which is an order smaller than the
electron beam velocity. The time resolution of the available ion data is less well matched to the scale of the dipolarization front than the electron data, and we did not consider it sufficient to allow an investigation of the possibility of a current (parallel or antiparallel) carried by ions. The current density is much larger than the field-aligned current density obtained from the curlometer technique. The difference is expected since we see the beam has a scale of<50 km (note that this 50 km is not a restrict upper limit, since the nearest neighbor data points may also contain part of the beam, but do not show clear features after averaged in a data sample period), while the current density from the curlometer is an average within the four spacecraft, which were separated with ∼200 km. The sweep-resolution data show that within a 200 km region, the electron dominant PSD may change direction from antiparallel to parallel, which suggest that the averaged current may smooth out these small-scale structures, although the averaged current density calculation is reliable as we discussed in section 2.5. In the present study, the energy center of the electron beam substructure is about few hun-dred eV, far from the potential photoelectron contamination, i.e., ∼10 eV (shown in supporting information Figure S5). The minimum measured energy for PEACE on both Cluster 1 and Cluster 2 was ∼30 eV, while it was ∼3 eV for Cluster 3 and Cluster 4. Active spacecraft potential control [Torkar et al., 2001] was operated only on Cluster 3 but not on Cluster 4 (though it had been expected to operate on Cluster 4). As indicated in the
Journal of Geophysical Research: Space Physics
10.1002/2015JA022238
Figure 9. (a) Perpendicular and parallel PSDs versus speed from Cluster 2 reduced 3-D electron distribution (3DR) and
PEACE snapshot PAD Data (PAD). The perpendicular and parallel for 3DR data are defined as PA (60∘–120∘) and PA (0∘–30∘), and for PAD data are defined as PA (75∘–105∘) and PA (0∘–15∘). The differences are due to different data product resolutions. (b) The plus symbols represent parallel PSD from HEEA PAD data product. The red curve shows the drifting Maxwellian results.
supporting information, it is clearly seen in the Cluster 3 data in particular that there is no significant plasma electron population below 100 eV. Considering the other three spacecraft were very close to Cluster 3 (with a separation of ∼200 km), we thus assume that the same is true for the other three spacecraft.
Considering the parallel electron beam is transient (lasted for less than 1/4 s as shown in Cluster 2/HEEA mea-surement), a spatial aliasing question might be raised regarding that Cluster 2/LEEA may not detecting the same energy range when Cluster 2/HEEA detected the parallel electron beam. Then the interpretation of one direction electron beam might be questionable. During the event reported in our paper, the HEEA energy sweep starts at a higher energy than the LEEA energy sweep, so the exact time at which a given energy is sampled by HEEA differs from the time that it is sampled by LEEA by 10 ms, as shown in the supporting infor-mation in Figure S6. We have reported a parallel beam that is predominantly confined to one energy bin. The antiparallel looking sensor would only miss an antiparallel beam of the same energy if it persisted less than 0.01 s after the parallel beam was observed. However, the other two spacecraft (C1 and C3) have also detected this parallel beam, showing that it persisted for at least 0.7 s (e.g., consider the beam times given in Figure 6). This is significantly longer than an individual energy sweep, so we would expect to have seen the hypothetical antiparallel beam whether it existed at the same energy as the parallel beam or another energy in the sampled energy range. In consideration of the DF’s propagation speed that is about 200 km/s, 0.01 s time difference means 2 km spatial difference, which is even much smaller than electron gyroradius or elec-tron inertial length (the radius of a 2 keV elecelec-tron in 10 nT magnetic field should be 15 km). In this study, we do not have a particular reason to assume a significant spatial nonuniform in 2 km.
It is widely reported that the FAC associated with the DF is in Region-2 sense in the magnetic dip region ahead of DF and Region-1 sense in the front layer region [Yao et al., 2013b; Liu et al., 2013b; Sun et al., 2013]. However, with these novel high-resolution PEACE observations, substructures, i.e., the parallel electron beam and antiparallel dominant electron PSD, are identified on the sharp Bzincrease region with<100 km spatial scale. Our new findings reveal that the previous descriptions of the field-aligned current system near the DF may not be accurate since the separations of Cluster spacecraft are much larger than the scale of electron beams on the DF. Although magnetic variation could also due to the systematic current of BBFs, such as the large-scale Regions 1 and 2 current system [Yao et al., 2013b; Sun et al., 2013], we suggest the current density carried by the electron beams is a localized current structure in consideration of two main reasons. (1) The current density in our event is significantly higher than the BBF’s FAC density [Yao et al., 2013b]. (2) This current was observed in a magnetic field environment characterized by Bx∼ 0 and By∼ 0. Since Region 1 (or Region 2) current presents opposite direction on dawnside and duskside, it is thus expected to see minimal current density in the central region, as characterized by By∼ 0. In addition, Region 1 (or Region 2) current also shows asymmetry in both hemispheres; in the equatorial plane, field-aligned current is minimal, and the main current is perpendicular to the magnetic field, as shown in Birn and Hesse [2014].
In previous studies, DFs are usually considered as tangential discontinuities [Schmid et al., 2011; Liu et al., 2015]. We perform the minimal variance analysis [Sonnerup and Cahill, 1967; Sonnerup and Scheible, 1998] for the DF observation at Cluster 2 from 13:43:28 UT to 13:43:30 UT. We obtained l = [−0.021, −0.048, 0.999], m = [0.763, 0.644, 0.047], and n = [0.646, −0.763, −0.023]. It is noteworthy that the normal direction is slightly different from the normal direction from STD, because the calculation of the normal direction in STD includes the magnetic field from all four spacecraft. The MDD and STD methods have been widely used to determine the propagation speed of a magnetic structure, without preassuming the magnetic structure is a 1-D struc-ture [Shi et al., 2009a, 2009b; Denton et al., 2012; Shi and et al., 2014]. The three eigenvalues are 34.6, 0.16, and 0.0088. The maximum variable was mostly in ZGSE. And the minimum direction was in earthward
dawn-ward direction. The eigenvalue for the minimum variable is much smaller than the intermediate value, which suggests that the change of magnetic field in that direction is ignorable. Figure 10 shows the magnetic field in NML coordinates. Here we define L = N × M. It is clear that the maximum variable is also the dominant component around 13:43:29 UT. The L component current can be expressed as𝜕Bm
𝜕n − 𝜕Bn
𝜕m. The second term is ignorable since Bnwas almost consistent as shown in Figure 10. We thus estimate the L component cur-rent from𝜕Bm
𝜕n, which roughly represent the field-aligned current since Blwas dominant around 13:43:29 UT. In order to compare the current with the electron beam as shown in Figure 9, we calculate the𝜕Bm
𝜕n term with magnetic field between 13:43:28.717 UT and 13:43:28.895 UT (indicated by the two vertical lines in Figure 10), which is almost the same time interval as the energy sweep in Figure 9. The magnetic field increases from −1.45 at 13:43:28.717 UT to 0.05 at 13:43:28.895 UT. Adopting the propagating speed of ∼220 km/s, the cur-rent density is ∼ −30 nA/m2, with a spatial scale of ∼40 km that is consistent with the previous<50 description.
Journal of Geophysical Research: Space Physics
10.1002/2015JA022238
Figure 10. The magnetic field of Cluster 2 at the DF presented in local LMN coordinates.
On the other hand, we can use the ∼40 km thickness estimate from the magnetic field with the PEACE current density estimate to infer a magnetic perturbation in the range 1.01–2.92 nT, consistent with the observed change in Bm. We need to point out that the current derived from a single-spacecraft magnetic observations is not very reliable for such a small region within a DF, since in this calculation we have assumed that the mag-netic field change is caused by the 1-D small-scale current sheet. However, as reported in previous studies [Liu et al., 2013a; Yao et al., 2013b; Sun et al., 2013], the current system around the DF is more complicated than a simple 1-D current sheet. In addition, the magnetic field perturbation might be due to the moving of cur-rent structures from other regions, such as the magnetic dip region. The propagation speed of the DF and the Maxwellian fitting result might be two reasons for this inconsistency, which cannot be significantly improved in the current observations. In addition, the Y component of electric field increased ∼30 mV/m within 0.2 s on this DF (not shown in this paper), which may suggest a strong displacement current that does not perturb the magnetic field. The magnetic perturbation also suggests that the FAC obtained by curlometer is under-estimated. The severe underestimation of current density from curlometer is a nature consequence when this technique is applied in small-scale line currents, which is carefully discussed in Forsyth et al. [2011]. They have also indicated that this underestimation is not well represented by the curlometer error indicator, i.e., |∇⋅B∕∇×B|. Although the current density carried by the electron beam is very intense, the small spatial scale implies the total current is much smaller than the current associated with a substorm. Moreover, the beam energy is a few hundred eV, which is relatively too small to cause auroral intensification. It is thus unlikely that this beam plays an important role in driving a substorm current system.
The generation of the small-scale electron beam may be a result of magnetic reconnection, the local parallel electric field, auroral acceleration region, and wave-particle interaction. Although Sun et al. [2014b] conclude that the electron is frozen-in on the DF, it is worthy to reanalyze the possibility of the parallel electric field on the DF since their analysis has not considered any substructures on the DF. The typical energy range of electrons accelerated by magnetic reconnection in the magnetotail is a few keV to tens of keV [Nagai et al., 2001; Hoshino et al., 2001; Asano et al., 2008; Chen et al., 2009], while the observed electron beams in our event are a few hundred eV, which is not a typical value associated with reconnection. The outflow field-aligned beam from ionosphere might be a potential source for this beam since the beam is very cold (thermal energy is ∼22–43 eV), while the dynamic energy is ∼420 eV that is a usual value in the auroral acceleration region [McFadden et al., 1999; Chaston et al., 2002]. We cannot further discuss the mechanism since there is no available high-resolution wave data and 3-D electric field. However, future studies with MMS data with 3-D
electric field measurements and high-resolution wave data would be ideal for determining the electron beam generation mechanism (e.g., parallel electric field acceleration and wave-particle interactions) on the DF. In conclusion, using novel Cluster measurements, the new findings in this paper are summarized as follows: 1. We report the first observations of the existence of the electron beam substructures on the DF from
mul-tiple data products of Cluster PEACE instrument, in advance of the routinely available high-resolution data from MMS.
2. We question the reliability of the field-aligned current derived from the curlometer technique in the region ahead of the DF. We propose a new criteria to be considered as an indication of reliability.
3. The beam presented in our paper has a scale of<50 km, which carries current density of ∼20–58 nA/m2.
This current density is much greater than the averaged field-aligned current density obtained from the cur-lometer in this paper and those reported by the previous papers [e.g., Yao et al., 2013b and Sun et al., 2013], while is more consistent with single-spacecraft magnetic field-derived current density.
4. The parallel beam has a very narrow pitch angle distribution (<15∘), and the current carried by this beam quickly decreases toward the high Bzregion, followed by an antiparallel in ∼1 s later.
5. Higher time resolution particle data and multispacecraft with smaller spatial scale separations, e.g., the MMS mission, are required to fully understand the dynamics associated with DFs.
References
Angelopoulos, V., C. F. Kennel, F. Coroniti, R. Pellat, M. Kivelson, R. Walker, W. Baumjohann, G. Paschmann, and H. Luhr (1992), Bursty bulk flows in the inner central plasma sheet: An effective means of earthward transport in the magnetotail, in Proceedings of the First
International Conference on Substorms (ICS-1), pp. 303–308, ESA Spec. Publ., Los Angeles, Calif.
Angelopoulos, V., et al. (1993), Characteristics of ion flow in the quiet state of the inner plasma sheet, Geophys. Res. Lett., 20, 1711–1714, doi:10.1029/93GL00847.
Artemyev, A., V. Lutsenko, and A. Petrukovich (2012), Ion resonance acceleration by dipolarization fronts: Analytic theory and spacecraft observation, Ann. Geophys., 30, 317–324.
Asano, Y., et al. (2008), Electron flat-top distributions around the magnetic reconnection region, J. Geophys. Res., 113, A01207, doi:10.1029/2007JA012461.
Ashour-Abdalla, M., M. El-Alaoui, M. L. Goldstein, M. Zhou, D. Schriver, R. Richard, R. Walker, M. G. Kivelson, and K.-J. Hwang (2011), Observations and simulations of non-local acceleration of electrons in magnetotail magnetic reconnection events, Nat. Phys., 7(4), 360–365.
Balogh, A., et al. (2001), The cluster magnetic field investigation: Overview of in-flight performance and initial results, Ann. Geophys., 19, 1207–1217.
Birn, J., and M. Hesse (2013), The substorm current wedge in MHD simulations, J. Geophys. Res. Space Physics, 118, 3364–3376, doi:10.1002/jgra.50187.
Birn, J., and M. Hesse (2014), The substorm current wedge: Further insights from MHD simulations, J. Geophys. Res. Space Physics, 119, 3503–3513, doi:10.1002/2014JA019863.
Birn, J., J. Raeder, Y. Wang, R. Wolf, and M. Hesse (2004), On the propagation of bubbles in the geomagnetic tail, Ann. Geophys., 22, 1773–1786.
Birn, J., A. Runov, and M. Hesse (2015), Energetic ions in dipolarization events, J. Geophys. Res. Space Physics, 120, 7698–7717, doi:10.1002/2015JA021372.
Chaston, C., J. Bonnell, L. Peticolas, C. Carlson, J. McFadden, and R. Ergun (2002), Driven Alfvén waves and electron acceleration: A fast case study, Geophys. Res. Lett., 29(11), 30–1, doi:10.1029/2001GL013842.
Chen, C., and R. Wolf (1993), Interpretation of high-speed flows in the plasma sheet, J. Geophys. Res., 98(A12), 21,409–21,419, doi:10.1029/93JA02080.
Chen, F. F. (1984), Introduction to Plasma Physics and Controlled Fusion, 2nd ed., Plenum, New York.
Chen, L., D. Larson, R. Lin, M. McCarthy, and G. Parks (2000), Multicomponent plasma distributions in the tail current sheet associated with substorms, Geophys. Res. Lett., 27(6), 843–846, doi:10.1029/1999GL010736.
Chen, L.-J., et al. (2009), Multispacecraft observations of the electron current sheet, neighboring magnetic islands, and electron acceleration during magnetotail reconnection, Phys. Plasmas, 16(5), 056501.
Curtis, S. (1999), The magnetospheric multiscale mission: Resolving fundamental processes in space plasmas: Report of the NASA Science and Technology Definition Team for the Magnetospheric Multiscale (MMS) mission, Tech. Rep. NASA/TM-2000-209883, Greenbelt, Md. Deng, X., M. Ashour-Abdalla, M. Zhou, R. Walker, M. El-Alaoui, V. Angelopoulos, R. Ergun, and D. Schriver (2010), Wave and particle
charac-teristics of earthward electron injections associated with dipolarization fronts, J. Geophys. Res., 115, A09225, doi:10.1029/2009JA015107. Denton, R., B. Sonnerup, M. Swisdak, J. Birn, J. Drake, and M. Hesse (2012), Test of Shi et al. method to infer the magnetic reconnection
geometry from spacecraft data: MHD simulation with guide field and antiparallel kinetic simulation, J. Geophys. Res., 117, A09201, doi:10.1029/2012JA017877.
Dunlop, M., D. Southwood, K.-H. Glassmeier, and F. Neubauer (1988), Analysis of multipoint magnetometer data, Adv. Space Res., 8(9), 273–277.
Eastwood, J., M. Goldman, H. Hietala, D. Newman, R. Mistry, and G. Lapenta (2015), Ion reflection and acceleration near magnetotail dipolarization fronts associated with magnetic reconnection, J. Geophys. Res. Space Physics, 120, 511–525, doi:10.1002/2014JA020516. Egedal, J., W. Fox, N. Katz, M. Porkolab, M. Øieroset, R. Lin, W. Daughton, and J. Drake (2008), Evidence and theory for trapped electrons in
guide field magnetotail reconnection, J. Geophys. Res., 113, A12207, doi:10.1029/2008JA013520.
Fazakerley, A., A. Lahiff, R. Wilson, I. Rozum, C. Anekallu, M. West, and H. Bacai (2010), PEACE data in the Cluster active archive, in The Cluster
Active Archive, pp. 129–144, Springer, Berlin.
Forsyth, C., et al. (2008), Observed tail current systems associated with bursty bulk flows and auroral streamers during a period of multiple substorms, Ann. Geophys., 26, 167–184.
Acknowledgments
We thank the Cluster instrument teams and the Cluster Active Archive for pro-viding the data used in this study. The data of FGM, PEACE, and CIS are avail-able at Cluster Science Archive website (http://www.cosmos.esa.int/web/csa). In this study, the PEACE data are obtained from PEACE data center at UCL/MSSL. The same data are also available at the Cluster Science Archive. Z.Y. thanks Zuyin Pu, Jiang Liu, Weijie Sun, and Quanqi Shi for use-ful discussions. Z.Y. is supported by UK Science and Technology Facilities Council (STFC) grant (ST/L005638/1) at UCL/MSSL. D.P. is supported by STFC grant ST/L000563/1. I.J.R. is supported by STFC grant (ST/L000563/1) and the National Environmental Research Council (NERC) grant (NE/L007495/1), and C.F. is supported by NERC grant (NE/L007495/1). This work is also sup-ported by NSFC grant (41404117). We would like to acknowledge the QSAS science analysis software for space plasma data.
Journal of Geophysical Research: Space Physics
10.1002/2015JA022238
Forsyth, C., M. Lester, A. Fazakerley, C. Owen, and A. Walsh (2011), On the effect of line current width and relative position on the multi-spacecraft curlometer technique, Planet. Space Sci., 59(7), 598–605.
Fu, H., Y. V. Khotyaintsev, A. Vaivads, A. Retinò, and M. André (2013), Energetic electron acceleration by unsteady magnetic reconnection,
Nat. Phys., 9(7), 426–430.
Fu, H. S., Y. V. Khotyaintsev, M. André, and A. Vaivads (2011), Fermi and betatron acceleration of suprathermal electrons behind dipolariza-tion fronts, Geophys. Res. Lett., 38, L16104, doi:10.1029/2011GL048528.
Hada, T., A. Nishida, T. Teresawa, and E. Hones (1981), Bi-directional electron pitch angle anisotropy in the plasma sheet, J. Geophys. Res.,
86(A13), 11,211–11,224.
Horne, R., R. Thorne, N. Meredith, and R. Anderson (2003), Diffuse auroral electron scattering by electron cyclotron harmonic and whistler mode waves during an isolated substorm, J. Geophys. Res., 108, 1290, doi:10.1029/2002JA009736.
Horne, R. B., R. M. Thorne, S. A. Glauert, J. M. Albert, N. P. Meredith, and R. R. Anderson (2005), Timescale for radiation belt electron acceleration by whistler mode chorus waves, J. Geophys. Res., 110, A03225, doi:10.1029/2004JA010811.
Hoshino, M., T. Mukai, T. Terasawa, and I. Shinohara (2001), Suprathermal electron acceleration in magnetic reconnection, J. Geophys. Res.,
106(A11), 25,979–25,997, doi:10.1029/2001JA900052.
Huang, S., M. Zhou, X. Deng, Z. Yuan, Y. Pang, Q. Wei, W. Su, H. Li, and Q. Wang (2012), Kinetic structure and wave properties associated with sharp dipolarization front observed by Cluster, Ann. Geophys., 30, 97–107.
Hwang, K.-J., M. Goldstein, A. F-Viñas, D. Schriver, and M. Ashour-Abdalla (2014), Wave-particle interactions during a dipolarization front event, J. Geophys. Res. Space Physics, 119, 2484–2493, doi:10.1002/2013JA019259.
Johnstone, A., et al. (1997), PEACE: A Plasma Electron and Current Experiment, in The Cluster and Phoenix Missions, pp. 351–398, Springer, Netherlands.
Keiling, A., et al. (2009), Substorm current wedge driven by plasma flow vortices: THEMIS observations, J. Geophys. Res., 114, A00C22, doi:10.1029/2009JA014114.
Kepko, L., M. Kivelson, and K. Yumoto (2001), Flow bursts, braking, and Pi2 pulsations, J. Geophys. Res., 106(A2), 1903–1915, doi:10.1029/2000JA000158.
Khotyaintsev, Y. V., A. Vaivads, A. Retinò, M. André, C. Owen, and H. Nilsson (2006), Formation of inner structure of a reconnection separatrix region, Phys. Rev. Lett., 97(20), 205003.
Kissinger, J., R. L. McPherron, T.-S. Hsu, and V. Angelopoulos (2012), Diversion of plasma due to high pressure in the inner magnetosphere during steady magnetospheric convection, J. Geophys. Res., 117, A05206, doi:10.1029/2012JA017579.
Liu, J., V. Angelopoulos, A. Runov, and X.-Z. Zhou (2013a), On the current sheets surrounding dipolarizing flux bundles in the magnetotail: The case for wedgelets, J. Geophys. Res. Space Physics, 118, 2000–2020, doi:10.1002/jgra.50092.
Liu, J., V. Angelopoulos, X.-Z. Zhou, A. Runov, and Z. Yao (2013b), On the role of pressure and flow perturbations around dipolarizing flux bundles, J. Geophys. Res. Space Physics, 118, 7104–7118, doi:10.1002/2013JA019256.
Liu, J., V. Angelopoulos, X.-Z. Zhou, Z.-H. Yao, and A. Runov (2015), Cross-tail expansion of dipolarizing flux bundles, J. Geophys. Res. Space
Physics, 120, 2516–2530, doi:10.1002/2015JA020997.
Lui, A. (1996), Current disruption in the Earth’s magnetosphere: Observations and models, J. Geophys. Res., 101(A6), 13,067–13,088. Mauk, B., et al. (2014), The Energetic Particle Detector (EPD) investigation and the Energetic Ion Spectrometer (EIS) for the Magnetospheric
Multiscale (MMS) mission, Space Sci. Rev., 199(1), 1–44.
McFadden, J., C. Carlson, and R. Ergun (1999), Microstructure of the auroral acceleration region as observed by fast, J. Geophys. Res., 104(A7), 14,453–14,480.
Nagai, T., I. Shinohara, M. Fujimoto, M. Hoshino, Y. Saito, S. Machida, and T. Mukai (2001), Geotail observations of the hall current system: Evidence of magnetic reconnection in the magnetotail, J. Geophys. Res., 106(A11), 25,929–25,949, doi:10.1029/2001JA900038. Nakamura, R., et al. (2002), Motion of the dipolarization front during a flow burst event observed by Cluster, Geophys. Res. Lett., 29(20), 3–1,
doi:10.1029/2002GL015763.
Nakamura, R., et al. (2004), Spatial scale of high-speed flows in the plasma sheet observed by Cluster, Geophys. Res. Lett., 31, L09804, doi:10.1029/2004GL019558.
Ni, B., D. Summers, and N. Meredith (2006), Timescales for radiation belt electron acceleration and loss due to gyroresonance with VLF chorus, ELF hiss, and EMIC waves, Eos Trans. AGU, 87(52), Fall Meet. Suppl., Abstract #SM33A-0342.
Øieroset, M., R. Lin, T. Phan, D. Larson, and S. Bale (2002), Evidence for electron acceleration up to∼300 kev in the magnetic reconnection diffusion region of Earth’s magnetotail, Phys. Rev. Lett., 89(19), 195001.
Owen, C., J. Slavin, A. Fazakerley, M. Dunlop, and A. Balogh (2005), Cluster electron observations of the separatrix layer during traveling compression regions, Geophys. Res. Lett., 32, L03104, doi:10.1029/2004GL021767.
Pritchett, P. (2015), Structure of exhaust jets produced by magnetic reconnection localized in the out-of-plane direction, J. Geophys. Res.
Space Physics, 120, 592–608, doi:10.1002/2014JA020795.
Rème, H., et al. (2001), First multispacecraft ion measurements in and near the Earth’s magnetosphere with the identical Cluster Ion Spectrometry (CIS) experiment, Ann. Geophys., 19(10/12), 1303–1354, doi:10.5194/angeo-19-1303-2001.
Robert, P., M. W. Dunlop, A. Roux, and G. Chanteur (1998), Accuracy of current density determination, in Analysis Methods for
Multi-Spacecraft Data, vol. 398, edited by G. Paschmann and P. W. Daly, pp. 395–418, International Space Science Institute, Bern.
Runov, A., V. Angelopoulos, X.-Z. Zhou, X.-J. Zhang, S. Li, F. Plaschke, and J. Bonnell (2011), A themis multicase study of dipolarization fronts in the magnetotail plasma sheet, J. Geophys. Res., 116, A05216, doi:10.1029/2010JA016316.
Runov, A., V. Angelopoulos, C. Gabrielse, X.-Z. Zhou, D. Turner, and F. Plaschke (2013), Electron fluxes and pitch-angle distributions at dipolarization fronts: Themis multipoint observations, J. Geophys. Res. Space Physics, 118, 744–755, doi:10.1002/jgra.50121. Russell, C., J. Gosling, R. Zwickl, and E. Smith (1983), Multiple spacecraft observations of interplanetary shocks: ISEE three-dimensional
plasma measurements, J. Geophys. Res., 88, 9941–9947, doi:10.1029/JA088iA12p09941.
Sato, T., and T. Iijima (1979), Primary sources of large-scale Birkeland currents, Space Sci. Rev., 24(3), 347–366.
Schmid, D., M. Volwerk, R. Nakamura, W. Baumjohann, and M. Heyn (2011), A statistical and event study of magnetotail dipolarization fronts,
Ann. Geophys., 29, 1537–1547.
Schwartz, S. J., E. Henley, J. Mitchell, and V. Krasnoselskikh (2011), Electron temperature gradient scale at collisionless shocks, Phys. Rev. Lett.,
107(21), 215002.
Sergeev, V., V. Angelopoulos, J. Gosling, C. Cattell, and C. Russell (1996), Detection of localized, plasma-depleted flux tubes or bubbles in the midtail plasma sheet, J. Geophys. Res., 101, 10,817–10,826, doi:10.1029/96JA00460.
Shang, W., et al. (2014), Braking of high-speed flows in the magnetotail: Themis joint observations, Chin. Sci. Bull., 59(3), 326–334. Shi, Q., C. Shen, Z. Pu, M. Dunlop, Q.-G. Zong, H. Zhang, C. Xiao, Z. Liu, and A. Balogh (2005), Dimensional analysis of observed structures