Sustainable Bio- or CO
2
economy: Chances, Risks,
and Systems Perspective
Andreas Pfennig[1],*
Supporting Information available online
Abstract
To obtain a consistent view of sustainable future
de-velopment, scenarios based on global balances have
been derived. The world population may grow
sig-nificantly faster than generally expected by many
studies with up to 11.6 billion people in 2050. The
climate goal of 1.5 °C can realistically not be reached
any more and it is shown why it has been so
diffi-cult to realize that strong action would have been
required years ago. Without change in behavior, a
strong competition for land area will develop,
mainly driven by human fertility and a large
frac-tion of animal-based food. While CO
2-based
econo-my does not compete with food production for
agri-cultural land area, its economic feasibility still needs
to be demonstrated. In a bio-based economy,
third-generation biomass alone will not be able to supply
enough feedstock to fulfill all demands. Thus,
com-petition with food production for land area will be
unavoidable. Besides economic and ecological
as-pects, also ethics need to be considered. A holistic
view is essential for deriving effective policies and
ethical guidelines, but it also needs to influence
per-sonal decisions.
Keywords:Bioeconomy, CO2economy, Sustainable-energy transition, Systems view
Received: March 05, 2019; revised: April 15, 2019; accepted: April 30, 2019
DOI: 10.1002/cben.201900006
1
Background
A continually growing body of knowledge has been developed on a variety of aspects of sustainable economy with hundreds of books and thousands of research articles. It has been realized that fossil-based economy leads to emission of green-house gases, which cause climate change and already today induce increasing problems like more frequent extreme weather events. This insight led to the COP 21 Paris agreement, ratified by many nations, agreeing on climate goals of limiting global mean temperature to +2.0 °C and to put significant effort into trying to limit it to +1.5 °C above pre-industrial level [1]. Alter-natively, utilizing biomass as a sustainable option for bio-materials production as well as bioenergy requires agricultural land area, which establishes a direct link to food scarcity and world hunger. Bioeconomy thus links very directly to several of the UN sustainable development goals including hunger, climate action, clean energy, and sustainable production. As an alternative to avoid the competition for land area, developing a CO2 economy has been proposed. Insight is thus required
into how bioeconomy competes with these upcoming as well as the already existing challenges and to relate this to a CO2
econ-omy.
To gain some understanding on how these different aspects of a complex system interact, a holistic view is desired, which puts the individual determining parameters into appropriate relation. Future development cannot be predicted since the trends cannot be foreseen today. Instead, only scenarios can be derived that indicate possible future development. On the other hand, if political or behavioral changes shall be resulting from the considerations, the interrelation between the main influ-encing parameters and the results, e.g., for the environment, have to be apparent. Thus, to derive the holistic view, simple and transparent models are used, where the influence of possi-ble variations of assumptions can be assessed directly. It is
—————
[1]
Dr.-Ing. Andreas Pfennig, University of Lie`ge, Department of Chemical Engineering, Products, Environment, and Processes (PEPs), Campus Sart-Tilman, Quartier Agora, Alle´e du Six Aouˆt 11, Baˆtiment B6c, 4000 Lie`ge, Belgium.
E-Mail: [email protected]
This is an open access article under the terms of the Creative Com-mons Attribution-NonCommercial-NoDerivs License, which permits use and distribution in any medium, provided the original work is properly cited, the use is non-commercial and no modifications or adaptations are made.
believed that only if the major influences can be directly under-stood, the results can be a firm foundation to derive guiding principles for future development. This is especially important since the result will also hint at aspects of sustainability ethics, which may influence individual personal decisions.
The basis of the approach taken here are balances which are applied to perform an evaluation of publicly available data on resources and their utilization. Data-driven trends of the past together with demands stemming from the development goals are utilized to get detailed insight into possible future scenarios and their consequences. The key parameters are then deter-mined that most significantly influence the overall system and which have an influence larger than any shift due to unex-pected trends. The approach is described and discussed in the following, where sections with too much detail distracting from the main line of thought are collected in the Supporting Infor-mation (figures with preceding S).
Since every individual on this planet earth is responsible for his or her demands leading to resource utilization and waste production, the development of the world population is dis-cussed first. Then the sustainable-energy transition from fossil resources to renewable energies will be considered because this will allow some characterization of the time scales on which to expect the changes to occur. The principal interaction of food production with the energetic or material use of biomass will be discussed next, which allows establishing a quantitative understanding for land area as limiting factor. Finally, the implications for material production based on carbon dioxide or bio-based materials will be analyzed, with special focus on available options to produce the major products of chemical industry, namely polymers.
2
World Population
Driving force for all anthropogenic use of resources and pro-duction of waste is the individual human, who has the desire to live his or her life in wellbeing. Aspects of that are sufficient supply of energy, food, and materials for fulfilling the everyday needs. These individual demands need to be scaled with the world population to determine the demand of humanity as a whole. Thus, world population is a key parameter for which the range of possible future development has to be realistically evaluated.
Data on past development and scenarios of future develop-ment of the world population are available from the Population Division of the Department of Economic and Social Affairs (DESA) of the UN [2] (Fig. 1). In most studies, it is assumed that the medium variant of the world population prospects (WPP) is most closely representing the development that is to be expected [3–5]. This is especially supported by the probabil-istic projections included in the 2017 revision of the UN pro-jections, indicating that the probabilities for the low and high scenario are significantly below 1% (see Fig. S2 in the Support-ing Information). In some studies even slower population growth is assumed [3, 6, 7].
The data supplied by the UN are updated regularly, typically every two years. To characterize how the projected scenarios change between the publications, the projection for 2050 is
shown in Fig. 2 as a function of the year, in which the data were published. The low and medium projections have been essen-tially continually increasing. To quantify the observed trend, linear curves have been fitted to the data published since 2002 because they show a relatively systematic behavior. It has been assumed that the three projections meet in 2050, because then the projections are no longer projections, but refer to a unique estimated value of the population in that year. By minimizing the deviations, the final value at the intersection as well as the gradient of the three curves have been fitted. The projection of scenarios indicates a world population of 11.62 billion in 2050, which is even above the value projected with the high variant shown in Fig. 1.
The question arises, why the evaluation by UN-DESA indi-cates a probability of <1 % for the high variant, even though the trend of the meta-study clearly points towards such high values. This can be understood by distinguishing between uncertainty and ignorance [20, 21]. In a complex system,
Figure 1. World population data according to the three scenar-ios published in the 2017 revision of the world-population pro-spects of the UN [2]; adapted from [8] with permission.
Figure 2. World population projected for 2050 as published in different years [2, 9–20]. Included are three linear fits which are assumed to meet at a single point in 2050, adapted from [8] with permission.
uncertainty may be quantified by statistical evaluations, while the lack of knowledge, technically called ignorance, which is decreasing over time, can typically not be quantified as easily. For the world population it turned out that the decrease in fer-tility in sub-Saharan African countries is less than expected, child survival rates increased globally more than expected, and the influence of HIV decreased [22]. It appears that while UN-DESA quantifies the uncertainty of their projections, the meta-evaluation shown above indicates an order of magnitude of variation induced by knowledge about the actual system behavior increasing over time. This lack of knowledge is not anyone’s fault but rather a consequence of the openness of the future to develop.
This evaluation shows that the high variant of the population scenarios leading to more than 16.5 billion people in 2100 has to be considered as scenario for future development since it is as realistically possible as the medium variant. Considering the continually increasing knowledge about future development, which can in principle not be known in advance and may follow past trends, probable scenarios may well lie between the medium and the high variant, which are thus systematically applied here as bounding scenarios. As shown, even scenarios above the high variant may occur.
This means that all projections of future development con-sidering only the medium variant of the population prospects or even slower population growth may draw a much too opti-mistic picture [3, 4, 6, 7]. Resource demands as well as waste and emissions produced may be underestimated by more than 15 % for 2050 and by a factor of 1.5 for 2100, the discrepancy continually increasing. Unfortunately, population is growing exponentially until the end of century according to the high variant.
How misleading it can be to ignore the trends in Fig. 2, is exemplarily demonstrated from the latest IPCC assessment report [3, 23], in which the population projections applied in the evaluated studies are summarized. It is indicated that the 5th to 95th percentile range is relatively narrow and lies well below the medium variant of the WPP 2012 [17].
While the impossibility to use the published sce-narios to quantify uncertainty is appreciated, it is nevertheless stated that ‘‘...the scenarios were gener-ated by experts making informed judgements about how key forces might evolve in the future’’ [3]. Thus, the narrow range of the evaluated scenarios suggests that experts agree on the future develop-ment of the world population and that they agree that this lies well below the medium variant.
Unfortunately, the scenarios used in that evalua-tion, for which data sources could be found, all use the medium variant, but from WPP published be-tween 2004 and 2010. The narrow range of scenar-ios thus results only from the shifts of the WPP medium variant between publication years 2004 and 2010 being small. That this range lies below the medium variant solely results from medium variants of WPP 2004 to 2010 being compared to the WPP 2012, which lies above (Fig. 2). Thus, the experts do not agree that a probable development lies below the medium variant of the UN
projec-tions. As consequence, emissions of greenhouse gases are sig-nificantly underestimated by the IPCC and other studies. Tran-sition scenarios may turn out significantly more challenging than presented in these studies [3, 4, 6, 7, 24–26].
This unfortunately also applies for the most recent special report of the IPCC on the 1.5 °C climate change [6]. The illus-trative model pathways of the IPCC, which are used in this spe-cial report for illustrating possible scenarios of successful future development, are compared to the world population prospects in Fig. 3 [2, 27]. Since the population scenarios are based on the values of the 2010 edition of the WPP, those data are included for comparison [16]. Compared to these WPP 2010 data, two of the illustrative model pathways lie rather close to the me-dium variant, the two others towards the end of the century significantly above the low variant. Compared to the 2017 edi-tion of the WPP, for which the low and medium variant moved significantly upward as compared to the WPP 2010, the two lower variants are partially even below the low variant and the two others are almost in the middle between the low and medium variant.
In the insert in Fig. 3, the curves are shown in close-up for a shorter time period. It becomes clear that the data of the WPP 2017 between 2010 and 2017 significantly diverge from the illustrative model pathways. This shows that the actual devel-opment during the last few years clearly indicates the inad-equacy of the population projections used in the IPCC special report on 1.5 °C climate change [6]. Unfortunately, also the most recent study of the Club of Rome applies a population projection which is even significantly below the low variant of the WPP 2017 [7]. Finally, also recent EU policies for sustain-able energy development take only the medium variant of WPP 2015 into account [24].
Thus, the projections of some of the most prominent studies, which are currently the basis for policy development, very likely draw a much too optimistic picture. All of the mentioned studies apply population scenarios which are only on the easier side of the range of realistically possible developments as seen
Figure 3. Population scenarios of the four IPCC illustrative model pathways P1 to P4 compared to the UN World Population Prospects of 2010 (indicated as WPP10), based on which they have been developed, and of 2017 (indicated as WPP17), the most current version [2, 6, 16, 27].
in the meta-study above and thus result in the distorted impression that we may be able to cope with climate change and world hunger with limited efforts. How mastering these challenges is influenced by the projections on world population will be shown below.
3
Sustainable-Energy Transition
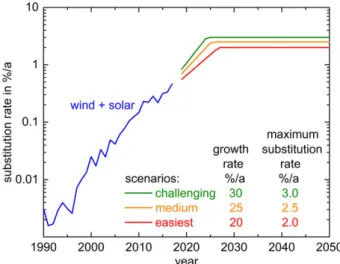
To reach the climate goals of the COP 21 Paris agreement [1], the share of renewable energy has to be systematically increased. Since the maximum potentials of hydro and geother-mal energy are limited, the major contribution for the sustain-able-energy transition has to be realized by solar and wind en-ergy. Their combined share in primary energy supply has increased by around 35 % a–1in 2000, a growth rate which con-tinually decreased after that, reaching around 20 % a–1 today
(see Fig. S5). Based on this historic development, it is assumed that characteristic and realistic future growth rates of wind and solar energy lie between 20 % a–1and 30 % a–1.
If these growth rates are projected further into the future, substitution rates develop as shown in Fig. 4. The substitution rate is the fraction of the total primary energy demand which is additionally substituted with renewable energy technology in the respective year. Nuclear energy is regarded as unsustain-able, specifically because of the unsustainable waste produced, and thus also to be substituted. Three scenarios are indicated for which the growth and substitution rates are quantified. Since a constant growth rate implies exponential growth, which is not feasible beyond certain limits, the scenarios are limited between 2 % a–1and 3 % a–1, with the latter being the assumed
maximum that can realistically be achieved on a global scale (see Supporting Information for details).
With a chosen scenario of world population and the pro-jected per-capita energy demand, the global primary energy demand is obtained (graphs see in the Supporting Informa-tion). With the growth and substitution rates of solar and wind energy the remaining demand results, which has to be supplied
with fossil primary energy carriers. Burning these energy car-riers in turn adds a defined amount of carbon dioxide to the at-mosphere, which finally allows determination of the resulting global mean temperature. The result for the high UN popula-tion variant is shown in Fig. 5. These scenarios are broadly in line with the climate objectives of the COP 21 Paris agreement. The scenarios for the medium population variant yield only slightly shifted results (see Fig. S7).
Fig. 5 shows that to reach the 1.5 °C climate goal, the sustain-able-energy transition needs to be completed around 2050, in agreement with IPCC evaluations [6]. For the 2 °C climate goal this should be achieved around 2070. Thus, reaching the cli-mate goals may be possible in principle but requires systematic increases in global substitution rates by a factor of 4 to 6 as compared to today’s 0.5 % a–1[28]. Comparison of Figs. 4 and 5 shows that the increase of renewables drives the sustainable-energy transition. It is thus not required to formulate CO2goals
for future decades, rather higher growth and substitution rates of renewables need to be reached today that include all energy sectors.
When the maximum annual consumption of fossil energy carriers is reached in around 5 years, the decline in demand may lead to significant price drops. Then the most expensive oil and gas extraction technologies like fracking may become uneconomical and corresponding sites may be shut down. Alternatively, they may be highly subsidized for political rea-sons in some countries, leading to corresponding high risks for the global economy. Additionally, in 10 to 20 years the produc-tion rates will drop below 80 % of the maximum, which may lead to problems in the downstream processes like refineries because their production rate may fall below feasible operating windows. Consequently, also downstream industries will undergo severe transitions and economical challenges. These are of course only possible aspects of future development, which could be balanced if properly managed. Nevertheless, the discussion shows that there is a high risk of strongly fluctu-ating supply of fossil feedstock and prices. At the same time, this implies significant challenges for the world economy
Figure 4. Historic data and projections of the substitution rate of wind and solar energy [28].
Figure 5. Reduction of CO2emissions according to the three
investigated energy-transition scenarios for the high UN popula-tion scenario.
accompanying the required restructuring of major industrial sectors. Finally, the timescale of these required changes, includ-ing establishinclud-ing a bio- or CO2-based economy, is just 30 to 50
years, depending on the climate goal to be reached.
This discussion also means that bio- or CO2economy, which
could be a sustainable basis for material production, should be on the way to be well established when the fossil feedstock pri-ces are expected to increase, i.e., in 3 to 20 years from now at the latest. If the climate change is limited to close to 1.5 °C, these effects can be expected significantly earlier, in little more than 10 years. Depending on the scenario, bio- or CO2
econo-my have to be fully established by 2050 to 2070.
Fig. 6 presents the effort required if sustainable-energy tran-sition is intensified only after some years. Growth and substitu-tion rates are assumed to be coupled (Fig. 6, left). The curves for the different scenarios appear to be horizontally shifted. The slope to still reach the 1.5 °C climate goal is already rather steep. Thus, independent of the population scenario, every year we miss to significantly increase the intensity of sustainable-energy transition leads to a strong increase of the required global efforts to still be able to reach 1.5 °C. Thus, continuing to negotiate boundary conditions of energy transition instead of fostering that transition itself, as at COP24 in Katowice, may not be adequate to reach the desired goals.
Comparing this globally required effort with the current sta-tus of how climate goals are tackled, it appears unrealistic that humanity can limit the climate change to 1.5 °C. We missed to realize that the system has shifted from the deceptive flat part of the curve into the steep section, where any further delay ren-ders the goal increasingly unattainable. At the same time, it is obvious, why reaching this conclusion is so difficult. It is appa-rently still possible to reach that climate goal in principle, but the effort is quickly increasing according to an essentially hyperbolic function.
Keeping in mind that it is desirable to limit climate change to the lowest possible temperature increase, from Fig. 6 it can
be seen that any climate goal slightly above the 1.5 °C will already be in or at least close to the steep section of the curve. This in turn means that determined action is instantaneously required on a global scale to still limit the global mean temper-ature increase as much as possible.
What appears urgently required is a long-term perspective of how the sustainable-energy transition can be realized. Cur-rently, major effort is focused on extending wind and solar energy on the one hand and, on the other hand, on the exit from coal and nuclear energy. It appears that these efforts are reaching a certain limit because during the last almost ten years in the EU the substitution rate stagnated below 1 % a–1 (see
Fig. S6). This indicates that with the current approach there may be some fundamental limitations for further progress which need to be overcome. Regarding the electricity system, e.g., in Germany, wind and solar energy indeed contribute a large fraction to electricity production. Since these sources show strong fluctuations on a daily and weekly basis, the con-ventional power plants are down-regulated if there is an excess of renewable energy. The capacity to do so is limited, which in turn limits further deployment of solar and wind energy. What would be required, is establishing significant capacity for energy storage. This means what would actually be urgently required is a consent on a consistent pathway of energy transi-tion accounting for all aspects of energy transitransi-tion including possibilities for energy storage. Thus, instead of promoting to switch off coal and nuclear power plants, the development of a consistent transition pathway to a sustainable energy system would be required.
Such a strategy would also need to consider the financial burden on the end consumers, who will have to replace their end-user appliances like cars or ovens, which need to be adapted to the energy carriers in a sustainable energy net-work. They also need to minimize end-energy demand, e.g., by house insulation. In developing a reliable transition strat-egy, all industrial sectors associated with a sustainable energy system would need to be included. Two major as-pects that have to be addressed are the ecological goals to be reached, which may be driven by so-cietal discourse, and the management procedures and decisions leading to industrial realization of these goals. Politics need to find a societal con-sent, which then acts as guard rail for the man-agement decisions of the industrial sectors con-cerned. This apparently requires an iterative procedure and a systematic way of updating be-cause insights into how the political measures affect the costs, the rate of transition as well as technological progress need to be fed back. If, as in the past, politics directly execute management decisions, like when to exit nuclear energy or coal in Germany, society will pay the extra price, not the management or the shareholders. Thus, a healthy balance between shareholders and stake-holders is required. Reaching a broad agreement about an optimal transition strategy requires a carefully monitored discourse, because it is fore-seeable that lobbyists, NGOs, and religions, to a large degree via the media, will try to exert their
Figure 6. Effort, expressed in growth and substitution rate of solar + wind ener-gy, required for reaching the climate goals, if prior to the start of the intensive
energy transition the growth rate is only 10 % a–1and substitution rate at most
influence, of which the democratic legitimation is not always clear.
It should be stressed that climate change will not vanish once sustainable-energy transition is completed. Instead it will stay with us with all its consequences for centuries. Successive transfer of CO2 from the quickly equilibrated upper ocean
layers into the large reservoir of deeper ocean layers is a slow process, which has a characteristic timescale of the order of a millennium [29].
In some of the scenarios evaluated by IPCC negative-emis-sion technologies are utilized to capture large fractions of the emitted CO2 [3, 6]. These technologies would allow an
over-shoot of atmospheric CO2concentration and to apply suitable
carbon-dioxide removal (CDR) technologies to nevertheless reach the climate goals. These CDR technologies are typically based on utilization of biomass like BECCS (bioenergy with carbon capture and storage) or AR (afforestation and refore-station), which compete with food production. In the scenarios of such studies this appears feasible, because due to assumed low population growth, competition with food production is limited. It is shown below and in the Supporting Information that these scenarios are unrealistic because population growth will not allow additional biomass utilization without significant increase in world hunger.
In the recent IPCC special report on global warming of 1.5 °C [6] three of the four illustrative model pathways assume a reduc-tion of CO2emissions between 2010 and 2020 by more than
50 %. Regarding the scenarios of Figs. 5, S7, and S8 as well as the current slow increase in renewable energies, these goals appear too challenging to be realistically reachable. Only one illustrative pathway realized a slower decline in CO2emissions, but
un-fortunately that scenario relies most strongly on negative-emis-sion technologies, which do not appear feasible at the assumed rate as mentioned above and shown in more detail below. Thus, with respect to the sustainable-energy transition this IPCC report draws a possibly much too optimistic picture.
4
Food Versus Fuel and Materials
Today more than 800 million people are undernourished, i.e., more than every tenths person is starving [30]. Thus, produc-tion of biomass, which is used for non-food applicaproduc-tions like biofuels and biomaterials, is already putting excessive pressure on agricultural land area today. In order to quantify this com-petition for agricultural land area, corresponding scenarios un-til 2100 have been developed.
Based on detailed evaluation of the FAOSTAT database [30], all required trends have been projected mostly linearly into the future, some with a slight quadratic contribution accounting for corresponding expected development (see Supporting Information for details). Caloric food supply is assumed to slightly increase until toward the middle of the century suffi-cient calories are supplied on average to be able to overcome undernourishment. It has also been assumed that the land-area specific agricultural productivity will continue to increase line-arly until 2100 as it did in the past. Also, for the production of animal-based food it has been assumed that intensification continues as in the past. Finally, it is assumed that 10 % of the
primary-energy demand is realized via biocombustibles pro-duced from dedicated biomass. Of this, 2.5 % alone will be required as jet fuel, the rest accounting for processes, e.g., in steel and chemical industry, which require carbon input or re-ducing atmosphere in chemical reactions.
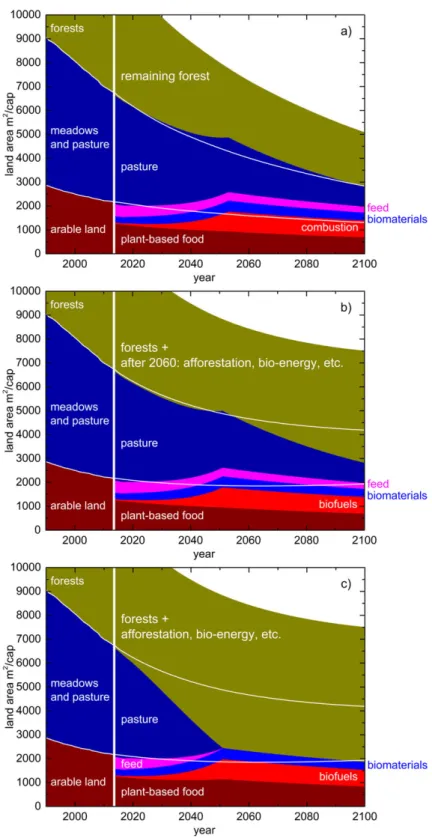
Three resulting characteristic scenarios of land area require-ment are shown in Fig 7. In the left part of each diagram the historical development of per-capita land area is shown, where only those contributions are considered that can be used agri-culturally with reasonable effort [30]. In the right part of each diagram the required land area for fulfilling the different demands is presented. The white lines indicate how the limits between arable land, pasture & meadows as well as forest area would develop considering only population growth.
As a basis for discussing the individual scenarios, it should be mentioned that every individual assumption can be debated. Variation of individual parameters within reasonable limits leads to changes in the results, which are typically smaller than the changes induced by the main parameters that are varied between the three scenarios shown. Also, variation of individu-al parameters affects the three shown scenarios in a comparable way, so that the differences between the scenarios are main-tained. Analysis thus allows identifying the major parameters and determining their influence.
For the high population variant, even with the continued increase of agricultural productivity which is assumed to con-tinue at maximum rate, conversion of forests into agricultural land is unavoidable if the number of undernourished people shall not increase (Fig. 7 a). If instead the population develops according to the medium variant, the pressure on the natural resources is still at an upper limit until around 2060 (Fig. 7 b). Only for the longer-term perspective the situation relaxes. If additionally, together with the sustainable-energy transition, the nutritional basis is shifted to solely vegetal nutrition, the pressure on natural resources relaxes significantly and instanta-neously (Fig. 7 c). The latter strong effect is caused by the large mismatch between food supply and land-area demand for ani-mal-based food. Today, 80 % of the land area on which food is produced, are used to generate animal-based food, e.g., as pas-ture and for feed production, which supply only 17.5 % of the food calories [30]. Thus, the production of animal-based food is highly land-area inefficient.
Comparing the different scenarios, it is apparent that popu-lation growth has a significant influence on the available area per capita. Only if the medium population variant is realized, the curves tend to stabilize towards 2100. For the high variant, the available land area per capita in 2100 will be less than half of that of today.
Reduction of animal-based food supply relaxes the situation quite considerably. Only the scenario shown in Fig. 7 c would allow for significant use of bioenergy and bio-based negative-emission technologies like BECCS without the risk to increase world hunger. In all cases, the biocombustibles, which cover only 10 % of the primary-energy demand, have a significant contribution. Thus, as long as people are starving, the fraction of bio-based energy and utilization of bio-based negative-emis-sion technologies should be minimized. Thus, if nutritional habits do not change, negative-emission technologies like BECCS or AR, which require fertile land area, can only have
limited impact on an ethically acceptable sustain-able-energy transition.
Fig. 7 shows that the required land area can be reduced by a factor of around 1.5 until 2100 by shifting from the high to the medium population variant while the choice of nutrition induces a fac-tor of around 2. Since it has already been assumed that agricultural productivity will continue to in-crease at the high rate observed in the past, there is no other parameter influencing land area utiliza-tion to a similarly large degree. Even, if materials and combustibles are solely produced from CO2
in-stead of biomass, the reduction in required agricul-tural land area would be less than 40 (Fig. 7 a).
Systematic utilization of genetically modified (GM) crops is sometimes proposed as another influencing parameter and workaround. It is shown in the Supporting Information, where also a variety of other options are discussed, that at least until now these GM crops do not show any advantage over conventionally bred crops, neither with re-spect to overall productivity nor concerning the fluctuations between years.
This comparison shows that the situation with respect to land area is rather different from that for energy. While the available technology is fully suffi-cient to establish sustainability, but only has to be realized on larger scale, behavioral aspects have a major influence on sustainable utilization of land-area. The pressure on the land area mainly depends on fertility, i.e., on the number of children per women in her lifetime, and on the food choices. If the behavior is not changed, agricultural intensity has to continually increase at the highest rate to avoid an increasing number of undernourished people or more forests need to be converted into agricultural land. If instead the behavior is changed, existing agricultural intensity is fully suffi-cient to supply enough food for everyone and to fulfill additional demands, e.g., for biomaterials, biofuels, and stabilizing biodiversity. In the context of world hunger, behavioral changes are signifi-cantly more important than any foreseeable addi-tional technological advancement. Thus, behavior change is unavoidable to reach the sustainability goals. This insight also establishes a direct link between bioeconomy and ethics.
Feeding a growing world population will require to convert a significant area of meadows and pas-ture into arable land (Fig. 7). For the high popula-tion variant with unchanged nutripopula-tional habits, roughly half of the area of the meadows and pas-ture will need to be rededicated. Only with behav-ioral changes the required shift can be limited.
Fig. 7 already hints that the competition for land area between food, biofuels, and biomaterials pro-duction is unavoidable, which will be discussed in more detail below. The land area for producing the feedstock even for biomaterials is small, but
de-Figure 7. Three scenarios of land-area utilization for the challenging energy scenario: a) high population variant, b) medium population variant, c) medium population variant and shift to solely vegetal food supply parallel to sustainable-energy transition; adapted from [8] with permission.
pending on the feedstock, can be significant. Thus, feedstock and technologies used for biomaterial production need to con-sider not only the energy demand but also the land area re-quirement.
5
Sustainable Chemicals and Fuels
Production
As seen above, a dramatic change of market situation for fossil carbon sources is to be expected in 30 to 50 years. Since today only around 4 % of these resources are utilized as feedstock for chemical processes, the chemical industry is strongly depen-dent on this future development. Chemicals and fuels can be produced in a sustainable way by either utilizing biomass or CO2from the atmosphere [33]. Also, bioeconomy can lead to
point-sources for CO2as (side-)product, which can be further
utilized. Finally, an additional carbon source to be utilized in successive process steps can stem from increased recycling, e.g., by recycling separated individual components, via pyrolysis, or gasification. Alternatively, complete combustion can supply energy and the generated CO2can further be used chemically.
All of these options would finally allow reaching a fully circular economy. Nevertheless, the question needs to be answered if and how it will be possible to fulfill the feedstock demands of the chemical industry as well as for combustibles along both possible routes, i.e., in a bio- or in a CO2-based economy. As
already mentioned above, for the chemical industry the focus is on the major products, i.e., large-scale polymers.
5.1 CO2in Chemical Industry
The utilization of CO2from the atmosphere has been proposed
as an urgent requirement for meeting the climate goals [31] and it has been shown that it may lead to reasonable costs for CO2[32]. The economic viability on a large scale nevertheless
still has to be proven. This is quite demanding since the liquid or solid absorbents proposed under optimal conditions typical-ly have a capacity of 2 ma % of CO2[34, 35]. Under realistic
conditions, which due to variable weather, i.e. humidity and temperature, are suboptimal as compared to the lab situation, at least 100 t of absorbent have to be moved and regenerated for each ton of CO2recovered from the atmosphere. Since the
absorbents typically degrade over time, the corresponding makeup streams further worsen the economic performance. In cases where CO2can be obtained from point sources, this
limi-tation does not apply.
The CO2can then be transformed into liquid hydrocarbon
as feedstock for the chemical industry or as biocombustible. Alternatively, the CO2can directly be utilized in processes
lead-ing to the final product. Examples for such processes are the conversion of CO2with hydrogen to methanol with a CO2
effi-ciency above 95 %, which is already realized on a scale of 5500 t a–1, and incorporation of CO2into polymers, which is
already commercialized [36–38]. Such processes are attractive, because the land area required for collection of sustainable energy like photovoltaics for activating the zero-exergy CO2is
not competing with agricultural land area. Thus, especially
available point-sources of CO2should be utilized as feedstock
for such processes. Nevertheless, it has to be shown that these processes are economically feasible on a large scale for each individual application.
The challenges become clear if the required energy for the process steps are considered. For the sorption of CO2from the
air, between 50 and 200 kJ mol–1CO2have been reported [35],
with the highest values referring to amine-based sorbents and the lowest to a moisture-swing process proposed by Lackner and coworkers. After CO2has been captured, the conversion
with hydrogen, e.g., to methanol, requires at least the chemical exergy of hydrogen, namely 734 kJ mol–1 CO
2. Actually, both
processes will show inefficiencies leading to actually higher en-ergy demands. Comparing these values to the electricity cur-rently obtained from fossil resources, from around 120 kJ mol–1 CO2for coal-fired power plants to 400 kJ mol–1CO2for power
plants with a gas turbine, it is obvious that overall, a significant multiple of the end-user energy gained today by burning fossil resources has to be supplied to convert carbon dioxide from the air as well as from point sources into hydrocarbons. Based on current electricity generation cost, this will lead to costs of at least around 2000 US$ t–1 of hydrocarbon feedstock pro-duced from carbon dioxide. Since these considerations are only intended to give a first impression of the challenges, actual process inefficiencies as well as taking into account the overall carbon footprint of each technology will lead to results that are even more challenging.
This directly shows why recycling of carbon-based materials will be so essential in a future sustainable economy. At the same time, the high energetic effort for the hydrogen supply means that structural recycling would be highly beneficial, which could also directly be inferred from exergetic considera-tions. If, on the other hand, remaining carbon-containing waste would be incinerated, the carbon dioxide recovered from this point source, and converted into chemicals feedstock, the large energy demand for hydrogen production could not be avoided. Thus, significant effort will need to be invested into the design of products and recycling pathways to allow recycling of indi-vidual components at least for large fractions of the major polymers. This applies not only for a CO2-based but equally
for a bio-based economy. In any case, recycling large fractions of the products would allow minimizing the remaining make-up-streams.
It should be stressed that this route is currently not an effi-cient means to reduce the greenhouse-gas emissions. The ex-ergy required to convert CO2to a liquid hydrocarbon, e.g., by
reaction with hydrogen obtained via electrolysis from sustain-able electricity, corresponds to the energy which is released when burning exactly that liquid. The latter process is realized today to produce electricity with an efficiency of typically less than 40 %. As long as we are using fossil primary energy carriers to generate electricity, it is more efficient by at least a factor of 2.5 to feed any excess electricity directly into the elec-tricity grid and to reduce the amount of fossil resources burnt than to utilize it for conversion of CO2into a liquid. This
ap-plies analogously for solid or gaseous fuel-like components produced from CO2and is also relevant for all carbon capture
and sequestration efforts that rely on such a conversion for safer storage of the carbon.
As alternative to the chemical route, the conversion of CO2
into lipids produced with algae cultivated in open-ponds or closed systems has been proposed. Since the lipid content in the algae is at most 70 % of the dry matter, and in the process up to several 10 % of carbon dioxide fed into the system are lost, the carbon efficiency is around 50 % at most [39]. This lies significantly below the carbon efficiencies reported for the chemical routes, which are well above 90 %. Thus, algae cannot compete with the chemical conversion described above.
5.2 Bio-Based Chemical Industry
The use of biomass for energy supply and for bio-based chemi-cals production has extensively been discussed and also mod-elled with significant detail, especially considering efficiencies and energetic requirements [6, 33, 40]. Bioenergy already being used today indicates that bioeconomy would be economically viable on large scale. As seen above, the production of biomass as feedstock for the chemical industry may compete with food production for essentially the same land area. Here the ques-tion is to be answered, which opques-tions for a bio-based economy are feasible, taking land area requirement into account. As a boundary condition, exergetic
evalua-tion of bio-based producevalua-tion routes shows that it is expected that oxygen-containing intermediates and products will be more favored than today, based on fossil feedstock [41] (see Supporting Information).
The land area required to fulfill the demand for bio-based chemicals has been determined for a variety of op-tions linking crops and major process routes (Fig. 8). On the one hand, the bars span the range obtained for the world average land-area specific pro-ductivity and, on the other hand, for average productivity of a major pro-ducing nation with the highest land-area specific yields for the respective crop [30]. The bars thus indicate char-acteristic land area demands. Up to the intermediate(s) mentioned, the proc-esses indicated in lighter green are cur-rently only realized on pilot-plant scale. Since these options are identical for the production of biocombustibles, the same considerations apply for bioen-ergy. If 10 % of the primary energy de-mand are to be realized via bioenergy as assumed above, the additional area demand is roughly twice that for bio-materials. The total area shown is the arable land area according to the high population variant. The indicated goal corresponds to the area for biomateri-als shown in Fig. 7 a. If world popula-tion would develop according to the
medium variant instead of the high variant, in 2050 1870 m2 per capita would be available instead of the 1685 m2cap–1 shown.
The routes are grouped according to the generation of bio-mass used. For first-generation biobio-mass edible components are directly utilized, and as second generation biomass the crops are grown on comparable land. With third-generation biomass the competition with food production is entirely avoided because, e.g., only byproducts like straw or dung from the food production are used.
In Fig. 8 also the radius is specified, in which a crop has to be grown to feed a chemical plant with 250 000 t a–1production
rate, where proper crop rotation has been accounted for [42]. The radii assume that the entire land area is solely agricultur-ally utilized, which applies approximately for regions like the corn belt in the US. To account for agricultural land area being typically interspersed with settlement and forest area, e.g., in Europe, a factor of roughly 3 would need to be applied [43]. If feedstock for the largest world-scale chemical processes with up to 3 Mt a–1shall be supplied, another factor of 3 needs to be added. In many cases this would lead to radii significantly exceeding 50 km, which appears a limit typically found for many bio-based plants like sugar plants. Therefore, for such
Figure 8. Evaluation of area demand in 2050 for various combinations of crops and inter-mediates as chemical feedstock, assuming that each individually supplies the total demand.
large chemical-industry complexes a decentralized supply needs to be realized, where the raw material is transferred between the sites producing the bio-based feedstock and the chemical industry complex, in which the end products like polymers are obtained.
For crops containing sugar, starch, or cellulose as major component, three exemplary options have been compared, which characterize different mass efficiencies, with which the major biocomponent ends up in the feedstock for successive steps. As first option, after depolymerization and fermentation only the ethanol is used while the CO2 is released into the
atmosphere. Alternatively, all atoms from the sugar can be uti-lized, either via sugar chemistry or by also utilizing the CO2
from fermentation, e.g., via methanol, as described above. Finally, ethylene as direct drop-in for conventional processes can be obtained by dehydration of ethanol [44, 45]. While this last option is minimizing the changes required in existing chemical processes, it maximizes required land area, because CO2and water are lost from the product molecule. On the
oth-er hand, for ethanol and methanol as feedstock, the successive chemical steps would need adjustment because large processes typically use ethylene and propylene as major feedstock. These three alternative routes have exemplary character, being real-ized already at least on pilot-plant scale. Other options are pos-sible, e.g., via lactic acid. Since the different routes for each crop are distinguished only by mass efficiency, interpolating land-area demand between the options for any alternative route is directly possible based on mass efficiency.
The land area required to supply biomaterials and bio-combustibles solely from third-generation biomass would be so large that essentially all rest biomass would need to be collected from all fields, in some options even exceeding the available rest biomass. The reason for this large area demand is the low efficiency of only around 50 % for the biochemical route to depolymerize cellulose used today on an industrial level. This can in part be understood as nature having successfully evolved cellulose and lignin such that they are difficult to be disaggre-gated as structural element in crops while as feedstock to bioeconomy they have to be depolymerized. The land area demand may decrease if more efficient chemical or biochemical routes are developed. On the other hand, a good alternative for utilizing this rest-biomass is to work it into the soil for humus formation, thus enhancing soil fertility. Only roughly one third of the rest biomass should be utilized to ensure sustainable soil fertility and agriculture [46]. Thus, the sustainable land area requirement for third-generation biomass is a factor of roughly 3 higher than the technical limit shown in Fig. 3. Taking these factors into account, third-generation biomass thus cannot be a major contribution in bioeconomy, it can only be an add-on where feasible. This in turn means that first and second-generation biomass will be essential for a bio-based economy, at the same time inducing the direct but unavoidable competition for land area with food production in a sustainable economy.
Fig. 8 shows that several options of first and second-genera-tion biomass demand sufficiently small agricultural land area, a significant number of options even for world-average produc-tivities. Possibly even a slight reduction of required agricultural land area as compared to Fig. 7 may be possible if the highest
productivities are realized. This shows that the scenarios of Fig. 7 can realistically be matched with appropriate routes.
In evaluating the options, aspects other than land area need to be accounted for. To plant oil palms, primeval forests are often cleared, which is detrimental for climate. Regarding reaction kinetics, mass efficiency, and process complexity, sugar- and starch-based processes are favored over cellulose-based routes, which in turn are less complex than those based on wood.
The most promising options use sugar cane, sugar beets, corn, miscanthus, or other reeds. The options are presented as if they would individually supply the complete feedstock to chemical industry, but depending on the local climate and soil situation, globally an appropriate mix of different options will be applied. Regarding required land area, it turns out that rape-seed oil needs a large area, which implies that using it as basis for biodiesel production today competes excessively with human nutrition. Overall, sugar-based options appear some-what advantageous compared to oil-based processes.
Figs. 7 and 8 now also allow to discuss the IPCC scenarios, several of which rely on negative-emission technologies to reach the climate goals [3, 6]. Fig. 7 shows that first- and sec-ond-generation biomass contributing as little as 10 % to the primary-energy demand is significantly competing with food production for agricultural land area. Without change in be-havior, BECCS can only be realized in an ethically acceptable way from third-generation biomass. The discussion of Fig. 8, on the other hand, shows that the amount of sustainable third-generation biomass in that case is very limited. This in turn means that the extra time which the utilization of BECCS can buy until a carbon-neutral economy is established, can also only be a fraction of the remaining time, i.e., some few years. Thus, in an ethically acceptable way BECCS cannot be de-ployed at the large scales assumed in many scenarios, including two of the four illustrative model pathways of the IPCC special report on 1.5 °C climate change [6]. Similar considerations lim-it the realization of AR. The higher contributions of BECCS and AR, e.g., in the IPCC illustrative model pathways, only appear feasible because they consider an unrealistically low population growth, as discussed above.
In the context of bio-based feedstock, algae are sometimes proposed as option with very high productivities. These high efficiencies are unfortunately only possible if CO2is fed to the
cultures. The CO2 is then utilized with lower efficiency as
would be possible along the chemical routes discussed above. Without the supply of CO2, the net-productivity accounting for
the energy required to operate, e.g., the open-pond systems, is less than that of optimal land-based crops. Thus, algae cannot be an optimal solution. They can only be a sensible option, if they are grown without CO2supply on land area not used
agricultur-ally. Unfortunately, under such conditions the efficiency is typi-cally decreased additionally, e.g., because light intensity and tem-perature are higher than would be optimal for the algae, and by excessive evaporation of water in open-pond systems [39].
Finally, a fundamental advantage of the bio-based route should be mentioned: As a side stream from several bio-based routes food components like proteins can also be obtained. This means that bio-based economy and food production may be synergistically interlinked at least to a certain degree and not as strictly competing as usually discussed.
6
Conclusions
If past trends continue, world population may grow much fast-er than predicted by many scenarios currently used to support policy makers, reaching a factor of 1.5 until 2100. Use of bioen-ergy and BECCS to limit net CO2emissions cannot be realized
to the degree required by these scenarios to limit climate change. The sustainable energy transition may thus be signifi-cantly more challenging than currently expected. Implemen-tation of sustainable energy technology should be fostered to limit climate change as much as possible, even though we pre-sumably already missed the 1.5 °C climate goal. This is espe-cially important since the economic situation may become challenging in the near future due to all simultaneous transi-tions lying ahead. Overall, a quick increase by a factor of 6 in substitution rate as compared to today would be required to limit climate change to 1.5 °C. These as well as the following conclusions have been drawn assuming that the world popula-tion will at most grow according to the high variant published by the UN. The meta-study shown in Figs. 1 and 2 indicates that the world population may realistically grow even faster leading to an even more challenging future.
The fight against world hunger is strongly governed by be-havioral aspects. Only two children per woman and shifting to solely plant-based food would ensure sustainability instantane-ously, removing the pressure on land area and agricultural pro-ductivity. This would free land area to such a degree that bioen-ergy could significantly contribute to the future enbioen-ergy mix, more land area could be left unused to support biodiversity, and also negative-emission technologies based on biomass could be established on large scale.
If these behavioral changes are not realized, agriculture will need to continually increase productivity at the highest possible rate for the foreseeable future and would still not be able to avoid an increasing number of undernourished people. In less developed regions such worsening of the food situation on top of the increasing climate challenges slows down development and consequently also leads to a slower decline in fertility. At a certain point a situation may be reached, where the more developed countries will no longer be able to support the global system to a degree required for an overall positive develop-ment. This constitutes a global developmental tipping point.
Even, if such a tipping point is avoided, a further increase in at least the perceived difference in living conditions between developed and least developed countries may significantly increase migration, putting further stress on the global system. It has to be kept in mind that exceeding certain limits of a driv-ing force inducdriv-ing a flux in chemical engineerdriv-ing very generally leads to an unforeseeable disruptive change in behavior, like the onset of Rayleigh-Be´nard or Marangoni convection. It is to be expected that exceeding comparable limits of driving force for migration, which is also just a flux, will lead to correspond-ing behavior. The mobilization of migrants from Honduras and El Salvador passing through Mexico starting in October 2018 as well as the migrants walking through Europe starting at the end of August 2015 may be seen as early onsets of such disruptive change in system behavior. If such transitions are to be avoided, significant effort needs to be put into reducing the driving force, i.e, to support the development in less developed
regions. Here a systems view needs to be taken, because it is clear that if we fail to achieve this goal, the negative consequen-ces will be globally realized.
The options for a sustainable economy can be viewed in this context. Since third-generation biomass alone cannot supply sufficient feedstock for the chemical industry and for the pro-duction of fuels, an economy based mainly on biomass cannot avoid putting additional pressure on agricultural land area. As long as the mentioned behavioral changes are not realized on sufficiently large scale, the production of biofuels or biomateri-als in a sustainable economy is ethically questionable because it fosters undernourishment. This applies already today for the current use of any first- or second-generation bioenergy like biodiesel from rapeseed or palm oil. In the EU policies this has already been realized to a certain degree and is accounted for in their policies on biofuels and indirect land use change [47]. Only if behavioral changes lead to a significant decrease of pres-sure on land area, bioeconomy can be realized without this ethi-cal conflict. Sufficiently far-reaching behavioral changes could even allow large scale implementation of bio-based negative-emission technologies, which would ease the sustainable energy transition. It has been shown that the technological aspects of bi-oeconomy can be realized with various process routes that are available today at least on pilot-plant scale.
At the same time, it has to be clear that there will be no im-mediate business case for CO2removal technologies, especially
not in the economically challenging times induced by the ma-jor transitions and current trends towards ‘‘my nation first’’. Only fostering policies of cap&trade emission rights may induce increased investment into carbon-saving or even negative-emis-sion technologies. All nations would need to adhere to such a policy even in the economically difficult times lying ahead.
A sustainable economy based on atmospheric CO2as major
feedstock can avoid the ethical conflict with undernourishment but suffers from high energy demand and the challenging CO2
capture. Until now, CO2capture from the atmosphere and
con-version has not been shown to work economically feasible on large scale despite around the two decades of research and strong political statements [31, 48]. If on the other hand CO2is
obtained from point sources, this carbon source should be uti-lized.
While CO2economy would avoid the competition with food
production, it may simply be economically so unattractive that bioeconomy wins the race. Thus, world hunger may signifi-cantly increase. To a certain degree this can be avoided if food components like proteins are obtained from side streams of the bio-based processes. At the same time, such a synergistic link-ing of food production and bioeconomy would increase the flexibility of the entire system to react appropriately, e.g., in cases of bad harvest, which can be expected to be more fre-quent in the future due to climate change. This discussion shows, that our individual behavior determines if a relatively easy to realize bio- instead of the today still demanding CO2
economy would be ethically acceptable, with a bioeconomy also significantly enhancing viability of the overall system.
It should be stressed again that the routes and the options discussed are regarded as if each would individually contribute the total feedstock for chemicals production. Of course, it is to be expected that a network of processes will be established,
which is finally fed from a variety of sources. This may include carbon dioxide, especially all CO2from point sources, as well
as biomass. Recycling may be increased and incorporated materially into the circular economy concept, e.g., by chemi-cally utilizing the CO2generated in waste incineration plants.
Of course, direct material recycling would be highly desired because it minimizes the energy demand. Also, waste streams from food production will presumably be more systematically utilized, e.g., for the generation of biogas, which is then intro-duced into the gas net. The routes discussed here are thus to be understood as exemplary cases characterizing certain material efficiency during conversion of primary feedstock into the final product. Second-generation has no benefit over first-generation biomass based on land area productivity. Due to the simplicity of the processes and typically higher efficiency, first-generation biomass has the advantage of lower energy and equipment demand. Thus, if the ethical aspects are solved, first-generation is to be preferred over second-generation biomass. Third-genera-tion biomass should be utilized as far as possible without imped-ing soil fertility.
The results presented show that major transitions for a sus-tainable economy are required within few decades if sustain-able wellbeing is to be achieved globally. At the same time, it has to be recognized that a major factor for reaching the sus-tainability goals is the change of individual behavior. Thus, some thoughts are required on how this can be achieved. For politicians in a democracy the desire to be re-elected is a major driving force. The managers of companies, on the other hand, will be driven by maximizing the profit for shareholders and themselves. Finally, the consumer would like to minimize ex-penses for living well. Thus, none of these individual drivers, which in public discourse agree on the rules according to which society develops, has a direct interest in enhancing sustainabil-ity of the system as a whole. The goal of sustainabilsustainabil-ity only entered recently because the consequences of the failure to establish a sustainable economy will arrive so soon that we our-selves will experience them. While it is positive that everyone now actually needs to account for these effects in his or her personal decisions, it is negative that we had to wait so long before the driving force became strong enough for us to finally act. Unfortunately, meanwhile the challenge to master the required changes in time has grown immensely. On the other hand, since the citizen/consumer decides on his or her behav-ior, elects the politicians in a democracy, and decides what to buy from which company, it is the only individual citizen who can actively change his or her behavior and thus influence the behavior of the system as a whole. Politicians will not be suc-cessful in establishing politics that the citizens do not support and managers will not be able to establish products that the consumers do not buy, even if they were beneficial or even required to achieve a sustainable economy. Thus, indeed we individually determine with our behavior the success of estab-lishing a sustainable economy and how difficult it will be to get there.
Finally, also the existing chances should be stressed. If the challenges are mastered and, especially, if sustainability becomes a major aspect in our personal decisions, we can reach full sustainability of the human society within roughly 50 years at the latest. In principle, the required technology is available
and for its implementation, the usual technical progress is sufficient.
Overall, these considerations show that in a future economy energy supply, material production, food generation, and agri-culture will be strongly interlinked. It is obvious that on top of technological, economic, and ecological considerations, also ethical aspects are relevant. A holistic systems view needs to be taken because only then the major interrelations can be appre-ciated. Of course, further aspects like water use and scarcity or the effect of climate change could be included. In the current considerations these have been excluded to focus on those factors that can be quantified relatively easily and which are directly linked via balances that can be overviewed and clearly communicated. This also limits the complexity, which may lead to a more reliable overall description. Increasing complexity can result in an only seemingly better description, hiding that the uncertainty of the additional parameters to characterize the system may be increasing [49]. It is apparent that the very fun-damental balances used allow gaining significant insight into the major drivers of the system [50, 51]. Since ethical aspects will be of major relevance for establishing sustainable wellbeing, a clear and easily comprehensible representation of the major interrela-tions is required to support the systems view and to induce behavioral changes. The comparably simple balances presented here may contribute to this goal. To guide individual behavior, these insights, including a certain understanding of the system as a whole, would need to be realized on an individual level, which in a democratic environment would then allow the correspond-ing societal trends to gain political impetus [52].
Acknowledgment
The author wishes to thank Gre´goire Le´onard for his support and intense discussions on CO2technologies. The author also
wishes to thank those unnamed who have so realidy shared their insights and opinions on the various aspects of sustain-able economy in personal communications.
The author has declared no conflict of interest.
Andreas Pfennig studied Chemical Engineering at RWTH Aachen. After a re-search stay at UC Berkeley with Professor John M. Praus-nitz, he received his Ph.D. from RWTH Aachen. After his habilitation at TU Darmstadt he became full professor at RWTH Aachen. In 2011, he moved to TU Graz and in 2014 became professor at the Department of Chemical Engi-neering of the University of Lie`ge, Belgium. His research interests are solvent extraction, phase separation, thermodynamics, and mass transfer as well as sustainability.
References
[1] www.unfccc.int/process-and-meetings/the-paris-agreement/ the-paris-agreement (Accessed on September 26, 2018) [2] 2017 Revision of World Population Prospects, United
Na-tions, DESA/Population Division, New York 2017. popula-tion.un.org/wpp/
[3] Climate Change 2014: Mitigation of Climate Change. Work-ing Group III contribution to the Fifth Assessment Report of the Intergovernmental Panel on Climate Change (IPCC) (Eds: O. Edenhofer et al.), Cambridge University Press, Cambridge 2014.
[4] OECD/IEA, World Energy Outlook 2016. webstore.iea.org/ world-energy-outlook-2016 (Accessed on September 18, 2018)
[5] T. Searchinger, R. Waite, C. Hanson, J. Ranganathan, P. Du-mas, E. Matthews, Creating a Sustainable Food Future. A Menu of Solutions to Feed Nearly 10 Billion People by 2050, Synthesis Report, World Resources Institute, Washington,
DC 2018.
www.wri.org/publication/creating-sustainable-food-future
[6] Global Warming of 1.5°C. An IPCC Special Report on the impacts of global warming of 1.5°C above pre-industrial levels and related global greenhouse gas emission pathways, in the context of strengthening the global response to the threat of climate change, sustainable development, and efforts to era-dicate poverty (Eds: V. Masson-Delmotte et al.), World Mete-orological Organization, Geneva 2018. www.ipcc.ch/sr15/ [7] J. Randers, in The Future in Practice: The State of
Sustain-ability Leadership, Cambridge University, Cambridge 2012. www.2052.info/wp-content/uploads/2014/01/p120801-2052-A-global-forecast-15p-illustrated-CPSL.pdf
[8] A. Pfennig, So gelingt unsere Zukunft, Books on Demand, Norderstedt 2018.
[9] G. K. Heilig, World Population Prospects: Analyzing the 1996 UN Population Projections, IIASA Working Paper WP-96-146, International Institute for Applied Systems Analysis (IIASA), Laxenburg 1996. pure.iiasa.ac.at/id/eprint/4882/ [10] UN Department of Economic and Social Affairs, Population
Division, Long-range World Population Projections: Based onthe 1998 Revision, United Nations, New York 1998. https://web.archive.org/web/20180614172204/www.un.org/ esa/population/publications/longrange/longrangeKeyFind.pdf [11] UN Department of Economic and Social Affairs, Population Division, World Population Prospects. The 2000 Revision, Vol. III, United Nations, New York 2002.
[12] UN Department of Economic and Social Affairs, Population Division, World Population Prospects. The 2002 Revision, Vol. III, United Nations, New York 2004.
[13] UN Department of Economic and Social Affairs, Population Division, World Population Prospects. The 2004 Revision, Highlights, United Nations, New York 2005.
[14] UN Department of Economic and Social Affairs, Population Division, World Population Prospects. The 2006 Revision, Highlights, United Nations, New York 2007.
[15] UN Department of Economic and Social Affairs, Population Division, World Population Prospects. The 2008 Revision, Highlights, United Nations, New York 2009.
[16] UN Department of Economic and Social Affairs, Population Division, World Population Prospects. The 2010 Revision, Vol. I, United Nations, New York 2011.
[17] UN Department of Economic and Social Affairs, Population Division, World Population Prospects. The 2012 Revision, Vol. I, United Nations, New York 2013. population.un.org/ wpp/Publications/
[18] UN Department of Economic and Social Affairs, Population Division, World Population Prospects. The 2015 Revision, Vol I, United Nations, New York 2015. population.un.org/ wpp/Publications/
[19] UN Department of Economic and Social Affairs, Population Division, World Population Prospects. The 2017 Revision, Vol. I, United Nations, New York 2017. population.un.org/ wpp/Publications/
[20] B. Wynne, NATO ASI Ser., Ser. I 1992, 2(2), 111–127. DOI: https://doi.org/10.1016/0959-3780(92)90017-2
[21] J. R. Ravetz, Sci. Commun. 1987, 9, 87–116. DOI: https:// doi.org/10.1177/107554708700900104
[22] P. Gerland, Personal communication, 01.08.2018. [23]
www.ipcc.ch/report/ar5/wg3/assessing-transformation-pathways/01_figure_6-1/ (Accessed on March 04, 2019) [24] A Clean Planet for all. A European strategic long-term vision
for a prosperous, modern, competitive and climate neutral economy, Europen Comission, Brussels 2018, COM(2018) 773 final.
[25] N. Scovronick, M. B. Budolfson, F. Dennig, M. Fleurbaey, A. Siebert, R. H. Socolow, D. Spears, F. Wagner, PNAS 2017,
114 (46), 12338–12343. DOI: https://doi.org/10.1073/
pnas.1618308114
[26] W. Lutz, PNAS 2017, 114(46), 12103–12105. DOI: https:// doi.org/10.1073/pnas.1717178114
[27] D. Huppmann et al., IAMC 1.5°C Scenario Explorer and Data hosted by IIASA, International Institute for Applied Systems Analysis, Laxenburg 2018. DOI: https://doi.org/ 10.22022/SR15/08-2018.15429
[28] BP Statistical Review of World Energy June 2018.
www.bp.com/en/global/corporate/energy-economics/ statistical-review-of-world-energy.html (Accessed on Sep-tember 21, 2018).
[29] F. Joos, R. Roth, J. S. Fuglestvedt, G. P. Peters, I. G. Enting, W. von Bloh, V. Brovkin, E. J. Burke, M. Eby, N. R. Edwards, T. Friedrich, T. L. Fro¨licher, P. R. Halloran, P. B. Holden, C. Jones, T. Kleinen, F. T. Mackenzie, K. Matsumoto, M. Meinshausen, G.-K. Plattner, A. Reisinger, J. Segsch-neider, G. Shaffer, M. Steinacher, K. Strassmann, K. Tanaka, A. Timmermann, A. J. Weaver, Atmos. Chem. Phys. 2013, 13, 2793–2825. DOI: https://doi.org/10.5194/acp-13-2793-2013
[30] www.fao.org/faostat/en/#data (Accessed on October 10, 2018) [31] K. S. Lackner, S. Brennan, J. M. Matter, A.-H. A. Park, A. Wright, B. van der Zwaan, PNAS 2012, 109 (33), 13156– 13162. DOI: https://doi.org/10.1073/pnas.1108765109 [32] K. S. Lackner, Eur. Phys. J. Special Topics 2009, 176, 93–106.
DOI: https://doi.org/10.1140/epjst/e2009-01150-3
[33] T. Marzi, G. Deerberg, C. Doetsch, A. Greve´, M. Hiebel, S. Kaluza, V. Knappertsbusch, D. Maga, T. Mu¨ller, H. Pflaum, A. Pohlig, M. Renner, U. Seifert, S. Stießel, C. Unger, T. Wack, E. Weidner, Kohlendioxid, Biomasse und
regenerativer Strom – Ressourcen einer neuen Kohlenstoff-wirtschaft, UMSICHT-Diskurs Heft 1, Verlag Karl Maria Laufen, Oberhausen 2017.
[34] E. S. Sanz-Pe´rez, C. R. Murdock, S. A. Didas, C. W. Jones, Chem. Rev. 2016, 116, 11840–11876. DOI: https://doi.org/ 10.1021/acs.chemrev.6b00173
[35] T. Wang, K. S. Lackner, A. Wright, Environ. Sci. Technol.
2011, 45, 6670–6675. DOI: https://doi.org/10.1021/
es201180v
[36] J. Artz, T. E. Mu¨ller, K. Thenert, J. Kleinekorte, R. Meys, A. Sternberg, A. Bardow, W. Leitner, Chem. Rev. 2018, 118, 434–504. DOI: https://doi.org/10.1021/acs.chemrev.7b00435
[37] Bayer MaterialScience CO2-to-Plastics Pilot Plant.
www.chemicals-technology.com/projects/bayer-co2-plastics/ (Accessed on September 27, 2018)
[38] George Olah CO2 to Renewable Methanol Plant, Reykjanes.
www.chemicals-technology.com/projects/george-olah-renew able-methanol-plant-iceland/ (Accessed on September 27, 2018).
[39] Y. Chisti, in Microalgal Biotechnology: Potential and Produc-tion (Eds: C. Posten, C. Walter), Walter de Gruyter, Berlin 2012.
[40] S. J. Gerssen-Gondelach, D. Saygin, B. Wicke, M. K. Patel, A. P. C. Faaij, Renewable Sustainable Energy Rev. 2014, 40, 964–998. DOI: https://doi.org/10.1016/j.rser.2014.07.197 [41] P. Frenzel, R. Hillerbrand, A. Pfennig, Chem. Eng. Res. Des.
2014, 92, 2006–2015. DOI: https://doi.org/10.1016/j.cherd. 2013.12.024
[42] Maximale Anbaukonzentration von Feldfruchtarten bzw. -gruppen, nach Zielen der nachhaltigen Pflanzenproduktion
in %, Landwirtschaftskammer NRW, Mu¨nster 2018
www.landwirtschaftskammer.de/landwirtschaft/ackerbau/ fruchtfolge/tabellen-fruchtfolge-pdf.pdf
[43] M. Kro¨hl, in 32. Bundestagung DLKG Mainz, Mainz, Sep-tember 2011. www.dlkg.org/media/files/bundestagung/dlkg_ bt2011_kroehl.pdf
[44] J. Althoff, K. Biesheuvel, A. De Kok, H. Pelt, M. Ruitenbeek, G. Spork, J. Tange, R. Wevers, ChemSusChem 2013, 6, 1625– 1630. DOI: https://doi.org/10.1002/cssc.201300478
[45] Ethylene from Ethanol. https://chematur.se/process-areas/ bio-chemicals/bio-ethylene-ethene/ (Accessed on December 28, 2018)
[46] N. Scarlat, F. Fahl, E. Lugato, F. Monforti-Ferrario, J. F. Dal-lemand, Biomass Bioenergy 2019, 122, 257–269. DOI: https://doi.org/10.1016/j.biombioe.2019.01.021
[47] Directive (EU) 2015/1513 of the European Parliament and of the Council of 9 September 2015 amending Directive 98/70/ EC relating to the quality of petrol and diesel fuels and amending Directive 2009/28/EC on the promotion of the use of energy from renewable sources (Text with EEA relevance), OJ L 239, 2015, 1–29. http://eur-lex.europa.eu/legal-content/ EN/TXT/?uri=CELEX%3A32015L1513
[48] H. Yang, Z. Xu, M. Fan, R. Gupta, R. B. Slimane, A. E. Bland, I. Wright, J. Env. Sci. 2008, 20, 14–27. DOI: https://doi.org/ 10.1016/S1001-0742(08)60002-9
[49] H. Hasse, in Reactive Distillation. Status and Future Direc-tions (Eds: K. Sundmacher, A. Kienle), Wiley-VCH, Wein-heim 2003.
[50] A. Pfennig, Chem. Ing. Tech. 2007, 79 (12), 2009–2018. DOI: https://doi.org/10.1002/cite.200700083
[51] A. Pfennig, Biotechnol J. 2007, 2, 1485–1496. DOI: https:// doi.org/10.1002/biot.200700129
![Figure 2. World population projected for 2050 as published in different years [2, 9–20]](https://thumb-eu.123doks.com/thumbv2/123doknet/5972903.148073/2.892.466.806.98.347/figure-world-population-projected-published-different-years.webp)


![[PDF] Cours générale d algorithme en pdf | Cours informatique](data:image/gif;base64,R0lGODlhAQABAIAAAP///wAAACH5BAEAAAAALAAAAAABAAEAAAICRAEAOw==)