HAL Id: hal-01009692
https://hal.archives-ouvertes.fr/hal-01009692
Submitted on 3 Jul 2014HAL is a multi-disciplinary open access archive for the deposit and dissemination of sci-entific research documents, whether they are pub-lished or not. The documents may come from teaching and research institutions in France or abroad, or from public or private research centers.
L’archive ouverte pluridisciplinaire HAL, est destinée au dépôt et à la diffusion de documents scientifiques de niveau recherche, publiés ou non, émanant des établissements d’enseignement et de recherche français ou étrangers, des laboratoires publics ou privés.
Clathrate hydrate equilibrium data for gas mixture of
carbon dioxide and nitrogen in the presence of an
emulsion of cyclopentane in water.
Aurélie Galfré, Matthias Kwaterski, Pedro Brantuas, Ana Cameirão,
Jean-Michel Herri
To cite this version:
Aurélie Galfré, Matthias Kwaterski, Pedro Brantuas, Ana Cameirão, Jean-Michel Herri. Clathrate hydrate equilibrium data for gas mixture of carbon dioxide and nitrogen in the presence of an emulsion of cyclopentane in water.. Journal of Chemical and Engineering Data, American Chemical Society, 2014, 59 (3), pp.592-602. �10.1021/je4002587�. �hal-01009692�
1
Clathrate hydrate equilibrium data for the gas
mixture of carbon dioxide and nitrogen in the
presence of an emulsion of cyclopentane in water
Aurélie Galfré, Matthias Kwaterski, Pedro Brântuas, Ana Cameirão, Jean-Michel Herri*
Ecole Nationale Supérieure des Mines de St Etienne, SPIN Center, PROPICE Department, CNRS-UMR 5307 LGF, 158 cours Fauriel, 42023 St Etienne, FRANCE.
ABSTRACT
Carbon dioxide and nitrogen gas separation is achieved through clathrate hydrate formation in
the presence of cyclopentane. A phase diagram is presented in which the mole fraction of CO2 in
the gas phase is plotted against the mole fraction of CO2 in the carbon dioxide + nitrogen +
cyclopentane mixed hydrate phase, both defined with respect to total amount of CO2 and N2 in
the respective phase. The curve is plotted for temperatures ranging from 283.5 K to 287.5 K and pressures from 0.76 MPa to 2.23 MPa. The results show that the carbon dioxide selectivity is moderately enhanced when cyclopentane is present in the mixed hydrate phase. Carbon dioxide could be enriched in the hydrate phase by attaining a mole fraction of up to 0.937 when the corresponding mole fraction in the gas mixture amounts to 0.507. When compared to the three
2
{water +carbon dioxide + nitrogen}, the equilibrium pressure of the mixed hydrate is reduced by
0.95 up to 0.97. The gas storage capacity approaches 40 m3 gas.m-3 of hydrate. This value turns
out to be roughly constant and independent of the gas composition and the operating conditions.
KEYWORDS
Clathrate hydrate, Carbon dioxide, nitrogen, cyclopentane, separation selectivity
Introduction
Greenhouse gas emissions have been identified as the major source of global warming. Among the greenhouse gases emitted into the atmosphere due to anthropogenic activities, carbon dioxide (CO2) plays a major role. One possible way to reduce the global CO2 emissions is to establish
suitable capture processes that can be integrated in existing plants and equipment and by which carbon dioxide can be removed from the considered flue gas streams. Flue gas mixtures of conventional post-combustion power plants are characterised by low carbon dioxide mole fractions ranging from 0.05 to 0.15. In addition, the respective gas streams are typically emitted
at high flow rate. The challenge is to develop CO2 capture technologies by which both energetic
and capital costs (size of the units) are minimized. An innovative technology for gas separation and capture could be based on a process making use of gas hydrate formation.
Gas hydrates are non-stoichiometric ice-like crystalline solids consisting of a combination of water molecules and suitable guest molecules under conditions of low temperature and high
pressure1. The water molecules are arranged in a three dimensional network in such a way that
they constitute cavities of different size and shape and size. In the centre of these cavities, an appropriately sized guest molecule can be enclosed. Three different crystalline structures referred to as structure I (sI), structure II (sII) and structure (sH) have been identified for ordinary
3
clathrate hydrates. The separation principle is based on the difference in affinity between CO2
and the other gas species for the particular hydrate cavity.
For the typical case of a steel making plant, an energetic costing performed by Duc et al.2 showed that the process making use of the semi-clathrate hydrate approach can be competitive compared to conventional capture technologies. The separation cost is mainly due to the gas compression stages. Hence, the objective is to lower the operational pressure.
A thermodynamic promoter enables the formation of hydrates at mild conditions of temperature and pressure. Among well-known thermodynamic promoters, such as
tetra-n-butylammonium bromide, (C4H9)4NBr (TBAB),2-6 or tetrahydrofuran, (CH2)4O (THF),7-13
cyclopentane, C5H10 (CP), is described in the literature as the strongest organic thermodynamic
promoter.14 When present in mixtures along with water, CP forms structure sII hydrates in which
cyclopentane could occupy the large cavities whereas the small molecules could get trapped in
the small cavities. Four-phases H-Lw-Lhc-V pressure-temperature equilibrium curves for the
ternary systems {H2O + CP + CO2}15-18 and {H2O + CP + N2}19-21 were studied by many authors
over the years. For the CO2 + N2 gas mixture, Li et al.22 first showed that the enrichment of CO2
in the corresponding mixed CO2 + N2 + CP hydrate is increased due to the presence of
cyclopentane. Their study focuses on the reaction rates and reveals the impact of the quality of the cyclopentane dispersion. However, the authors only tested the system for a single gas composition and, furthermore, they did not evaluate the gas storage capacity.
In this work, two parallel studies have been carried out. Initially, Henry’s constants of CO2 in
water, in cyclopentane as well as in a CP-in-water emulsion at several total mass fractions of
cyclopentane EM
CP
w have been estimated. The experimental data on Henry’s constants of CO2 in
4
284.2 K and for pressures below 1.2 MPa. Subsequently, the H - L - L - V four phase w hc
equilibrium in the quaternary system {H2O + CP + CO2 + N2} has been investigated
experimentally. Equilibrium data on pressure, temperature and the mole fraction of CO2,
determined with respect to the binary sub-system {CO2 + N2} in the considered phase, have been
obtained for the mixed CO2 + N2 + CP hydrate (z′ =CO2 xCOH 2 (xCOH 2+xHN2)) and the gas phase (
2 2 2 2
CO CO ( CO N )
y′ = y y +y ). The experimental data on
2
CO
z′ are plotted against the data on
2
CO
y′
and cover a temperature range from 283.5 K to 287.5 K and a pressure range from 0.76 MPa to 2.23 MPa. The experimental results for
2
CO
z′ and the equilibrium pressure H-L -Lw HC-G
eq, exp
p are
compared to corresponding results obtained from a simulation using our in house-software
“GasHyDyn” on the ternary system {H2O + CO2 + N2} without CP23. Finally, the benefit of
using cyclopentane in mixed CO2+N2+CP hydrates for lowering the equilibrium pressure is
quantified and the gas storage capacity GSC is calculated.
Experimental Section
Materials
All experiments were performed with ultrapure water obtained from the “MilliROs3”
purification system (Millipore, Merck AG) which was equipped with a “Milli-Q®
-AdvantageA10” cartridge (conductivity σ = 0.055 µS.cm–1, natural organic matter
NOM < 5 10–9).
Lithium nitrate (LiNO3) was provided via a standardised stock solution of the salt (LiNO3 mass
concentration of 1001 ± 5 mg.dm–3) in an aqueous nitric acid (HNO3) solution (HNO3 amount of
5
The suppliers of the remaining substances, along with their purities given in terms of mole fraction, are reported in Table 1.
Table 1. Purities and suppliers of the chemicals
Component Purity Source
CO2 CO2>0.99995 CnHn (n > 2) < 5 10–6 CO < 2 10–6 H2O < 7 10–6 O2 < 10 10–6 H2 < 1 10–6 N2 < 25 10–6 Air Liquid N2 N2>0.9999945 CnHn < 0.5 10–6 H2O (5 bar) < 3 10–6 O2 < 2 10–6 Air Liquid He H2>0.9999945 CnHn < 0.5 10–6 H2O (10 bar) < 3 10–6 O2 < 2 10–6 Air Liquid
C5H10 0.95 Chimie Plus laboratoires
Tween80® Not indicated Sigma Aldrich
Apparatus
A schematic representation of the apparatus used in this work is depicted in Figure 1. Further details are provided in the article of Herri et al.23 With the experimental setup, thermodynamic equilibria in systems with clathrate hydrate phases could be studied. Besides the measurement of temperature T and pressure p, the composition of all existing phases (gas, liquid and hydrate) could be determined. The experiments were performed in a stainless steel high pressure batch
reactor (autoclave, total volume V0 = 2.46 dm3). The reactor was temperature controlled via a
6
Rushton turbines mixed both the gas and the liquid phase individually. Thus, each of the fluid phases could be considered as a homogeneous region with respect to all intensive state variables.
Two polycarbonate windows (12 cm 2 cm× ), each of which was mounted on either side of the
reactor enabled the detection of the occurrence of a solid phase via direct visual observation. Two different pressure transmitters were used in the experiments. A PA/21S pressure sensor (Keller AG) with a range between 0 and 2 MPa and a precision of 0.001 MPa was employed when the operative pressure was less than 1.9 MPa. For pressures exceeding 1.9 MPa, a PA/33X transmitter (Keller AG) covering the pressure range between 0 and 10 MPa at a precision of 0.01 MPa was used. The temperature of each of the two fluid phases was measured by using two Pt100 temperature sensors (Prosensor) with a precision of 0.1 K, respectively. The measured data on temperature and pressure were recorded by means of the data acquisition unit which was directly connected to a personal computer. The emulsion to be tested was poured in a Pyrex cell (upper pressure limit of 10 MPa) which was located in the autoclave. Liquids could be injected into the pressurised reactor by using a PU-1587 HPLC pump provided by JASCO. Liquid
sampling (sample volume of 1-2 cm3) could be carried out via the appropriate valve. The initial
gas mixture was prepared by injecting the two gases consecutively into the reactor. The composition of the gas phase was determined by on-line gas chromatography (VARIAN gas chromatograph, model 450 GC). The gas phase sampling was carried out with a ROLSI
instrument. This device collected a small sample of a volume between 1 µm3 and 5 µm3 which
was directly injected into the loop of the chromatograph. The sample volume could be considered small compared to the total volume of the gas phase in the reactor.
7 P A tm V a c u u m T P,T T 1 2 7 3 4 5 9 10 12 14 13 11 6 Computer CPG 8
Figure 1. Schematic representation of the experimental setup : (1) gas cylinder (CO2,N2), (2)
cooling system, (3) reactor cell (2.46 dm3), (4) viewing window (12 cm 2 cm× ), (5) stirrer, (6) liquid sampling, (7) HPLC pump, (8) pressure sensor, (9) PT 100 temperature sensor, (10) ROLSI gas sampling, (11) He alimentation, (12) on-line gas chromatography, (13) pressure and temperature view, (14) data acquisition.
Preparation of the cyclopentane in water emulsion
Following the work of Li et al.22, a micro-emulsion of cyclopentane in water, i.e. a fine
dispersion of CP droplets within water, was prepared. After pouring a little amount of the surfactant Tween80® (leading to an overall mass ratio mTween80® m of 4.10w
-4
in water) into a
beaker, the water and a small quantity of lithium nitrate (LiNO3) (overall mass fraction
2 tracer , 0 tracer, 0 ( w , 0 tracer, 0) 10
w =m m +m − ) were added. The three components were mixed for two
minutes by using an Ultra-turax® homogeneizer-disperser (IKA T50, S50N-G45F) at a stirring
rate of 125.66 rad.s-1. Subsequently, a portion of cyclopentane was added to the mixture. The
emulsion was obtained by stirring the mixture for 5 min by means of the Ultra-turax®-disperser at
a stirring rate of 544.54 rad.s-1. Throughout this article, the amount of cyclopentane is given in
8
fraction with respect to the {water + CP} subsystem defined as EM
CP CP ( w CP)
w =m m +m . The
cyclopentane droplets size detected in the emulsion ranged from micrometers to tens of micrometers. A microscopic picture of the emulsion showing the CP-droplets is provided in Figure 2. The droplet size distribution characterising the emulsion quantitatively, is displayed in Figure 3.
Figure 2. Microscopic picture of the cyclopentane droplets constituting the CP in water
emulsion. Emulsion with an overall CP mass fraction EM
CP w of 0.0767. 0 1 2 3 4 5 6 7 8 9 1 10 100 V /% d32/µm
Figure 3. CP droplets size distribution (Malvern Mastersizer hydro 2000G) in a CP in water
9
Chromatographic analysis of the aqueous phase
After sampling the emulsion, the liquid sample was centrifuged to remove the organic phase to a great extend and thus to recover the aqueous phase only. The aqueous phase was analysed by means of a DIONEX ionic exchange chromatograph (off-line) to determine the concentration of
LiNO3. Throughout this study, LiNO3 was used as an electrolytic tracer. The ionic constituents of
LiNO3 were not incorporated into the hydrate structure and hence were concentrated in the
aqueous phase during hydrate formation. Via this change in tracer concentration, the water
consumption could be estimated.23, 24
Estimation of the solubility of carbon dioxide in the emulsion
The experimental approach consists in determining the amount of carbon dioxide consumed by the given cyclopentane + water emulsion. Several emulsions of CP in water with overall mass
fractions of cyclopentane EM
CP
w ranging from 0 to 1 were tested.
The reactor containing the empty Pyrex cell was closed, evacuated and flushed with CO2 (three
to four times) to erase any trace of other gases. Afterwards, the cell was pressurised with CO2 to
the desired operational pressure. The gas phase was sampled by means of the ROLSI instrument
and analysed on-line by gas chromatography to check the CO2 purity. The gas was stirred, cooled
down and maintained at the temperature of the first dissolution stage set at 284.2 K. After equilibrium had been attained, the stirrer was stopped and the emulsion was injected into the
reactor cell via the HPLC pump. The stirrer was turned on at a rate of 41.89 rad.s-1. The observed
pressure drop (Figure 4) indicated the dissolution of the gaseous component in the cyclopentane-in-water emulsion. After a while, the pressure and temperature attained constant values. This point at which the macroscopic gas dissolution has ceased is regarded as the first equilibrium
10
stage (Figure 4). Subsequently, the temperature was decreased by 1 K and a new equilibrium state, again indicated by stable values of temperature and pressure, was attained after several hours. This procedure was successively repeated until the temperature achieved 278.3 K.
276 278 280 282 284 286 288 290 292 294 0,4 0,5 0,6 0,7 0,8 0,9 1 0 20 40 60 80 T /K p /M P a t/h
Figure 4. Evolution of (––) pressure p and (----) temperature T of the liquid phase over time t. Dissolution of carbon dioxide in an emulsion of cyclopentane in water with an overall
cyclopentane mass fraction of wCPEM=0.278.
Hydrate crystallisation procedure
The experimental procedure is based on an isochoric approach by which the cell temperature is
decreased to form the hydrate phase.23,25 Mixed CO2 + N2 + CP hydrates were obtained by
establishing hydrate forming state conditions in the reactor which was initially filled with a
CO2 + N2 gas mixture to which the emulsion had subsequently been added. The emulsion was
comprised of wCPEM =0.0670 of CP in water, containing an overall mass fraction of LiNO3 of
1.10-2 and an overall mass ratio of the emulsifier Tween80® to water, mTween80® mw, of 4.10
-4
11
Initially, the reactor containing the empty Pyrex cell was closed and evacuated. The reactor was flushed three to four times with the first gas (CO2 or N2) to erase any trace of other gases
before it was filled with the considered gas to the desired pressure. The gas phase was sampled with the ROLSI instrument and analysed on-line by gas chromatography in order to check its purity. After stabilisation of temperature (typically 282 K) and pressure, the second gas was injected until the desired operational pressure was reached (Figure 5). The gas mixture was stirred and cooled down again to the target temperature (typically 282 K). When constant values of temperature and pressure were reached, the gas phase was analysed by gas chromatography to determine the initial gas composition.
In the following step, the stirrer was stopped and (0.8-1) dm3 of the emulsion was injected into the reactor by means of the HPLC pump (Figure 5). Upon introduction of the emulsion, a simultaneous increase of both temperature and pressure was observed. This simultaneous rise in
T and p was on the one hand due to the fact that the liquid mixture was prior to injection at
ambient temperature, and on the other hand due to the gas compression. The stirrer was started and a pressure drop (Figure 5) was observed which indicated the dissolving of the gas components in both the aqueous phase and the cyclopentane-rich organic phase. After a short time, a sudden increase in temperature accompanied by a pressure drop indicated the appearance of the first crystals (exothermic process). The crystallisation process was accompanied by a pressure decrease due to the gas consumption during the formation of the mixed hydrates (Figure 5). The gas phase, sampled with the ROLSI instrument, was analysed by on-line gas chromatography (Figure 6). After crystallisation had terminated the values of pressure and temperature approached constant values indicating that the system attained equilibrium. At this instant of time, samples of the emulsion and the gas phase were taken and analysed. A typical
12
diagram showing the mole fraction of CO2 in the gas phase against time during the dissolving
and crystallisation steps is presented in Figure 6.
281 282 283 284 285 286 287 288 289 290 291 292 0,1 0,3 0,5 0,7 0,9 1,1 1,3 1,5 1,7 1,9 0 10 20 30 40 50 60 70 T /K p /M P a t/h
Figure 5. Dissolving and crystallisation steps. Evolution of (---) liquid temperature T and (—) pressure p over time t in the reactor initially filled with a CP in water emulsion with
EM
CP, 0 0.0661
w = and an initial gas mixture of composition
2 2
CO , 0 N , 0 0.718 0.282
13 0,30 0,35 0,40 0,45 0,50 0,55 0,60 0,65 0,70 0,75 0,80 10 20 30 40 50 60 70 y 'CO 2 t/h
Figure 6. Dissolving and crystallisation steps. Evolution of the gas phase mole fraction of CO2
(relative to the total amount of the two gases)
2
CO
y′ over time t for a CP in water emulsion with
EM
CP, 0 0.0661
w = and an initial gas mixture of composition
2 2
CO , 0 N , 0 0.718 / 0.282
y′ y′ = at t =21.4
h. ( ) Experimental data.
Hydrate dissociation procedure
The dissociation of the hydrate phase was performed by means of an isochoric procedure in
which the reactor was heated in increments of ∆T = 1 K.1,23,25 Each of the incremental increases
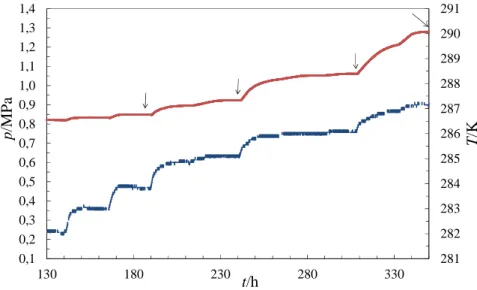
in temperature was accompanied by a simultaneous increase in pressure which was caused by the liberation of gas during the hydrate dissociation (Figure 7). After several hours, constant values for T and p were approached, indicating that thermodynamic equilibrium was attained. The gas
and the emulsion were sampled and the composition of each phase (liquids, hydrate, gas) at equilibrium was calculated (the calculation method is presented in detail in the supporting information). In the next step, the temperature was increased by 1 K and a new equilibrium state,
14
characterised by new values of temperature and pressure, was again reached after several hours. This procedure was successively repeated until the hydrate phase was completely dissociated.
281 282 283 284 285 286 287 288 289 290 291 0,1 0,2 0,3 0,4 0,5 0,6 0,7 0,8 0,9 1,0 1,1 1,2 1,3 1,4 130 180 230 280 330 T /K p /M P a t/h
Figure 7. Dissociation step. Evolution of (—) pressure p and (----) liquid temperature T over
time t. CP in water emulsion with an initial overall mass fraction of cyclopentane wCP, 0EM =0.0661
and initial gas composition of
2 2
CO , 0 N , 0 0.718 0.282
y′ y′ = . At each point marked with an arrow
→, gas sampling and gas chromatography, liquid sampling, centrifugation of the sample and ion
exchange chromatography were performed.
In this work, intermediate heating stages were regarded as true equilibrium states26. In practice,
it took several hours, before stable values of temperature, pressure and gas composition were
obtained and to be certain that equilibrium was attained.25
As long as cyclopentane was not completely consumed during the mixed hydrate phase formation, the equilibrium stages, visualised in Figure 7, were independent of the overall cyclopentane composition.
15
Experimental results and discussion
Results of the solubility measurements of CO2 in the cyclopentane in water emulsions
From the series of measurements of the solubility of carbon dioxide in the cyclopentane in water emulsions, experimental data on Henry’s constants for CO2 in water kH, CO , wLw 2 ( , )T p and in
cyclopentane hc
2
L
H, CO , CP( , )
k T p were derived in the temperature range from 278.3 K to 284.2 K and
at pressures below 1 MPa. The emulsions investigated are reported in Table 2. For an overall mass fraction of cyclopentane less than 0.1723, the system is a cyclopentane in water emulsion. At values for the overall mass fraction of cyclopentane greater than 0.2780, the system appears as an emulsion of water in cyclopentane.
Table 2. Characteristics of the emulsions in terms of the overall mass fraction of cyclopentane
EM CP, 0
w a, the total mass of emulsion EM
0
m a and the number of runs.
Initial overall CP mass fraction EM
CP, 0
w
Total mass of emulsion EM 0 g m Number of runs 0 800.00 2 0.0176 818.01 1 0.0183 800.04 1 0.0360 800.06 1 0.0767 800.52 1 0.1723 810.76 1 0.2780 737.17 1 0.6354 587.62 1 1.00 605.31 2 a
Relative standard uncertainty EM
r( 0 ) 0.003
u m = and combined relative standard uncertainty EM
c, r( CP, 0) 0.005
16
This procedure allows us firstly to check the reciprocal influence of water and CP on the gas
solubility. By varying the overall mass fraction of CP EM
CP,0
w , a case study analysis has been
performed coupled with a repeatability measurement, the Henry’s constant hc
2 L , H, CO , CP CP o ( , ) k T p σ and w 2 L , H, CO , w w o ( , )
k T p σ being measured from a slope determination.
Henry’s constant of CO2 in water and in CP, respectively, were calculated based on hypothesis
and according to equations described in detail in the supporting information. Briefly, a general
relation (eq 1) between the total amount of carbon dioxide dissolved in the emulsion nEMj ,
Henry’s constant of CO2 in cyclopentane H, , CPLhc CP, o ( , ) j k T p σ and in water Lw , H, , w w o ( , ) j k T p σ and the
overall mass fraction of cyclopentane in the emulsion EM
CP, 0
w was obtained from mass balances.
hc w w EM w EM w CP, 0 L , L , L , 2 0 CP H, , CP CP H, , w w H, , w w o o o 1 1 ; ( , ) ( , ) ( , ) j G EM j j j j n M M w j CO pm M k T p σ k T p σ k T p σ φ = − + = (1)
In eq 1, M and w MCP are the molar mass of water and cyclopentane,
G
j
φ is the fugacity
coefficient of CO2 in the gas phase, p is the pressure and m0EM is the total mass of emulsion.
The total amount of carbon dioxide dissolved in the emulsion nEMj could also be derived from
the mass balance in the gas phase.
G EM 0 R 2 G G 0 0 ,0 0 1 ; CO ( , , ) ( , , ) j j j p V pV n j R Z T p n T Z T p n T = − = (2)
In eq 2, R = (8.3144621 ± 0.0000075) J.K–1.mol–1 is the universal gas constant.27 The subscript
0 is used to designate the initial value of the state variables. Hence, T , 0 p and 0 Z T p n( ,0 0, Gj,0) denote the initial values of temperature, pressure and compressibility factor at the instant prior to the introduction of the emulsion. The corresponding quantities without the index “0” refer to each of the equilibrium stages, respectively, after the emulsion had been introduced into the
17
reactor. The total volume of the gas phase V was calculated by the following relation in which G
the reactor volume V and the emulsion volume R V0EM were known
G EM
R 0
V =V −V (3)
According to eq 1, by plotting the term nEMj Mw yjφGj p m0EMas function of the overall initial
mass fraction of cyclopentane in the emulsion wCP, 0EM , Henry’s constants in the cyclopentane
phase and in the water phase, hc
2 L , H, CO , CP CP o ( , ) k T p σ and w 2 L , H, CO , w w o ( , ) k T p σ , respectively, could be
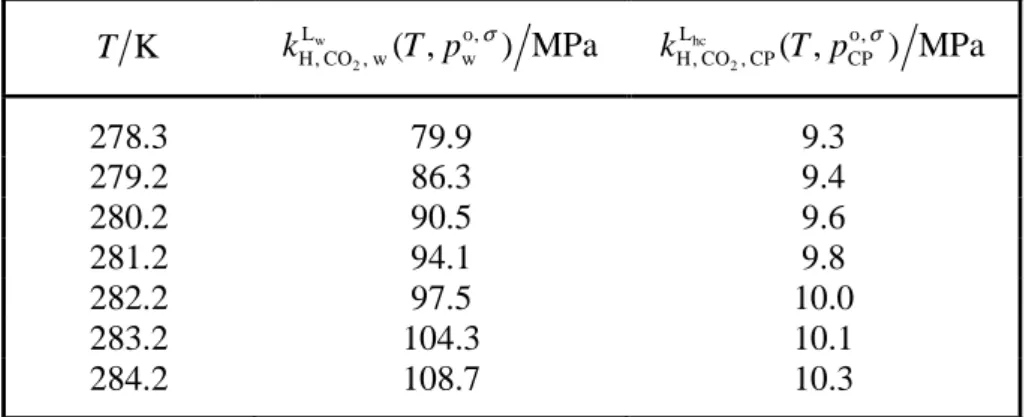
derived. The average values of Henry’s constants are presented in Table 3. Details about the calculation of their respective relative errors can be found in the supporting information.
Table 3. Experimental data on Henry’s constant of CO2 in water H, CO , wLw 2 w, o ( , ) k T p σ and in cyclopentane hc 2 L , H, CO , CP CP o ( , )
k T p σ , respectively, as function of temperature T a.
K T w 2 L , H, CO , w w o ( , ) MPa k T p σ hc 2 L , H, CO , CP CP o ( , ) MPa k T p σ 278.3 79.9 9.3 279.2 86.3 9.4 280.2 90.5 9.6 281.2 94.1 9.8 282.2 97.5 10.0 283.2 104.3 10.1 284.2 108.7 10.3 a
Relative standard uncertainty in temperature
r( ) 0.004
u T = and combined relative standard uncertainties in Henry’s constants of CO2 in the two solvents w
2 L , c, r H, CO , w w o ( ( , )) 0.110 u k T p σ = and ( hc 2 L , c, r H, CO , CP CP o ( ( , )) 0.116 u k T p σ = . The 2 , H, CO , o ( , ) s s
kπ T p σ data are, along with corresponding values calculated from correlations
18 2.0 2.5 3.0 3.5 4.0 4.5 5.0 3.50 3.52 3.54 3.56 3.58 3.60 103·K/T ln ( KH ,CO 2 ,CP /M P a) , l n (K H ,CO 2 ,H 2 O /M P a)
Figure 8. Experimental data and correlations of Henry’s constant of carbon dioxide in water
w 2 L , H, CO , w w o ( , ) k T p σ and in cyclopentane hc 2 L , H, CO , CP CP o ( , )
k T p σ as function of the inverse temperature T.
Data on Henry’s constant of CO2 in water: ( ) experimental results of this work, values
calculated from correlations of ( ) Holder et al.,28 and () Sloan and Koh.1 Experimental data
on Henry’s constant of CO2 in cyclopentane, this work: CP as droplets in emulsion ( ), CP
phase only ( ). (—) Empirical correlations.
The expression used for correlating Henry’s constant kH, ,π j s( ,T pso,σ) for π =L , Lw hc with
temperature was taken from an equation proposed by Holder et al.28
, H, , 1, , 0, , o 1 ( , ) MPa exp j s s j s j s k T p T π σ λ λ − = + for π =L , Lw hc (4)
By plotting the term H, , ,
o ln(k j s( ,T ps ))
π σ
as function of 1 T (see Figure 8), the empirical coefficients λ0, ,j s and λ−1, ,j s were obtained from the experimental data. They are compiled in Table 4 along with their respective relative uncertainties.
19 Table 4. Coefficients for Henry’s constant kH, ,π j s correlation28 with temperature T according to eq 4a.
Gas j Solvent Phase π [kH, ,j s]
π 0, ,j s λ λ−1, ,j s K CO2 H2O L w MPa 17.03 -3509.07 CO2 CP L hc MPa 7.28 -1407.44 a
Combined relative standard uncertainties
2 2 c, r( 0, CO , H O) 0.037 u λ = , 2 c, r( 0, CO , CP) 0.009 u λ = , 2 2 c, r( 1, CO , H O) 0.056 u λ− = and 2 c, r( 1, CO , CP) 0.038 u λ− = .
For water, our data are found to be in good agreement with the data obtained from the correlation of Sloan and Koh1 (see Figure 8). However, they seem to deviate slightly from the
values calculated by means of the parameters of Holder et al.28
For cyclopentane, we did not find a suitable correlation to compare our data with. However,
experimentally we observed that the solubility of CO2 in pure CP is similar than the solubility of
CO2 in CP droplets.
Establishing the data on Henry’s constants of CO2 is essential for estimating the carbon dioxide
solubility in the liquid phases (i.e, in cyclopentane and in water) at phase equilibrium, when the
mixed CO2 + N2 + CP hydrate, the liquid phases and the gas phase coexist with each other. For
nitrogen, due to the very low solubility of the gas in water, we did not succeed in measuring it
experimentally. Hence, the correlation for Henry’s constant of nitrogen in water, w
2
L
H, N , w( , )
k T p ,
20
Experimental H-L -L -G equilibrium data involving a mixed cyclopentane + carbon dioxide + w hc
nitrogen hydrate phase
Mixed hydrate phase composition is defined through mass balance equations under the condition of H-L -L -G four phase equilibrium. Details on the mass balance calculations are w hc provided in the supporting information. Briefly, the initial amount of substance of each gas j ,
G , 0
j
n ( j=CO or N2 2), is known. After the emulsion had been introduced and a solid hydrate
phase had been formed, four phases, the hydrate phase ( H ), a liquid aqueous (L ), a liquid w
cyclopentane-rich organic (L ) and a gas phase ( G ) co-existed in the system. Under these hc
conditions, the initial amounts of the two gases were distributed between these four phases. Hence, the following mass balance equation for gas amounts could be set up:
G H EM G ,0 j j j j n =n +n +n ( j=CO , N2 2) (5) In eq 5, H j n and G j
n stand for the mole number of the gas j in the hydrate phase and the gas
phase, whereas EM Lw Lhc
j j j
n =n +n denotes the mole number of gas j in the emulsion (organic phase
dispersed in the aqueous phase). The mole number of species j in the different phases in eq 5 was determined from mass balance considerations along with certain hypothesis (for further details it is referred to the supporting information). The complete set of experimentally derived
equilibrium data, i.e. data on pressure p, temperature T, the mole fraction of j (j = CO2 or N2) in
the gas phase
2 2
G G G
CO N
( )
j j
y′ =n n +n as well as in the mixed hydrate phase
2 2 H H H CO N ( ) j j z′ =n n +n is reported in Table 5.
21 Table 5. Experimental equilibrium data on the mole fraction z′j of component j in the mixed CO2 + N2 + CP- hydrate and the gas phase y′j
a
, respectively, at temperature T and pressure p
T / K p / MPa yCO′ 2 y′N2 zCO′ 2 zN′2 283.5 0.761 0.279 0.721 0.728 0.272 285.1 0.923 0.507 0.493 0.931 0.069 285.2 0.766 0.769 0.231 0.999 0.001 285.3 1.100 0.256 0.744 0.804 0.196 285.8 1.94 0.081 0.919 0.395 0.605 286.1 1.061 0.551 0.449 0.958 0.042 286.1 0.866 0.791 0.209 0.988 0.012 286.2 1.225 0.309 0.691 0.776 0.224 286.3 2.18 0.126 0.874 0.549 0.451 286.4 1.99 0.095 0.905 0.341 0.659 287.2 2.20 0.136 0.864 0.513 0.487 287.3 1.418 0.351 0.649 0.828 0.172 287.5 1.130 0.836 0.164 1.000 0.000
a Relative standard uncertainties u
r are u Tr( )=0.004, u pr( )=0.005 for p > 1.9 MPa and u pr( )=0.0017 for p < 1.9 MPa. Combined relative standard uncertainties
c, r( j) 0.0215
u y′ = and
c, r( )j 0.09
u z′ = .
Gas selectivity
Figure 9 shows the “selectivity curve” in which for the system {H2O + CP + CO2 + N2} under
the condition of H-L -L -G four phase equilibrium, the binary mole fraction of COw hc 2 in the mixed CO2 + N2 + CP hydrate phase, zCO′ =2 nCOH 2 (nCOH 2+nNH2), is plotted against the binary mole fraction of CO2 in the gas phase yCO′ =2 nCOG 2 (nCOG 2 +nNG2). This curve covers the temperature range from 283.5 K to 287.5 K and the pressure range from 0.76 MPa to 2.23 MPa. In addition to the experimental data, Figure 9 shows corresponding curves calculated via a simulation for the system without cyclopentane, i.e. for the system {H2O + CO2 + N2}, by means of the in-house
22 0 0,1 0,2 0,3 0,4 0,5 0,6 0,7 0,8 0,9 1 0 0,2 0,4 0,6 0,8 1 z'C O2 y'CO2
Figure 9. Mole fraction of CO2 in the hydrate phase zCO′ 2as function of the corresponding mole
fraction of CO2 in the gas phase yCO′ 2, both at equilibrium, for different temperatures T between
282.5 K to 287.5 K. Symbols correspond to experimental data at ( ) 282.5 K, () 285.3 K, (×)
286.2 K and ( ) 287.3 K. Literature data of Li et al.22 for ( ) emulsion system, and ( ) system
containing two “macroscopic” liquid phases. Simulations obtained by means of the in-house
software “GasHyDyn”23 for the corresponding system without cyclopentane at (---) 282.5 K,
(– – –) 285.3 K, (–––) 286.2 K and (···) 287.3 K.
It can be seen in Figure 9 that the carbon dioxide selectivity in the mixed CO2 + N2 + CP
hydrates is significantly increased compared to the theoretical selectivity of the gas hydrates
without any promoter. For example, the mole fraction of CO2 relative to the system {CO2 + N2}
present in the hydrate phase
2
CO
z′ approaches 0.931 for a corresponding mole fraction of CO2 in
the gas phase
2
CO
y′ of 0.507.
Experimental data presented by Li et al.22 for mixed CO2 + N2 + CP hydrates are added in
23
different ways. Firstly, the authors carried out measurements on the system in which cyclopentane appear in the form of an emulsion in water. Secondly, cyclopentane as a clear
separated phase from water has been studied. The feed gas contains a CO2 mole fraction of
0.166. This initial CO2 mole fraction drops to around 0.12 after crystallisation. It needs to be
underlined that their data are calculated from a gas uptake measurement. Therefore, there is no
distinction between the mixed CO2 + N2 + CP hydrate phase and the liquid phases. The
temperature is fixed at 281.25 K and the equilibrium pressures are ranging from 2.49 MPa to
3.95 MPa. Li et al.22 have observed differences in the gas uptake depending on the mesoscopic
state of the solution, i.e., depending on whether it exists in the form of an emulsion, or as two separated macroscopic phases. If one takes a look at their data, the respective values are higher than the nitrogen or carbon dioxide equilibrium pressure (see Figure 10). Besides, some data are in the stability zone of the gas hydrate phase formed with carbon dioxide only. Thus, the formation of carbon dioxide gas hydrate might occur during the crystallisation procedure and the presence of two types of hydrates (CO2 gas hydrates and mixed hydrates of CP + CO2 + N2)
might be realistic. Hence, it can be argued that the data of Li et al.22 are not at equilibrium and
24 0,0 0,5 1,0 1,5 2,0 2,5 3,0 3,5 4,0 280 282 284 286 288 290 292 p /M P a T/K
Figure 10. H-L -L -G or w hc H-L -G p-T-equilibrium dissociation data for systems with and w
without cyclopentane. Symbols corresponding to experimental data. CO2 + CP mixed hydrates:
data of ( ) Galfré et al.29, ( ) Zhang and Lee15,Zhang et al.16 and ( ) Mohammadi and Richon
(2009)18; N2 + CP mixed hydrates: () data of Tohidi et al.19, ( ) Du et al.20 and ( )
Mohammadi and Richon (2011)21; CO2 + N2 + CP mixed hydrates: ( ) this work; data of Li et
al.22 for ( ) emulsion system and ( ) system containing two “macroscopic” liquid phases. (----)
Simulations obtained with the in-house programme “GasHyDyn”23 for carbon dioxide gas
hydrates. The two encircled data points correspond to two points of dissociation of the hydrate phase.
The H-L -L -G p-T equilibrium data on the system exhibiting a COw hc 2 + N2 + CP mixed
hydrate phase which are displayed in Figure 10 were obtained during the dissociation procedure (Figure 7). The change in the slope of the pressure versus temperature curve at 284 K characterises the beginning of the dissociation. The repeated change in the slope of the same
25
curve at 287 K characterises the end of the dissociation. The two encircled data points correspond to two points of dissociation. These points are presented in Table 5.
Equilibrium pressure
The H-L -L -G equilibrium pressure of the mixed COw hc 2 + N2 + CP hydrate plotted against the
composition of the CO2 + N2 gas phase in terms of yCO′ 2is shown in Figure 11. Equilibrium
p-2
CO
y′ -curves obtained from a simulation of the H-L -G equilibrium on the system {Hw 2O + CO2
+ N2}23 by means of the in-house programme “GasHyDyn” are shown for comparison in Figure
11. 0,1 1 10 100 0 0,1 0,2 0,3 0,4 0,5 0,6 0,7 0,8 p /M P a y'CO2
Figure 11. Gas hydrate H-L -L -G equilibrium pressure p as function of the corresponding w hc
mole fraction of CO2 in the gas phase yCO' 2 in the temperature range T from 282.8 K to 287.5 K.
Symbols correspond to experimental data: ( ) 282.5 K, () 285.3 K, ( ) 286.2 K, ( ) 287.3 K.
Literature data of Li et al.22 for ( ) (emulsion system) and ( ) (system containing two
26
system without cyclopentane at 282.5 K (---), 285.3 K (– – –), 286.2 K (–––) and 287.3 K (···)
obtained by means of the in-house “GasHyDyn” software.23
Compared with the calculated equilibrium pressure for mixed CO2+ N2 -gas hydrates formed in
the system without any promoter, the equilibrium pressure is drastically decreased for the system in which cyclopentane is additionally present. Quantitatively, the pressure reduction factor F defined in eq 6 does assume values ranging from 19 to 34, corresponding to a relative pressure reduction of 0.95 up to 0.97. w w hc H-L -G eq, cal H-L -L -G eq, exp p F p = (6) In eq 6, H-L -Gw eq, cal
p is the equilibrium pressure estimated by means of the in-house
“GasHyDyn”-programme for gas hydrates formed in the ternary system {H O CO2 + 2+N }2 .
w hc
H-L -L -G eq, exp
p is the
equilibrium pressure measured for the four phase H-L -L -G equilibrium in the quaternary w hc
system {H O CP CO2 + + 2+N }2 exhibiting a mixed CO2 + N2 + CP- hydrate phase.
Gas storage capacity
In order to illustrate how much of gas, expressed in terms of its volume under defined p-T-state conditions, is incorporated into the hydrate structure, the so-called gas storage capacity GSC is introduced. The gas storage capacity of gas hydrates is defined as the ratio of the volume of the total amount of gas which is consumed in order to form the hydrate phase
2 2 2 2
G H H
CO N ( ref, ref, CO , N )
V + T p n n , normalised to reference state conditions of Tref = 273.15 K and
pref = 0.101325 MPa, and the corresponding volume of the gas hydrate phase V by which the H
gases along with cyclopentane are captured.
2 2
G CO N
27
numbers of the enclathrated gases,
2 H CO n and 2 H N
n , that have previously been consumed from the
gas phase upon hydrate formation, and the molar volume of the gas phase under reference conditions. The gas phase, consisting in good approximation of CO2 and N2 only, has a molar
volume under reference conditions of
2 2 2
G
m, CO N ( ref, ref, CO )
V + T p y , which will in the following be
abbreviated as 2 2 G m, CO N , ref V + . The value of 2 2 G m, CO N , ref
V + is estimated by means of the
Soave-Redlich-Kwong equation of state and is close to the ideal gas value of approximately 22.4 dm3.mol–1. The volume of the hydrate phase V can be also expressed by means of the H
molar volume of the hydrate phase, V , and the corresponding mole numbers of the constituents mH
present in the solid phase n , wH H CP n , 2 H CO n and 2 H N
n . Thus, the expression for GSC reads:
2 2 2 2 2 2 2 2
2 2
G H H H H G
CO N ref ref CO N CO N m, CO N , ref
H H H H H H w CP CO N m ( , , , ) ( ) ( ) V T p n n n n V GSC V n n n n V + + + = = + + + (7)
As a non-stoichiometric solid, the hydrate phase is to be regarded as a solid solution of the
guest components in the metastable host lattice.30 Therefore, as a property of a mixed phase, V mH
does also depend on composition. It can be estimated from crystallographic data of the sII unit
cell by means of the following relation1
(
2 2 2 2)
H H uc Av m H H H H H H H w , uc 1 ν θsm( CP sm θCO sm θN sm) ν θl g( CP lg θCO lg θN lg) = + + + + + + V N V N (8)where Nw , ucH designates the number of water molecules in the unit cell. νi is the number of cavities of type i per water molecule in the corresponding unit cell (i∈{sm, lg}, with “sm”
indicating the small and “lg” the large cavity, respectively, and νsm=2 17 and νlg =1 17 for sII
hydrates). θHj i is the occupancy factor of cavity i by guest molecule j ( j∈{CP, CO , N }2 2 ).
23 1
Av 6.02214129(27) 10 mol
N = × − is Avogadro’s constant. 27 H
uc
28
cell of sII clathrate hydrate which can be calculated from its corresponding lattice parameter a uc
according to:
H 3
uc uc
V =a (9)
The numerical value for the cell parameter provided in the monograph of Sloan and Koh1,
uc 1.73 nm
a = , is a typical average value and used in this study as well. The occupancy factors
H sm
j
θ and θjHlg and the number of guest molecules j enclathrated in the unit cell, NHj, uc, are related by
(
)
H H H H H H , uc sm, uc lg, uc w , uc sm sm lg lg j j j j j N =N +N =N ν θ +ν θ j∈{CP, CO , N }2 2 (10)Since at equilibrium the concentration of a given species in the unit cell is identical to the concentration in the macroscopic hydrate crystal, the ratio between NkH, uc and
H k
n , the mole
number of species k in the macroscopic crystal, is constant for all k∈{w, CP, CO , N }2 2 .
2 2 2 2 H H H H CO N w CP H H H H w, uc CP, uc CO , uc N , uc = = n = n n n N N N N (11) By substituting H m
V in eq 7 for the general expression given in eq 8 and taking into account eqs
10 and 11 the following equation is derived for GSC
2 2 2 2 H H H G w , uc CO N m,CO +N , ref H H w uc Av ( ) N n n V GSC n V N + = (12)
Eq 12 expresses the gas storage capacity in terms of the experimentally accessible quantities H w n , 2 H CO n and 2 H N
n . From this relation, the GSC values obtained from the experimental data were
calculated. Alternatively, by again combining eq 7 with eqs 8, 10 and 11, the gas storage capacity can be expressed by means of the occupancy factors of the two gases as
2 2 2 2 2 2 H G H H H H w , uc m, CO N , ref sm CO , sm N , sm lg CO , lg N , lg H uc Av ( ( ) ( )) N V GSC V N ν θ θ ν θ θ + + + + = (13)
29
In Figure 12, the gas storage capacity GSC for mixed hydrates is plotted against the
composition of the CO2+N2 gas phase in terms of yCO′ 2. In this diagram, it can be seen that the
GSC is in the range of (20-60) m3 gas.m-3 hydrate (Table 6), scattered around a mean value of 40
m3gas.m-3 hydrate with a precision of 0.06 (see supporting information for details).
The GSC-data derived by means of eq 12 can be compared to different limiting values for this quantity. The first hypothetical limit is derived under the condition that the 16 small cavities are completely occupied by gas molecules while the large cavities are assumed to be occupied by CP-species only. Under these conditions, mathematically expressed by
2 2 H H CO sm N sm 1 θ +θ = and 2 2 H H H CP lg 1 CO lg N lg 0
θ = ⇔θ +θ = , the limiting value GSClim, 1 obtained from eq 13 is given by
2 2 2 H G w , uc sm m ref ref CO H H H lim,1 CO sm N sm CP lg H uc Av ( , , ) ( 1) N V T p y GSC GSC V N ν θ θ θ = + = = = (14)
which leads to a numerical value of 115 m gas.m hydrate . The GSC-values derived from the 3 -3
experimental results should further be compared to a second hypothetical limiting value,
lim, 2
GSC , calculated for the condition that all of the cavities are completely occupied by gas
molecules only. In this case, characterised by
2 2 H H CO sm N sm 1 θ +θ = and 2 2 H H CO lg N lg 1 θ +θ = , the
following relation is derived from eq 13
2 2 2 2 2 H G w , uc sm lg m ref ref CO H H H H lim, 2 CO sm N sm CO lg N lg H uc Av ( ) ( , , ) ( 1) N V T p y GSC GSC V N ν ν θ θ θ θ + = + = + = = (15)
which leads to GSClim, 2 =172.41 m gas.m hydrate3 -3 .
Consequently, the GSC-value derived from our results for the system with CP is smaller by
around 0.65 and 0.77 compared to the hypothetical bounds set by GSClim, 1 and GSClim, 2. It is
30
on a different type of hydrates, the so-called (gas-) semi-clathrate hydrates, which can be formed when tetra-n-butyl ammonium bromide is additionally dissolved in the aqueous phase.
0 10 20 30 40 50 60 70 80 90 100 0 0,1 0,2 0,3 0,4 0,5 0,6 0,7 0,8 0,9 G S C (m 3g as .m -3 h y d ra te ) y'CO2
Figure 12. Gas storage capacity GSC for CO2+N2 gas mixtures from 282.5 K to 287.5 K as
function of the mole fraction of CO2 in the gas phase yCO′ 2 (with respect to the total amount of
CO2 + N2, i.e., yCO′ 2+yN′2 =1) . Symbols correspond to experimental data at ( ) 282.5 K, () 285.3 K, ( ) 286.2 K, ( ) 287.3 K.
31 Table 6. Experimental equilibrium values of GSC at corresponding gas mole fraction of CO2
2 CO y′ and temperature Ta. T / K yCO′ 2 GSC / m 3 gas.m-3hydrate 283.5 0.279 29.8 285.1 0.507 54.5 285.2 0.769 43.6 285.3 0.256 36.5 285.8 0.081 46.7 286.1 0.551 36.2 286.1 0.791 38.8 286.2 0.309 36.9 286.3 0.126 29.0 286.4 0.095 62.3 287.2 0.136 32.4 287.3 0.351 29.1 287.5 0.836 21.4
a The relative standard uncertainty
r( )
u T amounts to u Tr( )=0.004. The combined relative standard uncertainties for 2 CO y′ and GSC are 2 c, r( CO ) 0.0215 u y′ = and c, r( ) 0.06 u GSC = .
The low occupancy of the hydrate lattice sites by the molecules of CO2 and N2 may be due to
the fact that the stabilisation by cyclopentane molecules is very efficient and does not require a greater amount of additional gas to stabilise the structure. Contrary to our experimental results
(Table 6), Li et al.31 did not observe CO2 molecules enclathrated in the different cavities of the
sII hydrate structure via x-Ray analysis. However, their experiments were performed at 276.15 K, i.e. at a temperature which is below the formation temperature of pure cyclopentane
hydrate, located at 280.22 K.14 In this temperature zone, Herslund et al.32 demonstrated that there
is a competition between the formation of gas-cyclopentane hydrate and the pure cyclopentane hydrate, the latter of which being the more rapid process.
In the experimental study of Li et al.31 for example, cyclopentane molecules might have
32
words, the solid phase generated by the authors might actually constitute pure cyclopentane hydrate only which appears to be the most plausible explanation why they did not observe carbon dioxide in the hydrate structure. Therefore, experimental investigations on the formation of mixed gas + CP hydrates have to be carried out at a temperature above the temperature of pure
cyclopentane hydrate formation. At those temperatures, trapping of CO2 and N2 is observed
although the GSC is rather low.
Conclusions
An experimental method has been presented by which the phase equilibrium between a binary gas mixture, a solid hydrate phase, a liquid aqueous phase and a liquid CP-rich organic phase in
the quaternary system {H2O + CP + CO2 + N2} was investigated. By this method, a phase
diagram could be established in which the mole fraction of CO2 in the gas phase is plotted
against the mole fraction of CO2 in the hydrate phase, both defined with respect to total amount
of CO2 and N2 in the respective phase.
Measurements have been carried out to generate data on the hydrate equilibrium from a
CO2 + N2 gas mixture of fixed initial composition in presence of a thermodynamic promoter
(cyclopentane) dispersed as an emulsion. Three principal conclusions can be drawn. Firstly, the
selectivity of the hydrate based CO2 capture process using cyclopentane as a promoter is
improved in comparison to the corresponding hydrate process based on the system without promoter. Secondly, the equilibrium pressure is drastically reduced (a drop of pressure by 0.95 up to 0.97 is observed). Unfortunately, the gas storage capacity is lowered as well. Cyclopentane, which is a very good hydrate former, seems to stabilise the cavities in such a way that it prevents the complete occupation of the remaining cavities by gas molecules.
33
Acknowledgements
This work has been supported by the FUI-ACACIA (“Amélioration du Captage du CO2
Industriel et Anthropique”) project in the framework of the AXELERA cluster and the European
ICAP project (Innovative CO2 CAPture). The authors are particularly grateful to the members of
the technical staff at Ecole Nationale Supérieure des Mines des Saint-Etienne: Alain Lallemand, Fabien Chauvy, Marie Claude Bartholin and Jean Pierre Poyet.
References
(1) Sloan, D. E.; Koh, C. A. Clathrate Hydrates of Natural Gases, 3rd Revised edition. CRC Press Inc, 2007.
(2) Duc, N. H.; Chauvy, F.; Herri, J.-M. CO2 capture by hydrate crystallization - A potential
solution for gas emission of steelmaking industry. Energ. Convers. Manage. 2007, 48,
1313‑1322
(3) Arjmandi, M.; Chapoy, A.; Tohidi, B. Equilibrium Data of Hydrogen, Methane, Nitrogen, Carbon Dioxide, and Natural Gas in Semi-Clathrate Hydrates of Tetrabutyl Ammonium
Bromide. J. Chem. Eng. Data 2007, 52, 2153‑2158
(4) Oyama, H.; Shimada, W.; Ebinuma, T.; Kamata, Y.; Takeya, S.; Uchida, T.; Nagao, J.; Narita, H. Phase diagram, latent heat, and specific heat of TBAB semiclathrate hydrate crystals.
Fluid Phase Equilib. 2005, 234, 131‑135
(5) Lin, W.; Delahaye, A.; Fournaison, L. Phase equilibrium and dissociation enthalpy for
semi-clathrate hydrate of CO2 + TBAB. Fluid Phase Equilib. 2008, 264, 220‑227
(6) Deschamps, J.; Dalmazzone, D. Dissociation enthalpies and phase equilibrium for TBAB semi-clathrate hydrates of N2, CO2, N2 + CO2 and CH4 + CO2. J. Therm. Anal. Calorim. 2009,
98, 113‑118
(7) Sabil, K. M.; Witkamp, G.-J.; Peters, C. J. Phase equilibria in ternary (carbon dioxide + tetrahydrofuran + water) system in hydrate-forming region: effects of carbon dioxide concentration and the occurrence of pseudo-retrograde hydrate phenomenon. J. Chem.
Thermodyn. 2010, 42, 8-16
(8) Seo, Y.-T.; Kang, S.-P.; Lee, H. Experimental determination and thermodynamic modeling of methane and nitrogen hydrates in the presence of THF, propylene oxide, 1,4-dioxane and
34
(9) Delahaye, A.; Fournaison, L.; Marinhas, S.; Chatti, I.; Petitet, J. P.; Dalmazzone, D.; Fürst,
W. Effect of THF on equilibrium pressure and dissociation enthalpy of CO2 hydrates applied to
secondary refrigeration, Ind. eng. chem. res. 2006, 45, 391–397
(10) Kang, S. P.; Lee, H.; Lee, C. S.; Sung, W. M. Hydrate phase equilibria of the guest mixtures
containing CO2, N2 and tetrahydrofuran , Fluid Phase Equilib. 2001, 185, 101–109
(11) Linga, P.; Kumar, R.; Englezos, P. The clathrate hydrate process for post and pre-combustion capture of carbon dioxide, J.hazard. mater. 2007, 149, 625–629, 2007.
(12) Linga, P.; Kumar, R.; Lee, J. D.; Ripmeester, J.; Englezos, P. A new apparatus to enhance the rate of gas hydrate formation: Application to capture of carbon dioxide, Int. J. Greenh. Gas
Control 2010, 4, 630‑637.
(13) Kang, S.-P.; Lee, H. Recovery of CO2 from Flue Gas Using Gas Hydrate: Thermodynamic
Verification through Phase Equilibrium Measurements. Environ. Sci. Technol. 2000, 34,
4397‑4400
(14) Fan, S. S.; Liang, D.; Guo, K. Hydrate Equilibrium Conditions for Cyclopentane and a
Quaternary Cyclopentane-Rich Mixture. J. Chem. Eng. Data 2001, 46, 930‑932
(15) Zhang, J.; Lee, J.W. Equilibrium of Hydrogen + Cyclopentane and Carbon Dioxide +
Cyclopentane Binary Hydrates. J. Chem. Eng. Data 2009, 54, 659‑661
(16) Zhang, J.; Yedlapalli, P.; Lee, J. W. Thermodynamic analysis of hydrate-based
pre-combustion capture of CO2. Chem. Eng. Sci. 2009, 64, 4732‑4736.
(17) Zhang, J.; Lee, J.W. Enhanced Kinetics of CO2 Hydrate Formation under Static Conditions.
Ind. Eng. Chem. Res. 2009, 48, 5934‑5942.
(18) Mohammadi, A. H.; Richon, D. Phase equilibria of clathrate hydrates of methyl cyclopentane, methyl cyclohexane, cyclopentane or cyclohexane+carbon dioxide. Chem. Eng.
Sci. 2009, 64, 5319‑5322.
(19) Tohidi, B.; Danesh, A.; Todd, A.C.; Burgass, R. W.; Ostergaard, K. K. Equilibrium data and thermodynamic modelling of cyclopentane and neopentane hydrates. Fluid Phase Equilib. 1997,
138, 241‑250.
(20) Du, J.; Liang, D.; Li, D.; Li, X. Experimental Determination of the Equilibrium Conditions of Binary Gas Hydrates of Cyclopentane plus Oxygen, Cyclopentane plus Nitrogen, and
Cyclopentane plus Hydrogen. Ind. Eng. Chem. Res. 2010, 49, 11797‑11800.
(21) Mohammadi, A. H.; Richon, D. Phase equilibria of binary clathrate hydrates of nitrogen + cyclopentane/cyclohexane/methyl cyclohexane and ethane + cyclopentane/cyclohexane/methyl
cyclohexane. Chem. Eng. Sci. 2011, 66, 4936‑4940
(22) Li, S.; Fan, S.; Wang, J.; Lang, X.; Wang, Y. Clathrate Hydrate Capture of CO2 from Simulated Flue Gas with Cyclopentane/Water Emulsion. Chinese J. Chem. Eng. 2010, 18,
35
(23) Herri, J.-M.; Bouchemoua, A.; Kwaterski, M.; Fezoua, A.; Ouabbas, Y.; Cameirao, A. Gas
hydrate equilibria for CO2-N2 and CO2-CH4 gas mixtures - Experimental studies and
thermodynamic modelling. Fluid Phase Equilib.2011, 301, 171‑190.
(24) Thiam, A. L’étude des conditions thermodynamiques et cinétiques du procédé de captage du
CO2 par formation d’hydrates de gaz Application au mélange CO2-CH4, PhD Thesis, Ecole
Nationale Supérieure des Mines de St Etienne, 2008.
(25) Tohidi, B.; Burgass, R.W.; Danesh, A.; Ostergaard, K. K.; Todd, A. C.; Holder, G. D.; Bishnoi, P. R. Improving the accuracy of gas hydrate dissociation point measurements, in Gas
hydrates: Challenges for the future. New York Acad Sciences 2000, 912, 924‑931.
(26) Danesh, A.; Tohidi, B.; Burgass, R.; Todd, A. C. Hydrate Equilibrium Data of Methyl
Cyclo-Pentane with Methane or Nitrogen. Chem. Eng. Res. Des. 1994, 72, 197‑200.
(27) Mohr, P.J.; Taylor, B.N.; Newell, D.B. CODATA recommended values of the fundamental physical constants: 2010. J. Phys. Chem. Ref. Data 2012, 41.
(28) Holder, G. D.; Zetts, S. P.; Pradhan, N. Phase Behavior in Systems Containing Clathrate
Hydrates: A Review, Rev. Chem. Eng. 1988, 5, 1‑70.
(29) Galfré, A.; Fezoua, A.; Ouabbas, Y.; Cameirao, A.; Herri, J.M. Carbon dioxide hydrates crystallisation in emulsion. Proceedings of the 7th International Conference on Gas Hydrates
2011, Edimbourg, Royaume-Uni, 442.
(30) van der Waals, J.H; Platteeuw, J.C. Clathrate Solutions, Adv. Chem. Phys. 1959, 2, 1-57. (31) Li, X.-S.; Xu, C.-G.; Chen, Z.-Y.; Cai, J. Synergic effect of cyclopentane and tetra-n-butyl ammonium bromide on hydrate-based carbon dioxide separation from fuel gas mixture by measurements of gas uptake and X-ray diffraction patterns. Int. J. Hydrogen Energ. 2012, 37,
720‑727
(32) Herslund, P. J.; Thomsen, K.; Abildskov, J.; Solms, N. V.; Galfré, A.; Brântuas, P.; Kwaterski, M.; Herri, J.M. Thermodynamic promotion of carbon dioxide clathrate hydrate formation - An experimental study. Int. J. Greenh. Gas Con. 2013, DOI: JGGC-D-12-00511R1 (33) Scharlin, P. Carbon dioxide in water and aqueous electrolyte solutions, Oxford University Press, 1996.
(34) Diamond, L. W.; Akinfiev, N. N. Solubility of CO2 in water from −1.5 to 100 °C and from
0.1 to 100 MPa: evaluation of literature data and thermodynamic modelling. Fluid Phase Equilib.
2003, 208, 265‑290.
(35) O’Connell J.P.; Haile, J.M. Thermodynamics: Fundamentals for Applications. Cambridge, New York, Melbourne, Madrid, Cape Town, Singapore, São Paolo: Cambridge University Press, 2005.
(36) Soave, G. Equilibrium constants from a modified Redlich-Kwong equation of state, Chem.
36
(37) Bonnefoy, O. Influence de cristaux d’hydrates de gaz ou de glace sur la perméabilité d’un
milieu poreux. PhD Thesis, Ecole Nationale Supérieure des Mines de St Etienne, 2005.
(38) Vidal, J. Thermodynamics: Applications in Chemical Engineering and the Petroleum
Industry. Editions Technip, 2003.
(39) Assael, M.J.; Trusler, J.P.M.; Tsolakis, T.F. Thermophysical Properties of Fluids. Imperial college Press: London U. K., 1996.
37
AUTHOR INFORMATION
Corresponding Author
Jean Michel Herri, Ecole Nationale Supérieure des Mines de St Etienne, 158 cours Fauriel, 42023 St Etienne, FRANCE. phone: +00334 77420292 Fax : +0033 477499694
Aurélie Galfré, Ecole Nationale Supérieure des Mines de St Etienne, 158 cours Fauriel, 42023 St Etienne, FRANCE. phone: +00334 77429760 Fax : +0033 477499694
Authors emails
Aurélie Galfré, galfre@emse.fr
Ana Cameirao, cameirao@emse.fr
Matthias Kwaterski, kwaterski@emse.fr
Pedro Brântuas, brantuas@emse.fr
38
Table of Content Graphic
Figure 1. Schematic representation of the experimental setup.
Figure 2. Microscopic picture of the cyclopentane droplets constituting the CP in water emulsion (CP mass fraction of 0.0767).
Figure 3. CP droplets size distribution in a CP in water emulsion ( CP mass fraction of 0.0767).
Figure 4. Dissolving and crystallisation steps of the experimental procedure. Evolution of liquid temperature T and pressure p over time during the solubilisation step without crystallisation.
Figure 5. Dissolving and crystallisation steps of the experimental procedure. Evolution of liquid temperature T and pressure p over time when crystallisation occurs during the solubilisation step.
Figure 6. Dissolving and crystallisation steps of the experimental procedure. Evolution of the gas
phase mole fraction of CO2 over time.
Figure 7. Dissociation steps of the experimental procedure.
Figure 8. Experimental data and correlations of Henry’s constant of carbon dioxide in water and in cyclopentane as function of the inverse temperature T.
39
Figure 9. Equilibrium Mole fraction of CO2 in the hydrate phase as function of the corresponding
mole fraction of CO2 in the gas for different temperatures T between 282.5 K to 287.5 K, in
presence of cyclopentane. Comparison to simulations obtained by means of the in-house software “GasHyDyn” for the corresponding system without cyclopentane.
Figure 10. p-T-equilibrium dissociation data for CO2, N2 and CO2+N2 and systems with and
without cyclopentane. Experimental data from literature and from this work, and comparison to simulations obtained with the in-house programme “GasHyDyn” for carbon dioxide gas hydrates..
Figure 11. Gas hydrate equilibrium pressure p as function of the corresponding mole fraction of CO2 in the gas phase in the temperature range T from 282.8 K to 287.5 K. Experimental data and simulations from the in-house “GasHyDyn” software.
Figure 12. Gas storage capacity for CO2+N2 gas mixtures from 282.5 K to 287.5 K as function of
the mole fraction of CO2 in the gas
Figure 1 (supporting information). Calibration curve for the gas chromatographic measurements on the CO2/N2 gas.