HAL Id: hal-02534879
https://hal.archives-ouvertes.fr/hal-02534879
Submitted on 2 Oct 2020
HAL is a multi-disciplinary open access
archive for the deposit and dissemination of
sci-entific research documents, whether they are
pub-lished or not. The documents may come from
teaching and research institutions in France or
abroad, or from public or private research centers.
L’archive ouverte pluridisciplinaire HAL, est
destinée au dépôt et à la diffusion de documents
scientifiques de niveau recherche, publiés ou non,
émanant des établissements d’enseignement et de
recherche français ou étrangers, des laboratoires
publics ou privés.
SEI Composition on Hard Carbon in Na-Ion Batteries
After Long Cycling: Influence of Salts (NaPF 6 ,
NaTFSI) and Additives (FEC, DMCF)
J. Fondard, E. Irisarri, Cecile Courreges, M. Palacin, A. Ponrouch, R.
Dedryvere
To cite this version:
J. Fondard, E. Irisarri, Cecile Courreges, M. Palacin, A. Ponrouch, et al.. SEI Composition on Hard
Carbon in Na-Ion Batteries After Long Cycling: Influence of Salts (NaPF 6 , NaTFSI) and Additives
(FEC, DMCF). Journal of The Electrochemical Society, Electrochemical Society, 2020, Challenges in
Novel Electrolytes, Organic Materials, and Innovative Chemistries for Batteries in Honor of Michel
Armand, 167 (7), pp.070526. �10.1149/1945-7111/ab75fd�. �hal-02534879�
Journal of The Electrochemical
Society
OPEN ACCESS
SEI Composition on Hard Carbon in Na-Ion Batteries After Long Cycling:
Influence of Salts (NaPF
6
, NaTFSI) and Additives (FEC, DMCF)
To cite this article: J. Fondard et al 2020 J. Electrochem. Soc. 167 070526
View the article online for updates and enhancements.
SEI Composition on Hard Carbon in Na-Ion Batteries After Long
Cycling: In
fluence of Salts (NaPF
6, NaTFSI) and Additives (FEC,
DMCF)
J. Fondard,
1,=E. Irisarri,
2,=C. Courrèges,
1,3,4M. R. Palacin,
2,4,*
A. Ponrouch,
2,4,*
,zand
R. Dedryvère
1,3,4,z1
IPREM, CNRS, Université de Pau & Pays Adour, E2S-UPPA, Hélioparc, 64053 Pau Cedex 9, France
2Institut de Ciència de Materials de Barcelona (ICMAB-CSIC), Campus UAB, E-08193 Bellaterra, Catalonia, Spain 3
Réseau sur le Stockage Electrochimique de l’Energie (RS2E), CNRS FR 3459, France
4ALISTORE-ERI, European Research Institute
A study of the Solid Electrolyte Interphase (SEI) on hard-carbon (HC) electrodes in sodium half-cells is presented. Electrochemical performances over> 100 cycles were compared with two different salts (NaPF6, NaTFSI) and two different electrolyte additives
(FEC, DMCF) in a mixture of EC and DMC solvents. The best electrochemical performances were observed with NaPF6salt in
conjunction with 3% FEC. The DMCF additive had a detrimental effect in all electrolyte combinations. The chemical characterization of the SEI was carried out by X-ray Photoelectron Spectroscopy (XPS) and showed that the best electrochemical behavior was related to an SEI composition based on sodium ethylene dicarbonate and NaF, whereas poorer electrochemical performances were associated to either low NaF or high Na2CO3content. The results reported herein provide an insight on the SEI
chemistry on hard carbon electrodes in sodium cells after long-term cycling, as a complement to previous studies dealing with the first cycles.
© 2020 The Author(s). Published on behalf of The Electrochemical Society by IOP Publishing Limited. This is an open access article distributed under the terms of the Creative Commons Attribution Non-Commercial No Derivatives 4.0 License (CC BY-NC-ND,http://creativecommons.org/licenses/by-nc-nd/4.0/), which permits non-commercial reuse, distribution, and reproduction in any medium, provided the original work is not changed in any way and is properly cited. For permission for commercial reuse, please email:oa@electrochem.org. [DOI:10.1149/1945-7111/ab75fd]
Manuscript submitted December 31, 2019; revised manuscript received February 5, 2020. Published February 24, 2020.This paper is part of the JES Focus Issue on Challenges in Novel Electrolytes, Organic Materials, and Innovative Chemistries for Batteries in
Honor of Michel Armand.
Supplementary material for this article is availableonline
Sodium-ion batteries (SIBs) are re-attracting the interest of the scientific community in the last years due to speculations about potential supply risk for lithium related to expanding the field of applications for Lithium-ion batteries (LIBs) from portable electro-nics to transportation and electricity sectors.1Time will tell whether such risk is merely related to consumption-production temporary imbalance or else it may have long-term implications. Yet, diversi-fication of battery technologies seems a wise strategy to pursue considering that different applications have clearly different require-ments in terms of cost, performance and sustainability. Progress in SIBs is catalyzed by the chemical analogies between lithium and sodium,2,3and start-ups such as Faradion (UK) and Tiamat (France) are already producing cells, and available cost and resource analysis do offer interesting perspectives for the future.4–6 Moreover, no significant modification of the battery production line is expected when moving from Li-ion to Na-ion batteries. In the last years, research efforts were focused onfinding the best electrodes/electro-lyte combination. While on the negative side, Hard Carbon (HC) seems to be the only practically viable material at this stage,7both polyanionic and layered electrode materials are considered on the positive side.8 In line with the progress in LIBs, the role of the electrolyte has at a first sight been deemed less relevant. Yet, electrolyte formulation is crucial for practical performance.9Beyond intrinsic features, the quality and stability of the Solid Electrolyte Interphase (SEI) is crucial to cycle life, and also, indirectly, to the overall cell service life cost.10,11 The cathodic stability of an electrolyte depends on its Lowest Unoccupied Molecular Orbital (LUMO) level. If only thermodynamics is considered, the electrolyte component with the lowest LUMO level will be reduced first in contact with the HC electrode, possibly contributing to the formation of the SEI. Therefore, the electrolyte’s formulation dictates the SEI
composition and its properties such ionic conductivity, electronic resistance, stability, thickness, etc. Moreover, despite having been intensively studied,12,13full understanding of the SEI is still elusive in LIBs, as its nature is highly dependent on electrolyte composition (including additives) and can dynamically evolve depending on cell operation conditions, time and temperature.14
In the case of SIBs, the understanding is still in a more preliminary stage.15The most commonly used electrolytes consist of a solution of NaPF6(typically 1 mol l−1) in a mixture of alkyl
carbonate based solvents such as dimethyl carbonate (DMC), Diethyl carbonate (DEC), Ethyl carbonate (EC) or Propylene Carbonate (PC). Beyond the expected analogies between LIBs and SIBs as a result of this chemical analogy, some relevant differences (e.g. the solubility of SEI components11,16 or its mechanical properties17) that can be critical for performance were early realized. M. Armand and co-workers were pioneers in the systematic investigation of the effect of salt anions in the SEI formed on hard carbon upon first reduction using different mixtures of alkyl carbonates as solvents, which largely influences coulombic effi-ciency on thefirst cycle and hence the practical energy density of the full cell.18 They found that the main components of the SEI are double alkylcarbonates, with linear solvent molecules exhibiting higher reactivity towards hard carbon electrodes, and onset thermal stability for a given solvent being highly dependent, on the salt, in agreement with previousfindings.19
In parallel, Lucht et al.20studied the SEI on hard carbon after 25 cycles in 1 M NaPF6in EC/DEC at 18 mA h−1(equivalent to C/20
arbitrarily considering a theoretical capacity of 372 mAh g−1 corresponding to graphite in LIBs) and were able to conclude that it was mostly consisting of sodium ethylene dicarbonate (NEDC), derived from EC reduction, and NaF, similarly to what was found on LIBs. Again, some more subtle differences exist beyond this apparent similarity atfirst sight. Komaba et al.21were the first to test the effect in NIBs of conventional electrolyte additives used in LIBs and found that while difluoroethylene carbonate (DFEC) and vinylene carbonate (VC) did not improve cycle life for 1 M NaClO4
zE-mail:aponrouch@icmab.es;remi.dedryvere@univ-pau.fr =These authors contributed equally to this work.
in PC electrolyte, the presence offluoroethylene carbonate (FEC) was beneficial. Extension of the study to NaPF6based electrolytes
showed further improvement, which was attributed to some sort of synergistic effect,22,23with atomistic reaction simulations indicating the existence of an optimum value for FEC concentration in the electrolyte, beyond which it would have detrimental effects.24 In contrast, some detrimental effects of FEC were also reported, such as an increase in polarization in two-electrode cell associated with a more resistive SEI layer formed on the Na metal counter electrode.25,26
Since the origin of polarization cannot be clearly assessed in tests carried out in two electrode cells, in the present paper we decided to embark in a comparative study using EC:DMC based electrolytes (which typically exhibit low viscosity and hence good wettability of the separator) and two different salts: NaPF6and NaTFSI, the main
advantages of the latter being low toxicity, improved safety and higher stability in presence of trace water and the main concern being corrosion of aluminum in TFSI− anions containing liquid electrolytes.27We have also tested the effect of FEC as additive in two different concentrations, and we have carried out a comparative study with fluorinated dimethylcarbonate (DMCF) as alternative additive.
Specific efforts were done to probe the influence of the salt and additive nature on electrochemical performances and SEI composi-tion after long-term cycling. Cells were cycled in EC:DMC (1:1 vol.) mixture of solvents with NaPF6and NaTFSI salts, with 1.5–3 wt%
of FEC or DMCF additive. HC//Na half-cells were cycled from 0.003 V to 2 V for 135 cycles at 0.1 C and the evolution of the SEI composition was followed by X-ray Photoelectron Spectroscopy (XPS).
Experimental
Composite electrodes containing hard carbon (HC) as active material were prepared from N-Methylpyrrolidone based slurries. Their compositions were 92 wt% HC, 3 wt% carbon black (Super P
Timcal) and 5 wt% PVdF (polyvinylidenefluoride, with a loading of 2.5 mg HC cm−2. Commercial HC was used with surface area below 10 m2 g−1 as measured by means of Brunauer–Emmett–Teller (BET) using an ASAP 2000 Micromeritics Instrument. Electrochemical cycling of HC was performed in three-electrode Swagelok cells with sodium metal as reference and counter electrodes in order to avoid any significant potential shift of the reference electrode upon cycling.16 Cycling was carried out in galvanostatic mode with potential limitation (GCPL) at different rates using a Bio-Logic VMP3 potentiostat. Glass borosilicatefiber was used as separator soaked in 150 μl of electrolyte. The electrolytes consist of 1 M NaPF6or 1 M NaTFSI in a 1:1 mixture
of ethylene carbonate (EC) and dimethyl carbonate (DMC), with or without 1.5 or 3 wt% FEC or DMCF additives. The water content in all electrolytes was measured by Karl-fisher titration and found to be lower than 20 ppm in all cases.
The composition of the SEI was investigated by XPS on HC electrodes recovered from cells immediately after cycling. The cells were open inside an Ar-filled glove box, and each electrode was cut in two halves, one of which was soaked in three successive dimethyl carbonate (DMC) baths while the other one and the separator were kept without further treatment for comparison.
X-ray Photoelectron Spectroscopy (XPS) was carried out with a Thermo Scientific Escalab 250 Xi spectrometer using a focused monochromatized radiation at two different photon energies: Al Kα (hν = 1486.6 eV) and Ag Lα (hν = 2984.2 eV). The analyzed area of the samples was a 450× 900 μm2ellipse. Peaks were recorded with a constant pass energy of 20 eV. The binding energy scale was calibrated from the hydrocarbon contamination using the C 1s peak at 285.0 eV. For all analyses, thorough precautions were taken to preserve the samples surface from any contact with air and moisture. All samples were handled or stored in controlled dry argon atmo-sphere. The XPS transfer chamber was directly connected to the argon glovebox. No argon ion sputtering was used to etch the samples surface for depth-profiling, in order to avoid any ion beam-induced chemical changes leading to wrong conclusions. Instead, the
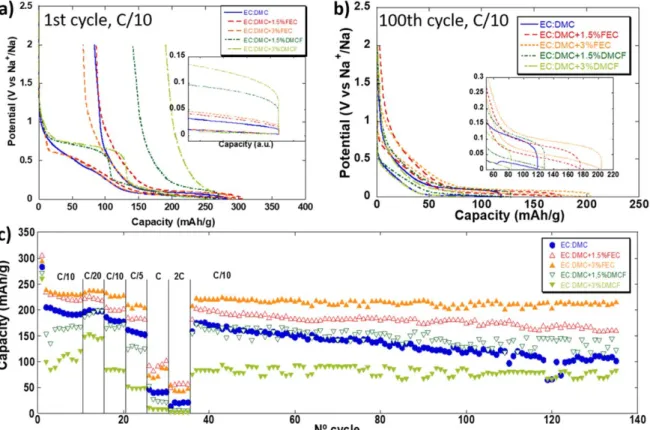
Figure 1. Potential vs capacity profile for the 1st and 100th cycle and capacity vs cycle number for HC electrodes cycled at different successive galvanostatic rates in three electrode cells using 1 M NaPF6in EC:DMC with addition of 1.5 and 3% of FEC or DMCF.
two photon energies were used to get access to two different probe depths. As it was mentioned in previous papers that the SEI layer components in Na-ion batteries may be more soluble in the electrolyte than in Li-ion batteries,11,16 we evaluated the effect of the washing process of the HC electrodes by DMC prior to surface characterization by XPS. The HC electrodes were washed by 3× 1 min immersion in pure anhydrous DMC baths to get rid of the electrolyte. DMC was then evaporated by leaving the electrode under vacuum (inside the glovebox antechamber) for at least 1 h. As no significant differences were observed related to the carbonaceous species present in the SEI, it was decided to show only the results obtained on washed samples. Nonetheless, a comparison between washed and unwashed electrodes can be drawn from the example of a HC electrode cycled using a NaTFSI-based electrolyte given as supplementary information (Fig. S1 is available online atstacks.iop. org/JES/167/070526/mmedia).
Results and Discussion
Electrochemical performances.—Capacity evolution upon cycle number for HC electrodes was monitored in three-electrode half cells cycled in galvanostatic mode with potential limitation (GCPL) with 0.003 V and 2 V as low and high cut off voltages, respectively, at different successive rates C/10, C/20, C/5, C, 2 C and further cycling at C/10 (considering 372 mAh g−1as theoretical capacity). Results obtained using NaPF6 based electrolyte with or without
additive (FEC or DMCF) are presented in Fig. 1. In additive-free electrolyte, the electrochemical profile for the first cycle exhibits two regions, an almost linear potential decay centered around 0.5 V vs Na+/Na and a pseudo plateau around 0.1 V Na+/Na. While the complete understanding of the redox/capacitive processes at play in this system is still lacking,28,29such GCPL curves are well known and typical for HC electrodes.
The presence of additive in the electrolyte significantly impacts the electrochemical curves. When DMCF is added, an additional reduction pseudo plateau can be seen at ca. 0.75 V vs Na+/Na. The
length of such plateau appears to be related to the amount of DMCF initially present in solution (Fig.1a). Indeed, the capacity associated with this plateau correspond to about 39 or 50% of the total capacity recorded upon thefirst reduction when 1.5 or 3% of DMCF is used, respectively. This pseudo plateau disappears upon further cycling (Fig.1b) evidencing the irreversibility of the redox process involved. Much lower first cycle coulombic efficiencies are recorded in presence of DMCF (ca. 70% in additive free electrolyte and 48% and 27% with 1.5% and 3% of DMCF, respectively). When FEC is added, the linear potential decay upon the first reduction partially disappeared and a reduction pseudoplateau can be seen at ca. 0.55 V vs Na+/Na. As for DMCF, such pseudo plateau is no longer visible after thefirst cycle (Fig.1b). By contrast with DMCF, the addition of FEC resulted in a slight improvement of thefirst cycle coulombic efficiency. Indeed, 70% first cycle coulombic efficiency was recorded in additive free electrolyte and 72% and 77% with 1.5 and 3% of FEC, respectively. In terms of overall capacity of the HC electrode (Fig.1c) the addition of DMCF and FEC have radically different impact. While the presence of DMCF is detrimental (with about 200, 150 and 100 mAh g−1recorded in electrolyte with 0%, 1.5% or 3% DMCF, respectively) the addition of FEC improves the reversible capacity as well as the capacity retention upon cycling. Indeed, capacities of about 200, 220 and 230 mAh g−1 were recorded in electrolyte with 0%, 1.5% or 3% FEC, respectively (at C/10 and for cycle number 10) and 65%, 72% and 94% capacity retention was measured after 130 cycles with 0%, 1.5% or 3% FEC, respectively. The difference in the reversible capacity recorded with and without FEC or DMCF can be rationalized by comparing the overpotential between charge and discharge (see onsets in Figs.1a and 1b). Indeed, during the first cycle, this overpotential is the highest (> 60 mV) when DMCF is present in the electrolyte resulting in partial loss of capacity associated with the low voltage pseudo plateau.30 Upon cycling, the overpotential in additive free electrolyte significantly increase from less than 20 mV during the first cycle up to about 60 mV after 100 cycles resulting in low
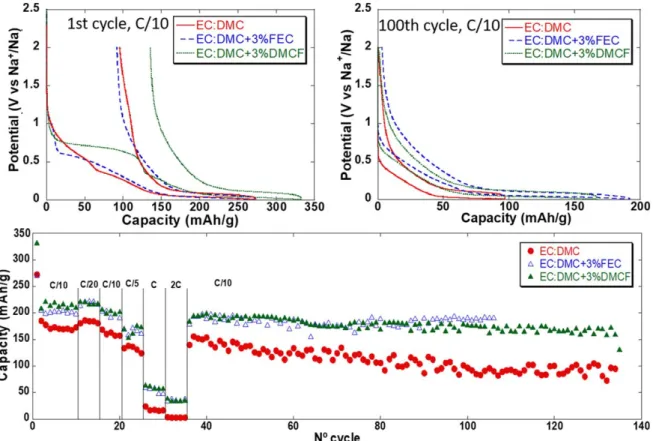
Figure 2.Potential vs capacity profile for the 1st and 100th cycle and capacity vs cycle number for HC electrodes (Tape 1) cycled at different successive galvanostatic rates in three electrode cells using 1 M NaTFSI in EC:DMC with addition of 3% of FEC or DMCF.
capacity retention. The overpotential was however found to remain stable both with FEC or DMCF additives, resulting in better capacity retention upon cycling. In all cases, coulombic efficiency values of about 99% are recorded after a conditioning period of 10 to 20 cycles.
Moving to NaTFSI based electrolytes (Fig. 2), the trends explained above for NaPF6based electrolytes only partially hold.
For instance, addition of DMCF or FEC also lead to the appearance during thefirst reduction of an irreversible pseudo plateau at ca. 0.75 or 0.55 V vs Na+/Na, respectively. Lower first cycle coulombic efficiencies were measured with DMCF containing electrolytes than with or without FEC. However, in NaTFSI based electrolytes the addition of FEC or DMCF was found to be beneficial in terms of overall capacity and capacity retention upon cycling (Fig.2c). This is in stark contrast with the NaPF6 based system in which the
addition of DMCF was clearly detrimental to the overall capacity recorded.
Chemical characterization of the SEI.— Cycling with NaPF6
salt and FEC additive.—Figure3shows C 1s and F 1s XPS spectra of HC electrodes after 135 cycles in half-cells with NaPF6/EC:DMC
electrolyte, without and with 3% FEC. Figures depicting other spectra (O 1s, P 2p and Na 2s) and the quantification of all peaks are given in the SI (Fig. S2 and Table SI). The four C 1s peaks observed in Fig. 3a (hν = 1486.6 eV) are characteristic of different carbon environments corresponding to species present in the SEI: (i) 285.0 eV for C atoms bound to only H or other C atoms, corresponding to aliphatic chains and also hydrocarbon surface contamination, as usually observed in XPS spectra, (ii) 286.5–286.7 eV for C atoms bound to one oxygen (yellow component), (iii) 288.3–288.4 eV for O–C=O environments (blue), and finally (iv) 290 eV for carbonate (CO3) environments (green). By comparing C 1s spectra obtained
without additive and with 3% FEC, it appears that the relative intensity ratios of these components do not significantly change, except for the C–C/C–H component. C 1s spectra with a higher photon energy (hν = 2984.2 eV, Fig.3b) were also recorded in order to increase the probe depth and thus get more information on the volumetric distribution of species in the SEI. The probe depth, defined as three times the photoelectron inelastic mean free path, can be calculated as a function of the photon energy hν using, for instance, TPP-2M model from Tanuma et al.31For both reference compounds Na2CO3and NaF which are frequently found as major
constituents in the SEI, the probe depth is about 8–9 nm for hν = 1486.6 eV and about 16–17 nm for hν = 2984.2 eV, i.e. twice greater. Therefore, these values can be taken as an approximation of
the XPS probe depth for the SEI at these two photon energies. For hν = 2984.2 eV in Fig.3b no significant differences can be observed in C–O, COO and CO3 relative contributions as compared to hν =
1486.6 eV photon energy. Therefore, the SEI composition in these carbon environments can be considered as homogeneous in depth, at least over thefirst 16–17 nm. The COO environments are certainly related to species coming from the degradation of solvents (EC and DMC) through breaking one C–O bond of the carbonate group, such as R–COONa, as this kind of mechanism was already proposed for Li-ion batteries using the same solvents.32The intensity of the C–C/ C–H component decreases weakly, indicating that the contribution of hydrocarbon surface contamination to this peak is very small. This is especially true for 3% FEC, for which minor differences are observed for the two photon energies. Thesefindings are consistent with aliphatic chains being present in the SEI, for example in the form of polyolefins, as also suggested for Li-ion batteries with the same kind of solvents.33 Moreover, the addition of FEC to the electrolyte increases the proportion of aliphatic chains (from 13 to 24 at%). Note that the increase of excitation energy does not lead to enhancement of the very weak component at BE ≈ 283 eV. Therefore, this component should not be attributed to HC active material, but should rather be interpreted as a small asymmetry of the peak on the low binding energy (BE) side.
Differences can also be noticed in the F 1s spectra (Fig. 3c). These display the signature of the salt NaPF6 remaining at the
electrode surface (green component, BE ≈ 687 eV) and of NaF ensuing from its degradation (red component, BE ≈ 684 eV). Intensity differences allow to infer that the amount of NaF is about 10 times greater after cycling with 3% FEC than without additive (5.5 at% instead of 0.5 at%).
XPS valence spectra (Fig.4) can be used as afingerprint of the major compounds present at the surface, unless there is a large number of species present in similar amounts, otherwise data interpretation is too complex. In the left part of Fig.4, the valence spectra of the samples without and with 3% FEC (a and b, respectively) have been compared with those of the reference compounds Na2CO3 and NaF (c and d, respectively). The spectra
of the two HC samples present some similarities with the spectrum of Na2CO3, namely peaks A, C, D, G and H. However, peaks E and
F in the 13–20 eV BE region do not seem to be related to Na2CO3,
and comparison with lithium counterparts may be useful to ascertain its origin. The XPS valence spectra of Li2CO3 and lithium alkyl
carbonates ROCO2Li have similar shapes, 34
as shown in the right part of Fig.4. Peaks A, C and D are almost identical, with only and the two main following differences: (i) in Li2CO3 (e), the narrow
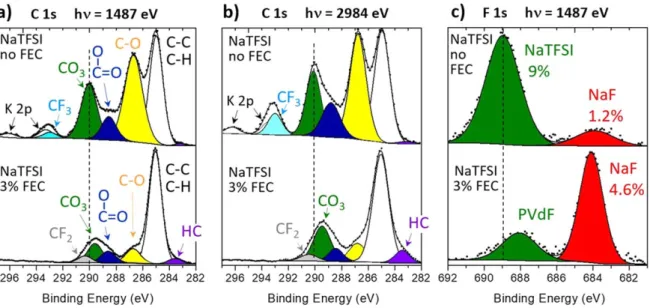
Figure 3. (a), (b) C 1s and (c) F 1s XPS spectra of HC electrodes after 135 cycles in half-cells with NaPF6/EC:DMC electrolyte, without and with 3% FEC. For
C 1s spectra two different photon energies have been used (1487 and 2984 eV, corresponding to different probe depths).
peak G is the maximum of the spectrum, while for lithium alkyl carbonates ROCO2Li (f and g), it is reduced to a shoulder on the
lower BE side of peak H, and (ii) in ROCO2Li, additional
components are observed in the 13–20 eV BE region, their number being equal to the number of C atoms in the alkyl group R. It was also shown, with the help of ab initio calculations, that the contribution of lithium to the valence spectrum is negligible due to the electronic configuration ns0 of alkaline cations. Therefore, the shape of these spectra seems only governed by the carbon and oxygen backbone of the molecule. This is in perfect agreement with the similarity between the spectra of Na2CO3 and Li2CO3, as
observed in Figs. 4c and4e, the main difference between the two spectra being a slight shift of Na2CO3towards lower BE values, due
to the higher electropositive character of Na compared to Li. As a result, since we could not record the experimental valence spectra of the reference compounds ROCO2Na (their synthesis is indeed rather
delicate and they are quite difficult to isolate), we assume we can use the valence spectra of their lithium counterparts ROCO2Li in this
study, taking into account the slight shift towards lower BE values due to Na, since those two alkaline cations bring no peaks in the valence spectrum in the 0–27 eV region. Those results in mind, the valence spectra of the HC electrodes obtained after cycling without and with 3% FEC (Figs.4a and4b, respectively) can be interpreted as follows: (i) First, peak G is only a shoulder on the lower BE side of peak H, which shows that the main carbonaceous species at the surface of the electrodes is ROCO2Na and not Na2CO3. This
conclusion is in good agreement with their C 1s spectra in Figs.3a and3b. Indeed, for Na2CO3only one CO3 component is
expected, while for ROCO2Na the CO3component is accompanied
by a C–O component of equal intensity due to R–O group.34 Actually, due to other minor organic species also present in the SEI, like RONa or poly(ethylene oxide), resulting from solvent degradation at the surface of the HC electrodes, the C–O component is greater than the CO3 component in the C 1s spectra of the HC
electrodes. (ii) Secondly, peaks E and F show that a sodium alkyl carbonate ROCO2Na with a R group containing two carbon atoms is
the major product. Since lithium ethyl carbonate C2H5OCO2Li
(LEC) and lithium ethylene dicarbonate LiO2CO-C2H4-OCO2Li
(LEDC) have similar valence spectra,34 and LEDC is usually reported as the main degradation product of EC entering the composition of the SEI in lithium batteries, it can reasonably be assumed that the shape of valence spectra of our HC electrodes can be interpreted by the presence of sodium ethylene dicarbonate NaO2CO-C2H4-OCO2Na (NEDC) as the major carbonaceous
spe-cies of the SEI, resulting from EC decomposition, with or without FEC. This is also in good agreement with previous papers dealing with SEI formation mechanisms related to DMC and EC solvents in sodium cells.20,35Finally, a small difference on the valence spectra is observed between the samples cycled without and with 3% FEC, namely the shoulder B at about 8 eV, which is due to NaF. This is in perfect agreement with the previous analysis of F 1s spectra in Fig. 3c showing that the amount of NaF increased 10 times with addition of FEC. The amount of NEDC can be estimated from the intensity of the CO3component in C 1s spectra and is found to be
about 45 at% without FEC and about 30 at% with 3% FEC, the decrease being mainly due to the increase of aliphatic chains and NaF. While it may have been expected that decomposition mechanism of FEC would lead to the presence additional organic compounds in the SEI, such as polycarbonates or more Na2CO3, this
is not observed here, in good agreement with the study Dahbi et al. over thefirst cycle.22In our case, we observe an increase of the NaF content, but their study was done over thefirst cycle only, while our study is carried out after long-term cycling. Certainly, the chemical composition of the SEI is not the only reason why the electro-chemical behaviour of HC electrodes is better with FEC, but also its thickness and porosity may play a role. While these cannot be probed by XPS, the thickness seems to be in both cases (with and
Figure 4. XPS valence spectra (hν = 1487 eV) of HC electrodes after 135 cycles in half-cells with NaPF6/EC:DMC electrolyte: (a) without FEC, (b) with 3%
FEC. Comparison with valence spectra of reference compounds recorded in the lab: (c) Na2CO3, (d) NaF, (e) Li2CO3, (f) CH3OCO2Li, (g) CH3CH2OCO2Li.
without FEC) larger than 16–17 nm, which is the estimated probe depth for the higher photon energy used in this work.
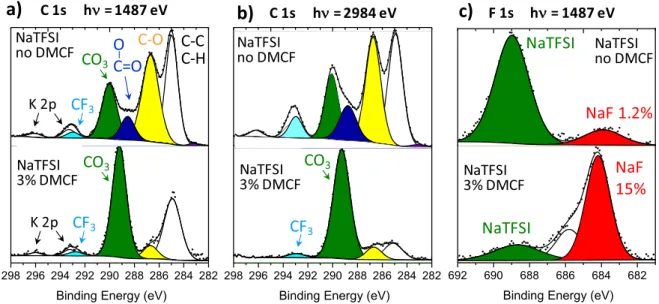
Cycling with NaTFSI salt and FEC additive.—Figure 5 repre-sents C 1s and F 1s XPS spectra of HC electrodes after 135 cycles in half-cells with NaTFSI/EC:DMC electrolyte, without and with 3% FEC, in the same conditions as previous samples cycled with NaPF6
salt. Figures depicting other spectra (O 1s, S 2p, Na 2s and N 1s) and the quantification of all peaks are provided in the SI (Fig. S3 and Table SII). When cycling without FEC (upper part of Fig. 5a), results are comparable to those achieved for electrodes cycled with NaPF6: the C 1s spectrum is very similar, except for the presence of
an additional CF3component at 293 eV (light blue) due to TFSI−
anions. Note that the K 2p3/2–1/2signal of potassium (0.4 at% of the surface) is also present on the same spectrum, due to an impurity contained in the salt. Analogous results are achieved for a twice greater probe depth (hν = 2984.2 eV, upper part of Fig.5b). The relative contributions of C–O, COO and CO3components are not
changed as compared to hν = 1486.6 eV photon energy, which indicates that the SEI composition in carbonaceous species is homogeneous over thefirst 16–17 nm layer. Note that the contribu-tion of NaTFSI salt increases, showing that the remaining salt is not only located at the outermost surface, but also present in deeper layers. As a result, the potassium impurity also increases slightly. As deduced from the F 1s spectrum of the same sample (upper part of Fig.5c), NaF seems to be present in the SEI (measured amount= 1.2 at%) resulting from salt decomposition. Besides, NaTFSI represents 9 at% of the surface composition of the electrode.
The addition of FEC to NaTFSI based electrolytes induces relevant differences in the spectra of the HC electrodes recovered after cycling, as shown in the bottom part of Fig.5a. The relative contributions of C–O, COO and CO3components in C 1s spectrum
are significantly modified. The intensity of the CO3 component is
now greater than the contribution of C–O, indicating that Na2CO3is
present at the surface, which is also confirmed by the lower BE of the CO3component (289.5 eV instead of 290.0 eV). Indeed, due to
the strong electropositive character of Na, and because the CO3
group is surrounded by more sodium ions in Na2CO3 than in
ROCO2Na, the CO3component is shifted to lower BE values. The
presence of Na2CO3is consistent with the analysis of the valence
spectra of this sample (see below). For the C–C/C–H components, the same trends are observed for electrodes cycled with NaTFSI as those mentioned above for NaPF6. Aliphatic chains are present in the
SEI, and their amount increases (from 13 to 25 at%) after addition of
3% FEC. The peak at low BE in Fig. 5a (purple, 283.5 eV) is attributed to the HC active material surface. This attribution is confirmed by using the higher photon energy 2984.2 eV (leading to a twice greater probe depth, Fig.5b). Indeed, at this photon energy the C 1s signal of the HC is multiplied by two, which means that the thickness of the SEI is about the same order of magnitude as the probe depth obtained at 1486.6 eV, i.e. 8–9 nm. In the case of
Figure 5. (a), (b) C 1s and (c) F 1s XPS spectra of HC electrodes after long cycling in half-cells with NaTFSI/EC:DMC electrolyte, without and with 3% FEC (135 cycles without FEC and 106 cycles with FEC). For C 1s spectra two different photon energies have been used (1487 and 2984 eV, corresponding to two different probe depths).
Figure 6.XPS valence spectra (hν = 1487 eV) of HC electrode after 135 cycles in half-cells with NaTFSI/EC:DMC electrolyte: (a) without FEC, (b) with 3% FEC, compared with valence spectra of: (c) Na2CO3, (d) NaF.
electrodes cycled in NaTFSI based electrolytes, the presence of FEC leads therefore to a decrease of the SEI thickness. As a result, the CF2 signal of the polymer binder PVdF can be simultaneously
detected in the C 1s spectrum (grey component at 290.5 eV, with the CH2component of PVdF being included in the yellow component
labelled C–O), and also in the F 1s spectrum in Fig. 5c (green component at 688 eV). Moreover, the presence of FEC also results in a significant increase of the NaF amount (4.6 at%).
The XPS valence spectra, for samples cycled with and without FEC are depicted in Fig.6and compared with spectra of Na2CO3
and NaF as reference compounds. The valence spectrum of the HC electrode cycled with 3% FEC (Fig.6b) is consistent with a simple superposition of the spectra of Na2CO3 and NaF (6c and 6d),
confirming that the SEI composition is dominated by these two species. The valence spectrum of the sample cycled without FEC (Fig.6a) is very different, the inversion of intensity between peaks G and H revealing the presence of a sodium alkyl carbonate. Unfortunately, the presence of potassium precludes further analysis of 13–20 eV BE, which would otherwise have been relevant,34for the attribution of the ROCO2Na nature. Since peak E can still be
recognized and except for the presence of K 3p peak, the spectrum is very similar to its NaPF6counterpart (Fig.4a) and considering that C
1s spectra of HC electrodes cycled without additive are very similar for NaPF6and NaTFSI, it can be reasonably assumed that the main
carbonaceous compound formed in the SEI with NaTFSI without FEC is also NaO2CO-C2H4-OCO2Na (NEDC). Again, it is possible
to estimate the amount of NEDC from the intensity of the CO3
component in C 1s spectrum of Fig.5a: about 45 at% without FEC. As a conclusion, the chemical composition of the organic part of the SEI is not significantly different between NaTFSI and NaPF6based
electrolytes when no additive is used but the addition of FEC has a significant influence on it leading to an SEI mainly composed of Na2CO3and NaF. The quantitative analysis of core peaks leads to 33
at% of Na2CO3and 4.6 at% of NaF, values in good agreement with
Carboni et al.36who observed Na2CO3and NaF as major products
deposited at the surface of HC electrodes over 20 cycles when using NaTFSI in PC as electrolyte with FEC additive.
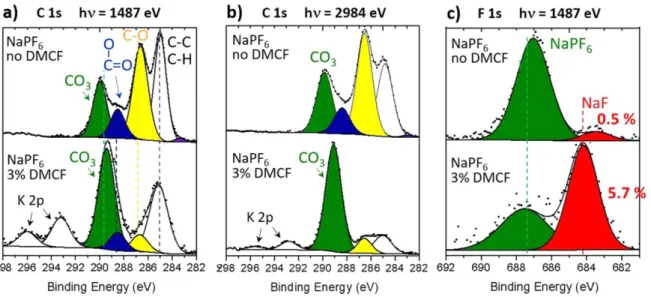
Cycling with NaPF6or NaTFSI salt and DMCF additive.—C 1s
and F 1s spectra of HC electrodes after 135 cycles with NaPF6/EC:DMC electrolyte, without and with 3% DMCF additive,
are plotted in Fig.7. Figures depicting other spectra (O 1s, P 2p and Na 2s) are given in the SI (Fig. S4). The C 1s spectrum without additive in the upper part of Fig.7a was already presented in Fig.3a. When using 3% DMCF (bottom part of Fig. 7a), the chemical
composition in carbonaceous species changes significantly with the C 1s spectrum being dominated by a strong CO3component. Taking
into account the shift towards lower BE of this component compared to the spectrum without additive, and the very low intensity of the C–O component, this is a clear proof for the presence of a larger amount of Na2CO3at the surface. Quantitative analysis from all XPS
core peaks revealed indeed the SEI was composed of 75 at% of Na2CO3and 5.7 at% of NaF. Contrary to HC electrodes cycled with
FEC, the intensity of the C–C, C–H peak is rather low and drops dramatically when the probe depth is increased, indicating that this peak is mainly due to hydrocarbon contamination and not to aliphatic chains. Therefore, the addition of DMCF seems to also lead to a decrease of polyolefin-like species. The analysis of valence spectra, although disturbed by the presence of a potassium impurity of unknown origin (see supplementary information in Fig. S5) confirmed the predominance of Na2CO3in the SEI. Increasing the
probe depth (hν = 2984.2 eV, Fig. 7b) resulted in an important decrease of the K 2p intensity, which is consistent with the location of the potassium impurity at the outermost surface of the sample.
Results corresponding to an analogous study carried out with NaTFSI is presented in Fig.8, with conclusions being very similar. Indeed, the composition of the SEI changed dramatically with addition of DMCF, with the formation of a larger amount of Na2CO3 inferred by an intense CO3 component correlated to a
weak C–O component (Fig.8a). This is consistent with the valence spectrum, which was only poorly disturbed by a weak amount of potassium (see supplementary information, Fig. S5). The F 1s spectrum revealed the presence of a large amount of NaF. Finally, quantitative analysis allowed to determine the composition of the SEI as 66 at% of Na2CO3 and 15 at% of NaF. Figures depicting
other spectra (O 1s, S 2p, Na 2s and N 1s) are given in the SI (Fig. S6).
As a conclusion, for both salts, the presence of DMCF leads to a massive production of Na2CO3with the formation of a rather thick
SEI (no trace of HC active material can be detected at hν = 2984.2 eV).
Discussion.—Overall, the best electrochemical performances achieved in this study were obtained using NaPF6 as a salt and
FEC (3wt%) as an additive. For such electrolyte formulation the SEI was found to contain mostly NEDC and NaF, from which NEDC is most likely the principal Na+conducting species. However, NEDC rich passivation layer obtained in NaTFSI or NaPF6 in EC:DMC
electrolytes without additive presented poor capacity retention upon cycling. While NaF is not expected to play a significant role in Na+
Figure 7. (a), (b) C 1s and (c) F 1s XPS spectra of HC electrodes after 135 cycles in half-cells with NaPF6/EC:DMC electrolyte, without and with 3% DMCF.
migration through the SEI since it is even less conducting than its Li analog, LiF,37 a significant improvement in terms of capacity retention was observed in NaPF6potentially related to the increase
in the amount of NaF in the SEI through the addition of FEC (respectively, 0.5 and 5.5% of NaF, without and with FEC). Indeed, and in the conditions evaluated in this work, NaF content in the SEI > 4% appeared to be the common denominator for high capacity retention tests (all tests performed with DMCF and FEC). While the role of NaF remains unclear and other parameters such as porosity, thickness and homogeneity of the SEI should be carefully investi-gated, it is interesting to note that the presence of a presumably “bad” SEI component such as NaF can play a beneficial role in the electrochemical performances of hard carbon electrodes. We tenta-tively rationalized these results by considering that the SEI must play one major role aside from being electronically insulating and ionically conducting, which is to be stable (or insoluble). As mentioned before this is not obvious in Na cells as most Na salts tend to be more soluble than their Li analogs.16Such potential SEI solubility issue can play an important role in interfacial processes since a partially dissolved SEI will result in continuous electrolyte decomposition and capacity fading. Hence, the presence of a rather insoluble species such as NaF can play an important role in stabilizing the SEI and in limiting solubility issues related to other compounds (such as NEDC here). Interestingly, recent studies on Li-ion counterparts have shown that the presence of LiF has also a positive impact on the electrochemical performances, the key point being to understand how LiF is distributed in the SEI,38and hence a
similar effect can be expected for Na-ion batteries. While, the beneficial role of NaF on capacity retention is evidenced in this work, the determination of the optimal SEI composition leading to high overall capacity is not trivial. For instance, samples with similar amount of NaF present significant difference in capacities (such as NaPF6+ 3% FEC or +3% DMCF, both with 5.5%–5.7% of NaF).
Other parameter affecting the capacity should thus be considered. Another aspect which has been suggested to be beneficial for Li-ion cells is the composite nature of the passivation layer, as the presence of multiple grain boundaries may promote space charge accumula-tion and boost ionic conducaccumula-tion.39 While this phenomenon could lead to lower polarization and thus higher capacity, it is expected that the way SEI components are mixed together will play an important role.
Conclusions
The influence of two salts (NaPF6, NaTFSI) and two additives
(FEC, DMCF) on the electrochemical behavior of HC//Na half-cells over long-term cycling (135 cycles) is reported, performance being better with NaPF6than with NaTFSI. With NaPF6, the use of 3%
FEC improves significantly the overall capacity as well as capacity retention, whereas the use of DMCF additive has a detrimental effect on capacity but resulted in better cyclability than with additive free electrolyte. With NaTFSI, both additives have a beneficial effect, although the electrochemical behavior is not as good as with NaPF6
salt. Chemical characterization of the HC electrode’s surface by XPS has shown that the SEI composition is mainly composed of sodium ethylene dicarbonate NaO2CO-C2H4-OCO2Na (NEDC) and NaF for
the best electrochemical performances (with NaPF6 and 3%FEC)
over 135 cycles. The use of FEC together with NaTFSI, or DMCF with both salts, leads to an SEI mainly composed of Na2CO3and
NaF, with poorer electrochemical performances. This suggests that the presence of NEDC has a beneficial role in physical/chemical properties of the SEI. For NEDC rich SEI the presence of NaF (enhanced when using FEC as additive) was found to significantly improve the capacity retention upon cycling. This was tentatively ascribed to a beneficial role of the NaF in limiting the solubility of NEDC or to an improved Na+ conduction though the SEI due to space charge accumulation. Unfortunately, no direct conclusions could be made on the parameters affecting the overall capacity and future work should also consider parameters such as the SEI morphology or thickness. This study gives a complementary view of the SEI chemistry of Na-ion batteries after long-term cycling, as a complement to previous studies dealing with thefirst cycles. A SEI engineering strategy based in the incorporation of highly insoluble species may be useful to mitigate solubility issues and improve cycle life.
Acknowledgments
Authors acknowledge the European Commission for funding through H2020 NAIADES project (LCE10–2014, grant nb. 646433). EI, MRP and AP acknowledge Ministerio de Economía y Competititivad (Spain) for Severo Ochoa Programme for Centres of Excellence in R&D (SEV-2015-0496). This work has been done in the frame of the Doctoral Degree Program in Chemistry by the Universitat Autònoma de Barcelona. JF, CC and RD acknowledge Agence Nationale de la Recherche (ANR) for its“Investment for the Future” Program through I-SITE E2S-UPPA funding.
Figure 8. (a), (b) C 1s and (c) F 1s XPS spectra of HC electrodes after 135 cycles in half-cells with NaTFSI/EC:DMC electrolyte, without and with 3% FDMC. For C 1s spectra two different photon energies have been used (1487 and 2984 eV, corresponding to different probe depths).
ORCID
M. R. Palacin https://orcid.org/0000-0001-7351-2005
A. Ponrouch https://orcid.org/0000-0002-8232-6324
References
1. E. A. Olivetti, G. Ceder, G. G. Gaustad, and X. Fu,“Lithium-ion battery supply chain considerations: analysis of potential bottlenecks in critical metals.”Joule, 1, 229 (2017).
2. N. Yabuuchi, K. Kubota, M. Dahbi, and S. Komaba,“Research development on Sodium-Ion batteries.”Chem. Rev., 114, 11636 (2014).
3. P. Johansson, P. Rozier, and M. R. Palacín,“Na-ion batteries.” in Prospects for Li-ion Batteries and Emerging Energy Electrochemical Systems, ed. L. Croguennec and L. Monconduit (World Scientific Europe, Singapore)161 (2018), Series on Chemistry, Energy and the Environment, Book 4, Chap. 4, p..
4. E. J. Berg, C. Villevieille, D. Streich, S. Trabesinger, and P. Novák,“Rechargeable batteries: grasping for the limits of chemistry.”J. Electrochem. Soc., 162, A2468 (2015).
5. C. Vaalma, D. Buchholz, M. Weil, and S. Passerini,“A cost and resource analysis of Sodium-Ion batteries.”Nature Reviews Materials, 3, 18013 (2018).
6. J. Peters, D. Buchholz, S. Passerini, and M. Weil, “Life cycle assessment of Sodium-Ion batteries.”Energy Environ. Sci., 9, 1744 (2016).
7. E. Irisarri, A. Ponrouch, and M. R. Palacin, “Review - hard carbon negative electrode materials for Sodium-Ion batteries.”J. Electrochem. Soc., 162, A2476 (2015).
8. R. Dugas, B. Zhang, P. Rozier, and J. M. Tarascon,“Optimization of Na-Ion battery systems based on polyanionic or layered positive electrodes and carbon anodes.”
J. Electrochem. Soc., 163, A867 (2016).
9. A. Ponrouch, D. Monti, A. Boschin, B. Steen, P. Johansson, and M. R. Palacín, “Non-aqueous electrolytes for Sodium-Ion batteries.”J. Mater. Chem. A, 3, 22 (2015).
10. E. Peled,“The electrochemical behavior of Alkali and Alkaline earth metals in nonaqueous battery systems - the solid electrolyte interphase model.”
J. Electrochem. Soc., 126, 2047 (1979).
11. R. Mogensen, D. Brandell, and R. Younesi,“Solubility of the solid electrolyte interphase (SEI) in sodium ion batteries.”ACS Energy Lett., 1, 1173 (2016). 12. K. Xu,“Nonaqueous liquid electrolytes for lithium-based rechargeable batteries.”
Chem. Rev., 104, 4303 (2004).
13. K. Xu,“Electrolytes and Interphases in Li-Ion batteries and beyond.”Chem. Rev., 114, 11503 (2014).
14. S. K. Heiskanen, J. Kim, and B. L. Lucht,“Generation and evolution of the solid electrolyte interphase of Lithium-Ion batteries.”Joule, 3, 2322 (2019). 15. J. Song, B. Xiao, Y. Lin, K. Xu, and X. Li,“Interphases in Sodium-Ion batteries.”
Adv. Energy Mater., 8, 1703082 (2018).
16. D. I. Iermakova, R. Dugas, M. R. Palacin, and A. Ponrouch,“On the comparative stability of Li and Na metal anode interfaces in conventional Alkyl carbonate electrolytes.”J. Electrochem. Soc., 162, A7060 (2015).
17. L. Schafzahl, H. Ehmann, M. Kriechbaum, J. Sattelkow, T. Ganner, H. Plank, M. Wilkening, and A. Freunberger,“Long-chain Li and Na Alkyl carbonates as solid electrolyte interphase components: structure, ion transport, and mechanical properties.”Chem. Mater., 30, 3338 (2018).
18. G. G. Eshetu, S. Grugeon, H. Kim, S. Jeong, L. Wu, G. Gachot, S. Laruelle, M. Armand, and S. Passerini, “Comprehensive insights into the reactivity of electrolytes based on sodium ions.”ChemSusChem, 9, 462 (2016).
19. A. Ponrouch, R. Dedryvère, D. Monti, J. M. Ateba Mba, L. Croguennec, C. Masquelier, P. Johansson, and M. R. Palacín,“Towards high energy density sodium ion batteries through electrolyte optimization.”Energy Environ. Sci., 6, 2361 (2013).
20. Y. Pan, Y. Zhang, B. S. Parimalam, C. C. Nguyen, G. Wang, and B. L. Lucht, “Investigation of the solid electrolyte interphase on hard carbon electrode for sodium ion batteries.”J. Electroanalytical Chem., 799, 181 (2017).
21. S. Komaba, T. Ishikawam, N. Yabuuchi, W. Murata, A. Ito, and Y. Ohsawa, “Fluorinated ethylene carbonate as electrolyte additive for rechargeable Na batteries.”ACS Appl. Mater. Interfaces, 3, 4165 (2011).
22. M. Dahbi, T. Nakano, N. Yabuuchi, S. Fujimura, K. Chihara, K. Kubota, J. Y. Son, Y. T. Cui, H. Oji, and S. Komaba, “Effect of Hexafluorophosphate and Fluoroethylene carbonate on electrochemical performance and the surface layer of hard carbon for Sodium-Ion batteries.”ChemElectroChem, 3, 1856 (2016). 23. E. de la Llave, V. Borgel, E. Zinigrad, F. F. Chesneau, P. Hartmann, Y. K. Sun, and
D. Aurbach,“Study of the most relevant aspects related to hard carbons as anode materials for Na-ion batteries, compared with Li-ion systems.”Isr. J. Chem., 55, 1260 (2015).
24. A. Bouibes, N. Takenaka, T. Fujie, K. Kubota, S. Komaba, and M. Nagaoka, “Concentration effect of Fluoroethylene carbonate on the formation of solid electrolyte interphase layer in Sodium-Ion batteries.” ACS Appl. Mater. Interfaces, 10, 28585 (2018).
25. A. Ponrouch, A. R. Goñi, and M. R. Palacin,“High capacity hard carbon anodes for sodium ion batteries in additive free electrolyte.”Electrochem. Comm., 27, 85 (2013).
26. R. Dugas, A. Ponrouch, G. Gachot, R. David, M. R. Palacin, and J.-M. Tarascon, “Na Reactivity toward Carbonate-based electrolytes: the effect of FEC as additive.”
J. Electrochem. Soc., 163, A2333 (2016).
27. B. Garcia and M. Armand,“Aluminium corrosion in room temperature molten salt.”J. Power Sources, 132, 206 (2004).
28. D. A. Stevens and J. R. Dahn,“The mechanisms of Lithium and Sodium insertion in carbon materials.”J. Electrochem. Soc., 148, A803 (2001).
29. C. Bommier, T. W. Surta, M. Dolgos, and X. Ji,“New mechanistic insights on Na-Ion storage in nongraphitizable carbon.”Nano Lett., 15, 5888 (2015).
30. A. Ponrouch and M. R. Palacin,“On the high and low temperature performances of Na-ion battery materials: hard carbon as a case study.”Electrochem. Comm., 54, 51 (2015).
31. S. Tanuma, C. J. Powell, and D. R. Penn,“Calculations of electron inelastic mean free paths. IX. Data for 41 elemental solids over the 50 eV to 30 keV range.”Surf. Interface Anal., 43, 689 (2011).
32. R. Dedryvère, S. Laruelle, S. Grugeon, P. Poizot, D. Gonbeau, and J.-M. Tarascon,
Chem. Mater., 16, 1056 (2004).
33. D. Aurbach, B. Markovsky, I. Weissman, E. Levi, and Y. Ein-Eli,Electrochim. Acta, 45, 67 (1999).
34. R. Dedryvère, L. Gireaud, S. Grugeon, S. Laruelle, J.-M. Tarascon, and D. Gonbeau,J. Phys. Chem. B, 109, 15868 (2005).
35. G. Yan, D. Alves-Dalla-Corte, W. Yin, N. Madern, G. Gachot, and J.-M. Tarascon, “Assessment of the electrochemical stability of Carbonate-based electrolytes in Na-Ion batteries.”J. Electrochem. Soc., 165, A1222 (2018).
36. M. Carboni, J. Manzi, A. R. Armstrong, J. Billaud, S. Brutti, and R. Younesi, “Analysis of the solid electrolyte interphase on hard carbon electrodes in Sodium-Ion batteries.”ChemElectroChem, 6, 1745 (2019).
37. H. Yildirim, A. Kinaci, M. K. Y. Chan, and J. P. Greeley,“First-principles analysis of defect thermodynamics and Ion transport in inorganic SEI compounds: LiF and NaF.”ACS Appl. Mater. Interfaces, 7, 18985 (2015).
38. C. Wang, Y. S. Meng, and K. Xu,“Fluorinating interphases.”J. Electrochem. Soc., 166, A5184 (2019).
39. Q. Zhang, J. Pan, P. Lu, Z. Liu, M. W. Verbrugge, B. W. Sheldon, Y.-T. Cheng, Y. Qi, and X. Xiao,“Synergetic effects of inorganic components in solid electrolyte interphase on high cycle efficiency of Lithium Ion batteries.”Nano Lett., 16, 2011 (2016).