Title: First-principles calculations of the phase stability of TiO2.
Auteurs:
Authors: Joseph Muscat, Varghese Swamy et Nicholas M. Harrison
Date: 2002
Type:
Article de revue / Journal articleRéférence:
Citation:
Muscat, J., Swamy, V. & Harrison, N. M. (2002). First-principles calculations of the phase stability of TiO2. Phys. Rev. B, 65(22).
doi:10.1103/physrevb.65.224112
Document en libre accès dans PolyPublie
Open Access document in PolyPublieURL de PolyPublie:
PolyPublie URL: https://publications.polymtl.ca/5041/
Version: Version officielle de l'éditeur / Published versionRévisé par les pairs / Refereed Conditions d’utilisation:
Terms of Use: Tous droits réservés / All rights reserved
Document publié chez l’éditeur officiel
Document issued by the official publisher
Titre de la revue:
Journal Title: Physical Review B (vol. 65, no 22)
Maison d’édition:
Publisher: APS Physics
URL officiel:
Official URL: https://doi.org/10.1103/physrevb.65.224112
Mention légale:
Legal notice:
Ce fichier a été téléchargé à partir de PolyPublie, le dépôt institutionnel de Polytechnique Montréal
This file has been downloaded from PolyPublie, the institutional repository of Polytechnique Montréal
First-principles calculations of the phase stability of TiO
2 Joseph Muscat,1Varghese Swamy,2and Nicholas M. Harrison31CSIRO Minerals, Box 312, Clayton South, Victoria 3169, Australia
2CRCT, Ecole Polytechnique de Montreal, C.P. 6079, succursale Centre-Ville, Montreal, Quebec H3C 3A7, Canada
3CCLRC Daresbury Laboratory, Daresbury, Warrington, WA4 4AD, United Kingdom
and Department of Chemistry, Imperial College of Science and Technology, London, SW7 2AY, United Kingdom
共Received 4 January 2002; revised manuscript received 28 March 2002; published 11 June 2002兲 First-principles calculations of the crystal structures, bulk moduli, and relative stabilities of seven known and hypothetical TiO2polymorphs 共anatase, rutile, columbite, baddeleyite, cotunnite, pyrite, and fluorite structures兲
have been carried out with the all-electron linear combination of atomic orbitals 共LCAO兲 and pseudopotential planewave 共PW兲 methods. The anatase versus rutile relative phase stability at 0 K and zero pressure has been investigated using high-quality basis sets and carefully controlled computational parameters. From the optimal crystal structures obtained with the Hartree-Fock theory at various pressures, the bulk modulus and phase transition pressures of various high-pressure polymorphs have been derived at the athermal limit. In most cases, the calculated unit cell data agree to within 2% of the corresponding experimental determination. Complete predicted structural data 共unit cell constants and fractional atomic coordinates兲 are presented for the baddeleyite and pyrite forms. The calculated bulk moduli are within 10% of the most reliable experimental results. Both the all-electron LCAO and pseudopotential PW methods predict anatase to be more stable than rutile at 0 K and ambient pressure. The computed anatase-columbite, rutile-columbite, columbite-baddeleyite, and baddeleyite-cotunnite phase transitions appear in the same order as observed in experiments, and the transition pressures agree semiquantitatively with those measured. The pyrite and fluorite structures are pre-dicted to be less stable than other polymorphs at pressures below 70 GPa in agreement with experiments. Finally, the elastic properties, compressibilities and phase transformations of the various polymorphs are discussed in terms of simple models based on the behavior of the constituent Ti-O polyhedra under compres-sion.
DOI: 10.1103/PhysRevB.65.224112 PACS number共s兲: 61.50.Ah, 61.50.Ks, 81.30.Hd, 61.66.Fn
I. INTRODUCTION
TiO2 occurs in Nature in three different forms which, in
order of abundance, are rutile, anatase, and brookite. The rutile form is widely used as a white pigment and opacifier. The anatase phase finds applications in, among others, pho-tocatalysts and nanostructured solar cells.1–4 The rutile and
anatase phases have been widely studied in recent years. The rarer mineral brookite is not used commercially; this, coupled with its relatively complicated structure, has led to few studies of its properties.
At elevated pressures TiO2has a rich phase diagram with
a series of structural phase transformations. The structure and stability of the high-pressure phases of TiO2 are of
par-ticular interest in Earth sciences, for these phases are an ac-cessible analog of minerals in the Earth’s mantle. Rutile TiO2
is particularly attractive in this context because it is expected to undergo a sequence of phase transformations with increas-ing pressure similar to that experienced by stishovite SiO2in
the Earth’s mantle, but at more readily accessible pressures. Great interest in the high-pressure phases has also been stimulated by the recent discovery of the ultrahard TiO2
co-tunnite phase. This phase can be stabilized in diamond-anvil cell experiments at about 60 GPa, and is the hardest known oxide material;5its discovery has stimulated much interest in
potential applications of pressure-stabilized phases.
There have been a number of attempts to determine the relative stability of rutile and anatase using calorimetric
methods.6–10However, the enthalpy change of the anatase to
rutile transformation remains somewhat controversial, with room-temperature experiments yielding values ranging from ⌬H298⫽⫺11.7 kJ/mol 共Ref. 7兲 to ⫹0.42 kJ/mol 共Ref. 10兲.
A number of first-principles studies have been performed to address this issue in recent years. Whereas all the studies reproduce observed crystal structures well, the predicted phase stability is found to be sensitive to the treatment of electronic exchange and correlation11–13 and on the
numeri-cal details of the numeri-calculations.14
High pressure x-ray-diffraction15,16,21,23–25 and Raman
spectroscopy17–20,22studies have revealed that rutile and
ana-tase transform to a columbite structure at high pressure. The pressure at which this transformation occurs depends on the starting material: anatase transforms to columbite at 4–8 GPa,20–22whereas rutile undergoes a sluggish transformation
at about 10 GPa.17,19,20 Furthermore, the phase
transforma-tion from anatase to the columbite structure is dependent on whether or not a single crystal sample is used25 and on the
temperature at which the experiment is performed.24 In
re-cent x-ray-diffraction studies it has been reported that, at room temperature, the columbite phase is only formed at about 7 GPa during decompression from a higher pressure phase.23–25However, in Raman studies the transformation of
rutile and anatase directly to columbite has been observed at 5 GPa.17–20,22,84 The columbite phase formed from either
also be obtained at ambient pressures by acid dissolution of Ti3O5.27
Columbite-structured TiO2 transforms to a baddeleyite
structured phase between 12 and 17 GPa.19,22,23,26This
struc-ture is significantly more complex than columbite, and is harder to obtain and characterize experimentally because of the difficulties involved in applying higher pressures and in quenching the high-pressure phase. This complexity also means that it is computationally demanding to study theoreti-cally; to our knowledge, there has only been one previous ab
initio determination of the lattice vectors and internal
coor-dinates of this phase.13
The situation regarding post-baddeleyite transition共s兲 has been less clear until very recently. A number of observations suggested a transformation to a cubic phase at pressures of about 60 GPa but with insufficient data available to fully determine the structure.22,28,29 Several metal oxides, which
are rutile structured at 0 GPa, are known to transform to fluorite structured phases at high pressure, and, on this basis, it has been postulated that this phase adopts a fluorite structure.22,28,29 Later studies including Rietveld refinement
of x-ray-diffraction data from three rutile-structured oxides (SnO2, PbO2, and RuO2) revealed that the high-pressure
phase in these systems actually adopts a pyrite structure.39
Several theoretical studies have been performed to assist in the identification of these phases. In particular, the cubic CaF2 共fluorite兲 structure30 and a modification of this form
which is isostructural with FeS2 共pyrite兲 have been proposed
as candidate high-pressure phases.31
Unfortunately, confirming the existence of these predicted structures by performing experiments at such high pressures poses many technical difficulties22which had, until recently,
precluded the detailed determination of the post-baddeleyite phase. However, a recent study which included Reitveld re-finement of phases synthesised at pressures up to 80 GPa revealed a transition from a baddeleyite to a cotunnite (PbCl2) structure at 60 GPa, which was concurrently verified
by means of first-principles and lattice-dynamics calculations.5
Calculations of carefully controlled numerical precision have a key role to play in determining the stability and struc-ture of materials under conditions that are difficult to repro-duce in the laboratory. A detailed description of the rich phase diagram, including phases with sixfold, sevenfold, eightfold, and ninefold Ti-O coordinations is a challenge for any theoretical treatment of the bonding and energetics of TiO2. Much progress in understanding the bulk and defect
chemistry of TiO2 has been made with empirical forcefield
modeling.32 However, such models often have limited
pre-dictive power, failing when applied to systems not taken into account in the original parametrization of the model. Despite recent efforts to develop force fields that can treat different coordination environments, it has been found that their per-formance varies from phase to phase depending on the prop-erty being computed, and these models give poor results for some phases.33First-principles calculations provide an
unbi-ased and thus predictive approach to the modeling of phases for which experimental data are not available. However, in applying first-principles techniques to complex materials,
electron exchange and correlation interactions must be ap-proximated and a number of numerical approximations adopted.
In this paper the results of high-quality first-principles cal-culations of the structure and phase stability of TiO2 over a
wide range of pressures are presented. For known polymphs the computed data are compared to that observed in or-der to establish the validity of predictions for higher-pressure phases. The stability of some key results with respect to the treatment of exchange and correlation and to numerical ap-proximations is explored. The delicate relative stability of rutile and anatase at ambient pressure is studied using both high quality, all-electron, linear combination of atomic or-bital 共LCAO兲 and pseudopotential, plane-wave 共PW兲 meth-ods. A determination of the structures of the high-pressure phases baddeleyite and pyrite is presented. The stability of the cotunnite phase relative to the pyrite and fluorite phases below 60 GPa is confirmed. Finally, these calculations offer valuable insights into the nature of the phase transformations and the crucial link between the structure of a material on the atomic scale and its macroscopic properties.
The paper is organized as follows. In Sec. II a brief de-scription of structures of the different phases considered in this paper is given. Section III contains details of the com-putational methods used. Computed data including the phase stability, structure, and elastic properties of rutile and anatase are given in Sec. IV A, and data regarding the high-pressure phases is given in Sec. IV B. These results are discussed in Sec. V and conclusions drawn in section VI.
II. POLYMORPHS OF TiO2
As an understanding of the crystal structure and bonding of TiO2 is important to the work presented in this paper, we
describe the structure of the various polymorphs in some detail.
A. Rutile
The vast majority of studies of the bulk and surface prop-erties of TiO2have been of the rutile phase. The rutile
struc-ture, illustrated in Fig. 1, belongs to the P42/mnm
tetrago-nal space group. The unit cell is defined by the lattice vectors a and c and contains two TiO2 units with Ti ions at 共0,0,0兲
and (1
2,12,12) and O ions at ⫾(u,u,0) and ⫾(u⫹12,12-u,12).
The unit-cell parameters have been determined and subse-quently verified several times using x-ray34,35 and neutron
diffraction,36,37 and are found to be a⫽4.587 Å, c
⫽2.954 Å, and u⫽0.305 at 15 K 共Ref. 37兲 共see Table I兲. Each Ti ion is octahedrally coordinated to six O ions. The TiO2 octahedron is distorted, with the apical Ti-O bond
length 共1.98 Å兲 being slightly longer than the equatorial Ti-O bond length 共1.95 Å兲. The four equatorial O ions are copla-nar occupying a rectangular arrangement with the long edge 共2.954 Å兲 along the c direction and the short edge 共2.53 Å兲 lying diagonally across the plane defined by thea direction. The TiO6octahedra form chains that share edges along thec
direction and share vertices in the a-b plane 共see Fig. 6 in Sec. V兲.
B. Anatase
The anatase structure, shown in Fig. 1, is characterized by the tetragonal space group I4/amd. The unit cell contains two TiO2units with Ti ions at 共0,0,0兲 and (0,12,14) and O ions
at (0,0,u), (0,0,u¯), (0,1
2,u⫹14) and (0,12,12-u). As with
rutile, a, c, and u have been measured several times using both x-ray34,35 and neutron diffraction36,37 to be 3.782 Å,
9.502 Å, and 0.208, respectively, at about 300 K 共see Table I兲. Each Ti ion is octahedrally coordinated to six O ions. The Ti-O octahedron is not regular and the Ti-O bond distances are similar to those in rutile 共1.98 and 1.93 Å for the long and short Ti-O bond lengths respectively兲. The octahedra form zigzag chains along the a and b directions with each octahedron sharing four edges 共see Fig. 7 in Sec. V兲.
C. Columbite
The columbite structure, presented in Fig. 1, has an ortho-rhombic unit cell with the Pbcn space group and lattice vectors a⫽4.541 Å b⫽5.493 Å, and c⫽4.906 Å. There
are four TiO2 units per cell with Ti ions at ⫾(0,u,12) and
⫾(1
2,u⫹12,14) and O ions at ⫾(x,y,z), ⫾(12-x,12-y,z⫹12),
⫾(x⫹1
2,12-y,z¯), and (x¯,y,12-z). The internal fractional
coor-dinates 共u, x, y, and z兲 have been determined in high-pressure x-ray-diffraction studies to be 0.171, 0.286, 0.376, and 0.412, respectively.38As with rutile and anatase, each Ti
ion is octahedrally coordinated to six O ions. The octahedron is distorted with the cation displaced from the center of the octahedron. The Ti-O bond distances range from 1.91 to 2.05 Å, with a mean bond length similar to that of rutile. The octahedra form planar chains sharing edges in a zigzag ar-rangement along thec direction 共see Fig. 8 in Sec. V兲.
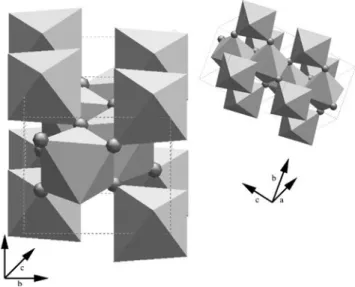
D. Baddeleyite
The baddeleyite phase is formed under compression to about 20 GPa.26 The unit cell of this phase is displayed in
Fig. 1. Baddeleyite is often described as an intermediate structure between rutile and fluorite, and is adopted by sev-eral other materials including ZrO2. The unit cell is
mono-clinic 共space group P21/c) containing four TiO2 units with
Ti and O ions at ⫾(x,y,z;x¯,y⫹1
2,12-z). The lattice vectors
have been measured in x-ray studies and are 共extrapolated to 0 GPa兲 a⫽4.662 Å, b⫽4.969 Å, c⫽4.911 Å, and 
⫽99.4°.23The internal coordinates x, y, and z of the ions in this structure have not previously been determined, to our knowledge. Each Ti ion is coordinated to seven O ions, and the oxygen ions form alternating threefold- and fourfold-coordinated layers.
E. Fluorite
Very high-pressure experiments have suggested that TiO2
transforms to a cubic structure at pressures in excess of about 60 GPa.22,28,29It has been suggested that this phase has the
fluorite (CaF2) structure characterized by the Fm3m space
group. Structural data for this phase have yet to be deter-mined.
The fluorite structure has one formula unit per primitive cell with the cation occupying the 共0,0,0兲 position while the anions are at ⫾(1
4,14,14), as shown in Fig. 1. Each Ti ion is
coordinated to eight O ions, and hence each O ion is tetra-hedrally coordinated to Ti ions.
F. Pyrite
SnO2, RuO2, and ZrO2, which all have a rutile structure
at 0 GPa, have also been observed to transform to a cubic structure at high pressures.39 This structure was assumed to
be fluorite, but recent Rietveld refinement from x-ray-diffraction data has revealed that the cubic phase is actually a modified or distorted fluorite structure isostructural to pyrite FeS2 共space group Pa3¯). As the Pa3¯ space group is a
sub-group of Fm3m, a continuous phase transformation from one to the other is possible. The main difference between this structure and the fluorite structure is that the O ions are dis-placed from ⫾(1
4,14,14) to about ⫾(0.34, 0.34, 0.34兲 共see Fig.
1兲. This leads to each Ti ion having an inner shell of six O
FIG. 1. The phases of TiO2studied here: rutile 共a兲, anatase 共b兲,
columbite 共c兲, baddeleyite 共d兲, fluorite 共e兲, pyrite 共f兲, and cotunnite 共g兲. Large spheres represent the O ions, small spheres the Ti ions.
ions with a further two O ions slightly further away 关共6⫹2兲-fold coordination兴. In light of these findings and the lack of reliable data for TiO2 at very high pressures, it seems
pos-sible that TiO2 may also adopt the Pa3¯ structure. To the
authors’ knowledge, this possibility has not been explored in previous work.
G. Cotunnite
The cotunnite (PbCl2) structured TiO2 was recently
dis-covered in high pressure diamond anvil experiments at pres-sures above 60 GPa. The unit cell of cotunnite is illustrated in Fig. 1. This structure is orthorhombic, belonging to the space group Pnma with the lattice vectors determined at 61 GPa to be a⫽5.163 Å, b⫽2.989 Å, and c⫽5.966 Å. There are four TiO2 formula units per unit cell with ions at
⫾(x,1
4,z; x⫹12,14,12-z), where for the Ti ions, x⫽0.264 and
z⫽0.110; for one O ion, x⫽0.346 and z⫽0.422; and for the
second O ion, x⫽0.012 and z⫽0.325. The Ti ions are nine-fold coordinated to O and the O ions form elongated tri-capped trigonal prisms containing the titanium atoms.
III. METHOD
The calculations presented have been performed using the LCAO, all-electron, CRYSTAL98software,40with supplemen-tary calculations performed using the PW pseudopotential softwareCASTEP.41
In the LCAO formalism implemented in CRYSTAL98, the crystalline orbitals are expanded as a linear combination of atom centered Gaussian orbitals with s, p, or d symmetry 共the basis set兲. All-electron 共AE兲 calculations were per-formed in which there is no shape approximation to the po-tential or density. A variety of treatments of exchange and correlation were used: Hartree-Fock 共HF兲 theory, where ex-change is computed exactly but correlation is neglected, and density functional theory 共DFT兲 using the local-density ap-proximation 共LDA兲42,43 and the generalized gradient
ap-proximation 共GGA兲.44
The main numerical approximation in these calculations is the choice of the basis set. High quality all-electron basis sets developed and optimized for use in rutile TiO2bulk and
surface studies45,46have been used.47A basis set having three
independent radial functions to describe each valence
elec-TABLE I. A selection of previous theoretical and experimental structural parameters for rutile and anatase 共in Å兲. The abbreviations describing the methods used in the theoretical studies are given in Sec. III. The LCAO-HF 共Refs. 11,57,58,63 and 65兲 and LCAO-LDA 共Ref. 63兲 calculations are performed using the CRYSTAL package. Numbers in parentheses indicate the percent deviation from low-temperature neutron-diffraction experiments. Method a c u Rutile PW-LDA SC 共Ref. 14兲 4.555 共-0.70兲 2.922 共-1.08兲 0.304 共-0.33兲 PW-LDA SC 共Ref. 14兲 4.528 共-1.29兲 2.918 共-1.21兲 0.303 共-0.66兲 PW-LDA SC 共Ref. 61兲 4.567 共-0.44兲 2.932 共-0.74兲 0.305 共 0.00兲 PW-LDA LC 共Ref. 60兲 4.536 共-1.11兲 2.915 共-1.32兲 0.304 共-0.33兲 PW-LDA LC 共Ref. 59兲 4.653 共 1.44兲 2.966 共 0.41兲 0.305 共 0.00兲 PW-LDA LC 共Ref. 13兲 4.603 共 0.35兲 2.976 共 0.74兲 0.304 共-0.33兲 PW-LDA LC 共Ref. 62兲 4.638 共 1.11兲 2.923 共-1.05兲 0.305 共 0.00兲 PW-GGA LC 共Ref. 13兲 4.624 共 0.81兲 2.992 共 1.29兲 0.305 共 0.00兲 PW-GGA LC 共Ref. 64兲 4.690 共 2.25兲 2.990 共 1.22兲 0.306 共 0.33兲 OLCAO-LDA AE 共Ref. 66兲 4.622 共 0.77兲 2.983 共 0.99兲 0.304 共-0.33兲 LCAO-HF LC 共Ref. 57兲 4.555 共-0.70兲 2.998 共 1.49兲 0.306 共 0.33兲 LCAO-HF AE 共Ref. 58兲 4.560 共-0.59兲 3.022 共 2.30兲 0.305 共 0.00兲 LCAO-HF AE 共Ref. 65兲 4.529 共-1.26兲 3.088 共 4.54兲 0.305 共 0.00兲 LCAO-HF AE 共Ref. 65兲 4.548 共-0.85兲 2.993 共 1.32兲 0.305 共 0.00兲 LCAO-LDA AE 共Ref. 63兲 4.529 共-1.26兲 2.942 共-0.41兲 0.304 共-0.33兲 X ray 298 K 共Ref. 34兲 4.594 共 0.15兲 2.958 共 0.14兲 0.305 共 0.00兲 Neutron 295 K 共Ref. 37兲 4.593 共 0.13兲 2.959 共 0.17兲 0.305 共 0.00兲 Neutron 15 K 共Ref. 37兲 4.587 2.954 0.305 Anatase PW-LDA SC 共Ref. 14兲 3.744 共-1.00兲 9.497 共-0.05兲 0.207 共-0.48兲 PW-LDA SC 共Ref. 14兲 3.747 共-0.93兲 9.334 共-1.77兲 0.210 共-0.96兲 PW-LDA LC 共Ref. 13兲 3.781 共-0.03兲 9.793 共 3.06兲 0.204 共-1.92兲 LCAO-HF LC 共Ref. 11兲 3.763 共-0.50兲 9.851 共 3.67兲 0.202 共-2.88兲 X ray 301 K 共Ref. 35兲 3.785 共 0.08兲 9.514 共 0.13兲 0.208 共 0.00兲 Neutron 295 K 共Ref. 37兲 3.785 共 0.08兲 9.512 共 0.11兲 0.208 共 0.00兲 Neutron 15 K 共Ref. 37兲 3.782 9.502 0.208
tron is denoted as a triple-valence all-electron 共TVAE兲 basis set. The TVAE basis set has been used extensively in previ-ous studies of TiO2.46,48–50In the current study this basis set
is supplemented by the addition of a d-symmetry polariza-tion funcpolariza-tion on the O ions to produce the TVAE* basis set. While this additional flexibility has only a minor effect on the description of the rutile phase, it is found to be important for an accurate description of the anatase structure: the error in the c lattice constant of the latter is reduced from 5% to 2%. It has recently been demonstrated that although the TVAE* basis set describes structural properties consistently well, it is not sufficient to converge subtle differences in the energies of related structures.31,48 In order to converge the
energy difference between phases we have thus used the TVAE** basis set in which an additional diffuse d-symmetry function on the titanium ions is included47.
The sampling of k space is also an important approxima-tion. Pack-Monkhorst grids40,51of shrinking parameters 4–8
were used depending on the phase being treated. Tests showed that this was sufficient to converge structures to bet-ter than 0.01 Å, total energies to 0.25 kJ/mol, and energy differences between phases to 0.025 kJ/mol.
A further approximation in the present study is related to the use of local basis functions. The truncation of the direct space summations of the Coulomb and exchange series is controlled by five Gaussian overlap criteria. The control of these approximations was described in detail elsewhere.40,52
Tests showed that using values of 10⫺7, 10⫺6, 10⫺7, 10⫺7,
and 10⫺14results in a numerical error of around 2 kJ/mol and
less than 0.01 Å per unit cell in the relative energies and structures of different phases. In the calculations comparing the delicate stability of rutile and anatase, we used very high tolerances 共up to 10⫺9, 10⫺8, 10⫺9, 10⫺9, and 10⫺16). The
structural optimizations were converged to a displacement of less than 0.01 Å, or an energy difference of less than 10⫺4 kJ/mol using a Broyden-Fletcher-Goldfarb-Shanno
共BFGS兲 minimization algorithm.53
Supplementary PW-pseudopotential calculations were performed using theCASTEPsoftware.41The LDA and GGA functionals used were the same as for the LCAO calcula-tions. The Ti (1s, 2s, and 2p) and O (1s) core states were described using small-core 共SC兲 ultrasoft pseudopotentials.54
Previous work has shown that large-core 共LC兲 pseudopoten-tials that incorporate Ti 3s and 3p states can lead to signifi-cant errors in the calculation of structural and energetic properties.48The sampling of k space was performed using a
Monkhorst-Pack net55 of shrinking factor 4. A range of
plane-wave cutoff energies (Ecut) from 300 to 600 eV was
used to ensure convergence of the structure and relative en-ergies of different phases to about 0.001 Å and 2 kJ/mol per unit cell, respectively. The calculations of TiO2at high
pres-sures were performed by applying an hydrostatic pressure and minimizing the enthalpy
H⫽U⫹PV 共1兲
with respect to all structural parameters.
Bulk moduli have been computed by fitting to a Birch-Murnaghan equation of state of the form56
P⫽1.5KT关共V0/V兲7/3⫺共V0/V兲5/3⫻关1⫺0.75共4⫺K
⬘
兲⫻共V0/V兲2/3⫺1兴. 共2兲
For all phases, cell optimizations were performed for at least nine different pressures.
IV. RESULTS
A. Structure, phase stability, and elastic properties of rutile and anatase at 0 GPa
Before discussing the high-pressure phases the relative stability of rutile and anatase at 0 GPa is considered in some detail. Above 870 K, anatase and brookite are found to trans-form irreversibly to rutile.6The enthalpy change in the
ana-tase to rutile transformation has been measured using calori-metric techniques. There are significant differences in the values reported in the literature: from the exothermic values of ⌬H298⫽⫺11.7 kJ/mol,7 ⌬H968⫽⫺6.56 kJ/mol,8
⌬H971⫽⫺3.26 kJ/mol,6 and ⌬H903⫽⫺0.42 kJ/mol ,9 to
the endothermic values of ⌬H1183⫽⫹11.66 and ⌬H298
⫽⫹0.42 kJ/mol.10
As a prerequisite to determining the energetics of the two phases, it is important that fully unconstrained and carefully converged structures are obtained. In Table I, a summary of the results from a selection of experimental and recent ab
initio studies of the structural parameters of rutile and
ana-tase is presented. Early HF,57,58PW-LDA,59–62and combined
HF and DFT studies of rutile63 yielded lattice parameters to
within 2% of experiment. More recent studies that have taken advantage of improvements in the theoretical tech-niques and available computing power to perform calcula-tions with improved treatments of exchange and correlation 共DFT calculations based on the GGA兲 共Refs. 13 and 64兲 and higher numerical accuracy 共improved basis sets兲 共Ref. 65兲 have yielded results consistent with those from the earlier work. There have been only a few publications of the lattice parameters of anatase computed using ab initio methods. LCAO-HF 共Ref. 11兲 and PW-LDA 共Ref. 13兲 studies using large core pseudopotentials yielded structures with 3–4 % errors in the c lattice constant, but later work using small core pseudopotentials reduced these errors to 1–2 %. Studies of the energetics of rutile, anatase and brookite with the orthogonalized-linear-combinations-of-atomic-orbitals meth-od within the LDA predicted reasonably accurate lattice pa-rameters for rutile, but the other two phases were not relaxed fully.66
Generally speaking, all the ab initio studies of rutile and anatase have yielded structural parameters to within a few percent of experiment. The structural parameters computed in the current study are given in Table II. While the present HF, LDA, and GGA calculations all yield lattice parameters in reasonable agreement with experiment, there are clear trends with regards to treatment of exchange and correlation. For rutile, HF theory tends to underestimate a and overesti-mate c, resulting in an overestimate of the cell volume, the LDA leads to an underestimate of botha and c and the GGA to an overestimate of both a and c. Similar trends are also seen for anatase. Although all the LCAO calculations
over-estimate c, the LCAO-LDA calculations yield the smallest overestimate. The structures in Table I computed using a LCAO formalism with an AE basis set show the same trends as the current results.
When making comparisons with the previous PW results, it is important to note that the pseudopotential approximation can have a significant effect on the computed structures. Cal-culations on bulk and surfaces of TiO2 polymorphs have
demonstrated that the LC pseudopotential approximation tends to give results in significantly worse agreement with experiment compared to the SC pseudopotential.48In the
cur-rent study, all PW calculations have been performed using SC pseudopotentials, and give the same trends as the previ-ous PW-SC and LCAO-AE results, whereas a number of PW calculations in Table I employed LC pseudopotentials and a large scatter is seen in the trends of these computed struc-tures. For example, the PW-LC calculations of rutile per-formed with the LDA have predicted an underestimate of a andc60, an overestimate ofa and c,13,59and an overestimate
of a but an underestimate of c.62
For anatase, incorporating a d-symmetry polarization function on the O basis set leads to a significant improve-ment in the agreeimprove-ment with experiimprove-ment. A thorough discus-sion of the influence of basis set on the computed structure of rutile and anatase was given elsewhere.31 As can be seen
from Table II,a, c, and u are within 2% of experiment with
d functions, whereas thec parameter can be as much as 5% too large without it. This indicates that the O ion responds to its nonspherical environment with quadrupolar distortions which cannot be treated adequately using only s- and
p-symmetry functions.
An early comparison of the energetics of rutile and ana-tase using LCAO-HF theory with smaller basis sets than that used in the current study yielded structural parameters in good agreement with experiment and found anatase to be the lower-energy phase by 2.51 kJ/mol.11The addition of a pos-teriori correlation based on DFT 共Ref. 12兲 reversed this
trend, yielding rutile as the more stable phase by between 2.96 and 11.50 kJ/mol, depending on the correlation func-tional used.
PW-LDA and PW-GGA calculations using LC pseudopotentials13 predicted the structure of the rutile,
ana-tase, brookite, and columbite phases to within 2% of experi-ment. However, these calculations were in disagreement with regard to the phase stability of rutile and anatase. The LDA calculations predict rutile to be more stable than anatase by 2.11 kJ/mol, whereas the GGA calculations yield anatase as the more stable phase by 4.82 kJ/mol.
A recent PW-LDA study found that the relative stability of the two phases is sensitive to the pseudopotential even when SC pseudopotentials are used.14 Two different SC
pseudopotentials were tested, with one type yielding anatase as the more stable form by 5.852 kJ/mol 共Troulier Martin pseudopotential兲 and the other predicting rutile to be the more stable form by 4.598 kJ/mol 共Teter pseudopotential兲. It is clear that the predicted relative stability of the two phases is very sensitive to the numerical approximations and to the treatment of exchange and correlation adopted.
In Table III the influence of the basis set on the computed energy difference between rutile and anatase is reported. As the basis set is improved, the total energy varies significantly but the energy differences are far less sensitive with the ana-tase phase clearly the more stable. The PW calculations per-formed in the current study with a SC pseudopotential also
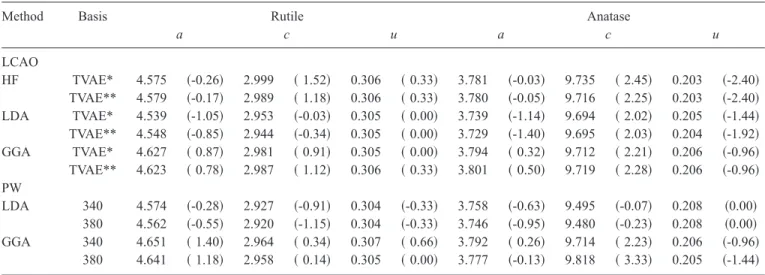
TABLE II. The optimized structural parameters of rutile and anatase 共in Å兲 computed using ab initio methods. Numbers in parentheses indicate the percent deviation from experiment.
Method Basis Rutile Anatase
a c u a c u LCAO HF TVAE* 4.575 共-0.26兲 2.999 共 1.52兲 0.306 共 0.33兲 3.781 共-0.03兲 9.735 共 2.45兲 0.203 共-2.40兲 TVAE** 4.579 共-0.17兲 2.989 共 1.18兲 0.306 共 0.33兲 3.780 共-0.05兲 9.716 共 2.25兲 0.203 共-2.40兲 LDA TVAE* 4.539 共-1.05兲 2.953 共-0.03兲 0.305 共 0.00兲 3.739 共-1.14兲 9.694 共 2.02兲 0.205 共-1.44兲 TVAE** 4.548 共-0.85兲 2.944 共-0.34兲 0.305 共 0.00兲 3.729 共-1.40兲 9.695 共 2.03兲 0.204 共-1.92兲 GGA TVAE* 4.627 共 0.87兲 2.981 共 0.91兲 0.305 共 0.00兲 3.794 共 0.32兲 9.712 共 2.21兲 0.206 共-0.96兲 TVAE** 4.623 共 0.78兲 2.987 共 1.12兲 0.306 共 0.33兲 3.801 共 0.50兲 9.719 共 2.28兲 0.206 共-0.96兲 PW LDA 340 4.574 共-0.28兲 2.927 共-0.91兲 0.304 共-0.33兲 3.758 共-0.63兲 9.495 共-0.07兲 0.208 共0.00兲 380 4.562 共-0.55兲 2.920 共-1.15兲 0.304 共-0.33兲 3.746 共-0.95兲 9.480 共-0.23兲 0.208 共0.00兲 GGA 340 4.651 共 1.40兲 2.964 共 0.34兲 0.307 共 0.66兲 3.792 共 0.26兲 9.714 共 2.23兲 0.206 共-0.96兲 380 4.641 共 1.18兲 2.958 共 0.14兲 0.305 共 0.00兲 3.777 共-0.13兲 9.818 共 3.33兲 0.205 共-1.44兲
TABLE III. Calculated energy difference (␦E⫽Erutile
⫺Eanatase) between rutile and anatase.
Method ␦E (kJ/mol)
LCAO Basis set
TVAE* TVAE** HF 2.72 4.25 LDA -0.32 1.88 GGA 5.46 7.59 PW Ecut共eV兲 340 380 LDA 3.31 2.13 GGA 7.17 9.68
predict anatase to be the more stable form with the LDA and GGA relative stabilities in excellent agreement with the re-sults from the LCAO calculations, performed using the TVAE** basis set. Additional tests performed with the CASTEPcode using very high-energy cutoffs 共up to 600 eV兲 did not have a significant influence on either the order of the phases or the magnitude of the stability.
As noted above, a previous HF study found anatase to be the more stable phase but addition of a posteriori correlation corrections reversed this trend.11 We have calculated the
‘‘correlation corrected’’ total energies of rutile and anatase using the TVAE** basis set within the HF approximation using all the available exchange-correlation functionals in CRYSTAL98. Using a variety of LDA 共Perdew-Zunger,43 Vosko-Wilk-Nusair,67 Von Barth-Hedin,68 and
Perdew-Wang69–71兲 and GGA 共Colle-Salvetti,72
Wigner-Levy,73 Perdew 86,74 Perdew 91,75
Perdew-Wang,69–71,75 Becke,76 Perdew-Burke-Ernzerhof,44
and Lee-Yang-Parr77兲 functionals as a posteriori corrections
to the HF total energy yields a value of ␦Erutile-anatase of
between 3.1 and 3.5 kJ/mol for LDA functionals and -1.5 and -9.5 kJ/mol for GGA functionals. Clearly, the use of self-consistent exchange and correlation is required for reliable results.
The computed bulk moduli of rutile and anatase and the phases discussed in Sec. IV B are presented in Table IV. The bulk modulus of rutile has been measured to be about 210 GPa,78–80 with more recent studies verifying this value.23,81
Until recently, there was considerable disagreement in the literature as to even the approximate magnitude of the ex-perimental bulk modulus of anatase, with measurements ranging from 59 GPa 共Ref. 21兲 to 360 GPa.22 Two recent
independent measurements have clarified the matter: both
experiments yielded a bulk modulus of around 180 GPa.25,82
Arlt et al.25 pointed out that the use of single crystal as
opposed to powder samples can have an influence on the measured bulk modulus but this effect was found to be within the experimental error bars 共179 GPa for a single-crystal sample and 190⫾10 GPa for a powder sample兲. The computed bulk modulus of rutile in the current work is in good agreement with experiment being only around 10% too high and is in excellent agreement with previous PW studies.13,30,59The discrepancy between the rutile bulk
modu-lus computed in this study and that from the recent all-electron LCAO studies using very similar computational techniques is due to the fitting procedure used to compute the bulk modulus. In the current study, the Birch-Murnaghan equation of state56has been used to extract the bulk modulus,
whereas the values from the previous LCAO studies were computed from a polynomial fit of the energy-volume curve. Computing the bulk modulus with the fitting procedure de-scribed in Ref. 63, values of 277 GPa 共HF兲 and 253 GPa 共LDA兲 were obtained. Clearly, the fitting procedure has a significant influence on the predicted modulus. The Birch-Murnaghan equation of state is used in this study because most experimental studies use this equation of state to extract bulk moduli from pressure-volume data.
The bulk modulus of anatase is calculated to be lower than that of rutile 共by about 15%兲, in agreement with experi-ment. The computed bulk modulus of about 200 GPa is in reasonable agreement with previous PW-LDA calculations which found it to be about 190 GPa 共Refs. 13 and 30兲 and the experimental value of 180 GPa.25,82
The calculations of Mo and Ching,66which predicted
ana-tase to have a higher bulk modulus than rutile, were per-formed under the constraint of a fixedcÕa ratio during
opti-TABLE IV. The bulk moduli 共in GPa兲 of the various phases of TiO2computed in the current work with
the TVAE* basis set using HF and LDA treatments of exchange and correlation. The LCAO-HF 共Refs. 63 and 65兲 and LCAO-LDA 共Ref. 63兲 calculations have been performed using theCRYSTAL98package. Method Rutile Anatase Columbite Baddeleyite Pyrite Fluorite Cotunnite LCAO-HF 239⫾10 202⫾10 264⫾10 300⫾10 318⫾10 331⫾10 380⫾10 LCAO-LDA 241⫾10 195⫾10 273⫾10 308⫾10 LCAO-HF 共Ref. 63兲 281 LCAO-LDA 共Ref. 63兲 264 LCAO-HF 共Ref. 65兲 304 LCAO-HF 共Ref. 65兲 236 LCAO-LDA 共Ref. 66兲 209 272 PW-LDA 共Ref. 59兲 240 PW-LDA 共Ref. 30兲 243 194 247 249 282 PW-LDA 共Ref. 13兲 244 190 215 287 X ray 共Ref. 33兲 178⫾1 X ray 共Ref. 25兲 179⫾2 258⫾8 290⫾10 X ray 共Ref. 85兲 253⫾4 X ray 共Ref. 21兲 59 98 522 X ray 共Ref. 78兲 211⫾7 X ray 共Ref. 22兲 360 X ray 共Ref. 23兲 230⫾20 260⫾30 290⫾20 X ray 共Ref. 5兲 178⫾1 304⫾6 431⫾10
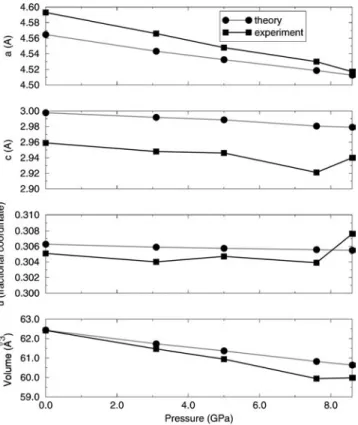
mization of the volume at a given applied pressure. However, the current calculations demonstrate that rutile and anatase both undergo anisotropic compression. The computed change in thecÕa ratio with pressure for the two phases is illustrated in Fig. 2. The ratio increases for rutile and decreases for anatase as the cell volume is reduced. The longer cell vector 共a for rutile and c for anatase兲 is the more compressible in both structures, in agreement with experimental observations21,23,33,78,83 共see Fig. 3兲. Constraining the unit
cell to a fixedcÕa ratio leads to significant errors in the com-puted structure and bulk modulus.
B. High-pressure phases
TiO2 has a rich phase diagram and forms a number of
high-pressure phases, as described in Sec. I. Many of these phases have not been well characterized. For example, the existence of the fluorite phase of TiO2 has only been
tenta-tively assigned, and it is not certain whether the fluorite and pyrite phases can exist between baddeleyite and cotunnite or if they are post-cotunnite. Although there have been theoret-ical calculations of the fluorite structure13,30there have been
no predictions of the structure or energetics of the pyrite or cotunnite phases. In order to understand the high-pressure phase diagram of TiO2, we have performed HF calculations
of the rutile, anatase, columbite, baddeleyite, fluorite, pyrite, and cotunnite phases at pressures up to at least 70 GPa.
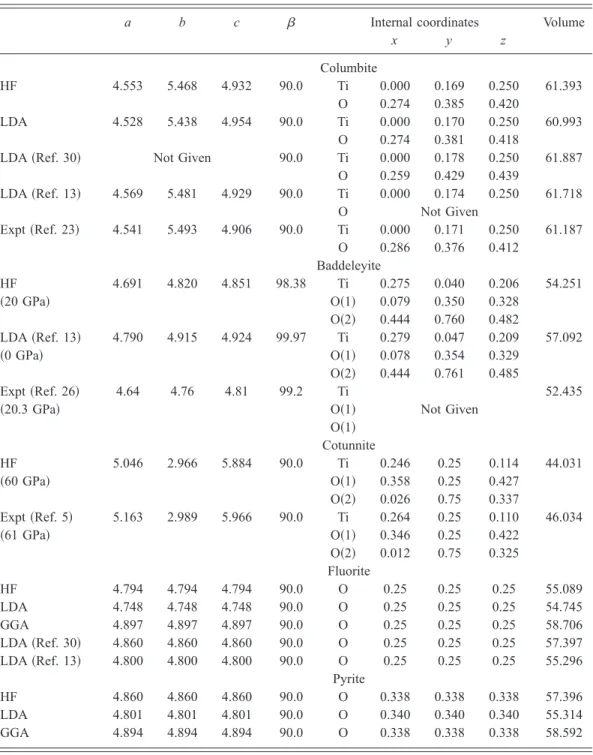
The predicted structures for the rutile and post-anatase phases are presented in Table V. The calculated cell parameters for columbite at 0 GPa are in excellent agreement
with previous results from LDA calculations and x-ray-diffraction experiments. The a, b, and c lattice parameters computed with HF and LDA methods are within 1% of ex-periment. The predicted cell volume is overestimated by the HF methods 共by 0.34%兲 and underestimated by the LDA 共by 0.32%兲; these trends are consistent with those calculated for the rutile and anatase phases 共Sec. IV A兲. The current HF and LDA calculations predict internal coordinates in excel-lent agreement with experimental observations23 and in
rea-sonable agreement with the results of recent PW-LDA calculations.30
For baddeleyite, the computed lattice vectors are in excel-lent agreement 共within around 1%兲 with those observed.26To
our knowledge, there have been no experimental determina-tion of the internal coordinates of this phase. The lattice vec-tors and internal coordinates of cotunnite have recently been measured,5 and the current calculations are in agreement
with this data 共see Table V兲. For the pyrite and fluorite phases, no experimental data on their structures are avail-able; the structure computed here for the fluorite phase is in reasonable agreement with previous ab initio studies.13,30
The computed bulk moduli, along with the known experi-mental determinations for all the phases considered in this paper, are presented in Table IV. The bulk modulus of columbite TiO2 was measured in an early study to be 98
GPa,21but more recent work has reported it to be somewhat
higher than that of rutile; 250–260 GPa.23,85The current HF
calculations predict a value of 264 GPa, in good agreement with the most recent PW-LDA calculations 共247 GPa兲,13 but
somewhat higher than an earlier study which found it to be
FIG. 2. The change in c/a ratio with cell volume of rutile and anatase computed within the HF approximation.
FIG. 3. Effect of pressure on the lattice parameters of rutile TiO2computed within the HF approximation. Experimental data are
215.30The bulk modulus of the baddeleyite phase has been
determined several times, with the most recent studies giving a value around 300 GPa.5,25,23Haines and Le`ger21reported a
value of 522 GPa, although there is serious doubt about the accuracy of this datum as only a few points were used to fit the Birch-Murnaghan equation of state; this study also re-ported very low bulk moduli for the anatase and columbite phases 共59 and 98 GPa兲, in stark contrast to other studies.
For the pyrite, fluorite, and cotunnite phases, the com-puted HF bulk moduli are 318, 331, and 380 GPa. There have been no previous determinations of the bulk modulus of
the pyrite phase, but the fluorite phase has been modeled with its bulk modulus predicted to be around 280–290 GPa.13,30 Calculations of the bulk modulus of the fluorite
phase using the LDA yield a lower value of 308 GPa, in reasonably good agreement with previous PW-LDA studies. As can be seen from Table IV, HF theory tends to yield a bulk modulus higher than the LDA value, consistent with the results of a recent comparative study of the effect of the treatment of exchange and correlation on the computed bulk modulus.86 For the cotunnite phase, the computed bulk
modulus is about 10% lower than that observed.
TABLE V. The structural parameters of the high-pressure phases of TiO2 共lengths in Å and angles in
degrees兲 computed at 0 GPa 共unless specified兲 with the TVAE* basis set. The cell volume is in Å3for two
TiO2formula units.
a b c  Internal coordinates Volume
x y z Columbite HF 4.553 5.468 4.932 90.0 Ti 0.000 0.169 0.250 61.393 O 0.274 0.385 0.420 LDA 4.528 5.438 4.954 90.0 Ti 0.000 0.170 0.250 60.993 O 0.274 0.381 0.418
LDA 共Ref. 30兲 Not Given 90.0 Ti 0.000 0.178 0.250 61.887 O 0.259 0.429 0.439 LDA 共Ref. 13兲 4.569 5.481 4.929 90.0 Ti 0.000 0.174 0.250 61.718 O Not Given Expt 共Ref. 23兲 4.541 5.493 4.906 90.0 Ti 0.000 0.171 0.250 61.187 O 0.286 0.376 0.412 Baddeleyite HF 4.691 4.820 4.851 98.38 Ti 0.275 0.040 0.206 54.251 共20 GPa兲 O共1兲 0.079 0.350 0.328 O共2兲 0.444 0.760 0.482 LDA 共Ref. 13兲 4.790 4.915 4.924 99.97 Ti 0.279 0.047 0.209 57.092 共0 GPa兲 O共1兲 0.078 0.354 0.329 O共2兲 0.444 0.761 0.485 Expt 共Ref. 26兲 4.64 4.76 4.81 99.2 Ti 52.435
共20.3 GPa兲 O共1兲 Not Given
O共1兲 Cotunnite HF 5.046 2.966 5.884 90.0 Ti 0.246 0.25 0.114 44.031 共60 GPa兲 O共1兲 0.358 0.25 0.427 O共2兲 0.026 0.75 0.337 Expt 共Ref. 5兲 5.163 2.989 5.966 90.0 Ti 0.264 0.25 0.110 46.034 共61 GPa兲 O共1兲 0.346 0.25 0.422 O共2兲 0.012 0.75 0.325 Fluorite HF 4.794 4.794 4.794 90.0 O 0.25 0.25 0.25 55.089 LDA 4.748 4.748 4.748 90.0 O 0.25 0.25 0.25 54.745 GGA 4.897 4.897 4.897 90.0 O 0.25 0.25 0.25 58.706 LDA 共Ref. 30兲 4.860 4.860 4.860 90.0 O 0.25 0.25 0.25 57.397 LDA 共Ref. 13兲 4.800 4.800 4.800 90.0 O 0.25 0.25 0.25 55.296 Pyrite HF 4.860 4.860 4.860 90.0 O 0.338 0.338 0.338 57.396 LDA 4.801 4.801 4.801 90.0 O 0.340 0.340 0.340 55.314 GGA 4.894 4.894 4.894 90.0 O 0.338 0.338 0.338 58.592
There is an interesting trend for the HF approximation to overestimate the bulk modulus of low-pressure phases and to underestimate it in very high-pressure phases. In the case of rutile and anatase, HF theory tends to overestimate the bulk modulus by about 10%; it is overestimated by less than 5% for columbite; for baddeleyite, it is within the error bars of the experimental value; and is about 10 % lower than the experimental value for the cotunnite phase. One expects HF theory to overestimate bulk moduli in wide-band-gap insula-tors as the effect of electron correlation in these systems is to reduce effective ionic radii and to generate a weak additional binding term. Computed lattice constants thus tend to be somewhat larger than those observed and bulk moduli rather high. This is the opposite behavior to that expected in small-band-gap semiconductors, where correlation effects are dominated by the mixing of excited-state determinants with the HF ground state. It may be that the trend in the predicted bulk modulus in TiO2 with pressure is related to the closure
of the band gap in the higher pressure phases.
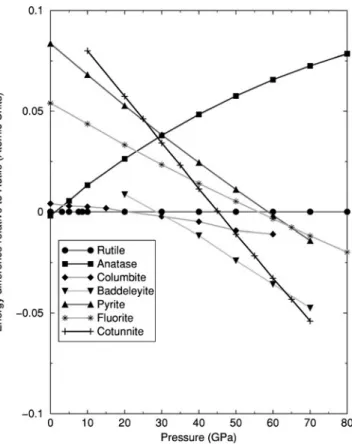
The computed equations of state of the phases studied here are illustrated in Figs. 4 and 5. The present calculations predict that anatase to columbite transformation occurs at about 3.5 GPa, while the rutile to columbite transformation occurs at about 21 GPa. This result is in reasonable agree-ment with experiagree-mental observations, correctly predicting that anatase will undergo a phase transformation at lower pressures than rutile. Columbite is the most stable phase up to 31 GPa where the calculations predict a transformation to baddeleyite which in turn transforms to cotunnite at 63 GPa.
At no point between 0 and 70 GPa is either the pyrite or fluorite phase predicted to be the most stable form, although the pyrite form is more stable than the fluorite structure up to 65 GPa. Extrapolation of the enthalpy versus pressure plots in Fig. 5 to higher pressures indicates that it is unlikely that pyrite or fluorite will become more stable than cotunnite at pressures below 100 GPa.
V. DISCUSSION
A number of general conclusions can be drawn from the large number of detailed calculations of the structure and energetics of TiO2 polymorphs presented above. First, the
HF and GGA treatments of exchange and correlation tend to overestimate the cell volume, whereas the LDA tends to un-derestimate it. For HF theory this is related to the neglect of electron correlation, which results in an overestimate of the cell volume for wide-band-gap insulators, as discussed above. The LDA has a tendency to overbind molecules and solids, and in general underestimates cell volumes in these systems. The GGA overcorrects for this effect and, in these systems, yields cell volumes similar to those computed in the HF approximation.
The form of the basis set 共PW or LCAO兲 has little influ-ence on these structural trends as long as the total energy is reasonably well converged with respect to the basis set, and an all-electron approach or small-core pseudopotentials are used. Improving the LCAO basis sets from TVAE* to TVAE** or increasing the plane-wave cutoff from 340 to 600 eV has little effect on the predicted structures. However,
FIG. 4. The internal energy 共in atomic units for two TiO2
for-mula units兲 with respect to volume for the TiO2polymorphs
calcu-lated within the HF approximation using the TVAE* basis set.
FIG. 5. The enthalpy difference, relative to rutile, for two TiO2
the calculation of the relative phase stability is sensitive to numerical and theoretical approximations, and great care is required when comparing two phases with very similar en-ergies such as rutile and anatase at 0 GPa. The energy dif-ferences are only converged with the largest basis sets used here. Clearly, errors due to the numerical approximations may influence the predicted pressures of phase transforma-tions. This effect can be estimated. The data in Table III indicate that the improvement of the basis set can lead to a difference of the relative phase stability of up to 2 kJ/mol. An error of such magnitude has a small effect on the computed transformation pressure where the gradient of the pressure versus enthalpy data of two phases differs significantly, as in the case of columbite and baddeleyite where this leads to an error of around ⫾2 GPa 共see Fig. 5兲. However, for phases with very similar gradients, such as rutile and columbite, the error can be as large as ⫾6 GPa. Thus the pressures of transformation predicted here may be somewhat different to those observed, but the sequence of the phase transforma-tions is unlikely to be affected by these numerical errors.
The variation in elastic properties and the anisotropic compression of the different phases can be understood by considering the atomic structure of these phases and in par-ticular the packing of the TiO6 octahedra. These octahedra
are fairly rigid units which appear to behave in a rather con-sistent way in the rutile, anatase and columbite phases 共see Fig. 9兲. However, their packing differs considerably.
In the rutile unit cell, the TiO6octahedra pack in a regular
arrangement with the neighboring octahedra sharing corners in the ab planes and edges in the c direction as depicted in Fig. 6. The corner-sharing octahedra have one Ti-O bond linking them, whereas edge-sharing octahedra share two Ti-O bonds. The crystal is thus more compressible in theab plane where external stress can be taken up by the hinging of the octahedra than in the c direction which is supported by
relatively inflexible ‘‘pillars’’ of edge-sharing octahedra. In anatase, there are crossed rows of zigzagging octahedra that run along the a and b lattice vectors 共see Fig. 7兲. The octahedra share four edges but the edges that are shared do not lie on opposite ends of the octahedron as they do in rutile. This has implications for the compressibility of the structure because compression can be accommodated by the octahedra hinging over each other more easily than in the rutile structure. This results in the computed bulk modulus of anatase being significantly lower than that of rutile.
Using similar simple models of the structure of these phases, the pressure-induced phase transformations of ana-tase and rutile to columbite can be understood by considering the nature of the electrostatic interactions of the ions in each structure. The energetics of the crystal are finely balanced between bringing as many oppositely charged ions as close together as possible while keeping like-charged ions as far apart as possible. Hence the lowest-energy structure is that which minimizes the cation-cation 共Ti-Ti兲 and anion-anion 共O-O兲 repulsions while maximizing the cation-anion attrac-tion 共Ti-O兲.
As noted in Sec. II, the rutile, anatase, and columbite structures are all built up from different arrangements of TiO6 octahedra. The biggest difference between the
octahe-dral packing in rutile and in columbite, illustrated in Fig. 8, is that the octahedra in rutile form linear chains along the c direction whereas in columbite, they form zigzagging chains.38 In the case of rutile and anatase, the nearest Ti-Ti
and O-O bond distances are shorter than in columbite, but the average octahedral Ti-O bond distances and octahedral volumes are similar 共see Fig. 9兲. Compression of rutile and anatase leads to a reduction in the Ti-Ti and O-O bond dis-tances. This reduction in bond distances can be compensated for by rearranging the octahedra and transforming to a columbite structure.
FIG. 6. The packing of TiO6octahedra in rutile.
FIG. 7. The packing of TiO6octahedra in anatase. The smaller
image is a rotated view showing the zigzag arrangement of the octahedra along thea direction.
Furthermore, the internal coordinate of the Ti ion in columbite can move along the y Cartesian direction 共corre-sponding to moving along theb lattice vector兲 but in rutile, it is fixed by symmetry. This degree of freedom results in a
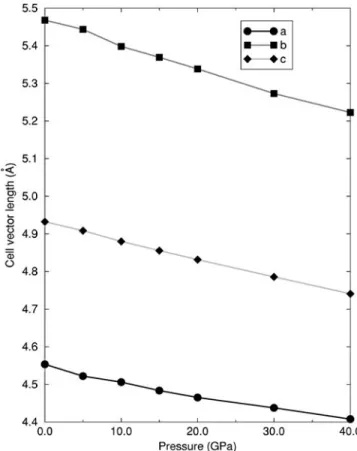
significantly larger Ti-Ti distance 共see Fig. 10兲 than would occur if the material was in the rutile phase or if this coor-dinate was fixed. This feature of the packing also explains the anisotropic compressibility of columbite TiO2. The
change in the unit cell parameters for a range of pressures is illustrated in Fig. 11. By far the most compressible direction is along theb lattice vector due to the freedom of the Ti ions to move along this direction. The c direction is also rather compressible because the octahedra can slide over each other somewhat due to the movement of the cations along the b direction. Finally, the a direction is the least compressible despite having only corner-sharing octahedra along it. The freedom of movement of the octahedra along the b and c directions is not evident alonga, and hence this direction is the stiffest. The order of compressibility along each lattice vector is in excellent agreement with experimental observations.21
Finally, the post-columbite phase transformations can also be rationalized using simple models concerning the effect of pressure on the ionic size. The phase transformation from columbite to baddeleyite and cotunnite structures is probably due to changes in the radius ratio of the Ti and O ions. Oxygen ions are significantly more compressible than Ti ions and at high pressures, the radius-ratio of these two species changes such that it is possible to pack more anions around
FIG. 8. The packing of TiO6 octahedra in columbite. The
smaller image is a rotated view illustrating the packing of octahedra along thec direction.
FIG. 9. The change in Ti-Ti, O-O, Ti-O, and TiO6octahedron volumes with pressure for rutile,
anatase, and columbite structured TiO2computed within the HF approximation.
each cation hence increasing the Ti-O attraction interaction. This leads to an increase in the coordination of Ti-O ions from six 共rutile, anatase, and columbite兲 to seven 共baddeley-ite兲 and then to nine 共cotunn共baddeley-ite兲.
VI. CONCLUSIONS
In the current study, we have investigated the structure, elastic properties, and stability of all the main known TiO2
polymorphs. In addition, we have confirmed the existence of a high-pressure phase recently been observed to be stable above 60 GPa.
Particular care has been taken to compute the relative sta-bility of rutile and anatase. The most precise calculations in the present study predict that anatase is more stable than rutile at 0 K, but the energy difference between the two phases is small: between 2 and 10 kJ/mol. Previous experi-mental determinations of the stability of rutile and anatase have not conclusively resolved which phase is more stable at low temperatures and, clearly, further experimental work is required.
The computed cell parameters for the experimentally well-studied phases agree to within 2%. The bulk moduli generally agree with experiment to within 10%, although the direction of the error depends on the individual phase: for low-pressure phases, the calculations tend to overestimate the bulk modulus with respect to experiment, whereas for the very high-pressure phases the computed bulk moduli are too low. HF theory tends to predict a higher bulk modulus than
the LDA. A more significant difference in the predicted bulk modulus is seen when comparing that computed using a polynomial fit to the variation of the energy with respect to volume and that obtained by fitting to an equation of state. Here the latter approach is adopted as this is consistent with the approach used in most experimental determinations.
For a number of phases, in particular rutile and anatase, a great deal of insight into their elastic properties can be ob-tained by considering the local packing of the Ti and O ions. For example, the larger, anisotropic compression of the longer cell parameter in rutile and anatase can be rationalized by considering the nature of the packing of the TiO6
octahe-dral units. The driving force behind the transformation of rutile and anatase to columbite can be understood by consid-ering the changes to the electrostatic interactions that occur as a result of differing cation, anion-anion, and cation-anion nearest-neighbor distances. Transformation to the columbite phase allows an increase in the O-O and Ti-Ti distances particularly due to the extra degree of freedom available for the position of the Ti ions.
The current calculations of the phase transformation of rutile and anatase to columbite correctly predict that anatase undergoes this phase transformation at a lower pressure than rutile. The anatase to columbite transformation is predicted to happen at about 3.5 GPa in reasonable agreement with experiment but the predicted pressure of rutile to columbite transformation is higher than that observed. This is mainly due to the difficulty in extracting the crossover point in the equations of state of the two phases which have very similar
FIG. 10. The nearest Ti-Ti distance in columbite TiO2with
in-creasing pressure where the Ti y coordinate is fixed 共constrained兲 to its 0-GPa value and when it is free to relax 共unconstrained兲.
FIG. 11. The a, b, and c cell parameters in columbite TiO2with increasing pressure.
gradients of the enthalpy versus pressure curves and are very sensitive to the computational parameters used to generate them. We estimate that the error bar in this particular predic-tion is of the order of 10 GPa. The columbite-to-baddeleyite transformation then occurs at 31 GPa, and the latter structure transforms to cotunnite at about 63 GPa. It is very satisfying to note that all the computed phase transformations are pre-dicted to occur in the same order as is seen experimentally and that the bulk modulus of TiO2 increases with each new
phase.
Finally, in this paper, we have demonstrated how the com-puted properties of bulk TiO2are influenced by the treatment
of exchange and correlation and the numerical approxima-tions 共such as the basis set and k-space sampling兲. The re-sults for rutile and anatase illustrate how the treatment of the exchange and correlation affects the computed lattice param-eters. Convergence of the basis set, irrespective of its func-tional form, with respect to computed properties is essential for reliable comparisons between Hartree-Fock and density functional theory results. Reliable structures can be calcu-lated with rather small basis sets but more sophisticated basis
sets incorporating d-polarization functions on the oxygen ions are necessary to produce accurate lattice parameters for anatase. When the basis set is converged, the HF method and the GGA to DFT theory tend to overestimate cell volumes, whereas the LDA to DFT method underestimates volumes. Other numerical approximations such as the sampling of k space and the truncation of the Coulomb and exchange series have a very small effect on the predicted structures. Modest numerical accuracy is required to converge computed struc-tures, but calculations of the total energies and energy differ-ences between different phases require more sophisticated basis sets with high numerical accuracy.
ACKNOWLEDGMENTS
J.M. would like to thank the EPSRC for funding part of this work during his Ph.D. studies. He would also like to acknowledge useful discussions with Jose Mirao 共University of Evora, Portugal兲 and Philip Lindan 共University of Canter-bury, UK兲. All images of the TiO2 phases were produced
using the DL-Visualise software package 共Refs. 87 and 88兲.
1V. E. Henrich and A. F. Cox, The Surface Science of Metal Oxides
共Cambridge University Press, Cambridge, 1993兲.
2A. Fujishima and K. Honda, Nature 共London兲 238, 37 共1972兲. 3G. L. Haller and D. E. Resasco, Adv. Catal.36, 173 共1989兲. 4New Sci.10, 11 共1998兲.
5L. S. Dubrovinsky, N. A. Dubrovinskaia, V. Swamy, J. Muscat, N.
M. Harrison, R. Ahuja, B. Holm, and B. Johansson, Nature 共London兲 410, 653 共2001兲.
6T. Mitsuhashi and O. J. Kleppa, J. Am. Chem. Soc. 62, 356
共1979兲.
7J. L. Margrave and B. D. Kybett, Tech. Rept. AFMO-TR, 1965,
p. 65.
8A. Navrotsky and O. J. Kleppa, J. Am. Ceram. Soc. 50, 626
共1967兲.
9C. N. R. Rao, Can. J. Chem.39, 498 共1961兲.
10R. A. Robie and D. R. Waldbaum, U. S. Geol. Surv. Bull.1259,
146 共1966兲.
11A. Fahmi, C. Minot, B. Silvi, and M. Causa`, Phys. Rev. B 47,
11 717 共1993兲.
12M. Causa` and A. Zupan, Chem. Phys. Lett.220, 145 共1994兲. 13 V. Milman, Properties of Complex Inorganic Solids 共Plenum
Press, New York, 1997兲.
14M. Mikami, S. Nakamura, O. Kitao, H. Arakawa, and X. Gonze,
Jpn. J. Appl. Phys.39, 847 共2000兲.
15N. A. Bendeliani, S. V. Popova, and L. F. Vereshchagin,
Geochem. Int.3, 387 共1966兲.
16R. G. McQueen, J. C. Jamieson, and S. P. Marsh, Science155,
1401 共1967兲.
17J. F. Mammone, S. K. Sharma, and M. Nicol, Solid State
Com-mun.34, 799 共1980兲.
18J. F. Mammone, M. Nicol, and S. K. Sharma, J. Phys. Chem.
Solids42, 379 共1981兲.
19H. Arashi, J. Phys. Chem. Solids53, 355 共1992兲. 20L. Liu and T. P. Mernagh, Eur. J. Mineral.4, 45 共1992兲.
21J. Haines and J. M. Le`ger, Physica B192, 233 共1993兲.
22K. Lagarec and S. Desgreniers, Solid State Commun. 94, 519
共1995兲.
23L. Gerward and J. S. Olsen, J. Appl. Crystallogr.30, 259 共1997兲. 24J. Staun Olsen, J. Z. Jiang, and L. Gerward, J. Phys. Chem. Solids
60, 229 共1999兲.
25T. Arlt, M. Bermejo, M. A. Blanco, L. Gerward, J. Z. Jiang, J.
Staun Olsen, and J. M. Recio, Phys. Rev. B61, 14 414 共2000兲. 26H. Sato, S. Endo, M. Sugiyama, T. Kikegawa, O. Shimomura, and
K. Kusaba, Science251, 786 共1991兲.
27I. E. Grey, C. Li, and I. C. Madsen, Mater. Res. Bull.23, 743
共1988兲.
28S. Endo, I. Takenaka, and H. Arashi, AIRAPT Conf. Proc.309,
371 共1979兲.
29Y. Syono, K. Kusaba, M. Kikuchi, and K. Fukuoka, Geophys.
Monogr.39, 385 共1987兲.
30J. K. Dewhurst and J. E. Lowther, Phys. Rev. B54, 3673 共1996兲. 31J. Muscat, Ph.D. thesis, University of Manchester, Manchester,
1999.
32C. R. A. Catlow and R. James, Proc. R. Soc. London, Ser. A384,
157 共1982兲.
33V. Swamy, J. D. Gale, and L. S. Dubrovinsky, J. Phys. Chem.
Solids62, 887 共2001兲.
34R. Wyckoff, Crystal Structures, 2nd ed. 共Interscience, New York,
1964兲, Vol. 1.
35K. V. K. Rao, S. V. N. Naidu, and L. Iyengar, J. Am. Ceram. Soc. 53, 124 共1970兲.
36C. J. Howard, T. M. Sabine, and F. Dickson, Acta Crystallogr.,
Sect. B: Struct. Sci.47, 462 共1991兲.
37J. K. Burdett, T. Hughbanks, G. J. Miller, J. W. Richardson, and J.
V. Smith, J. Am. Chem. Soc.109, 3639 共1987兲.
38B.G. Hyde and S. Andersson, Inorganic Crystal Structures
共Wiley, New York, 1989兲.
40R. Dovesi, V. R. Saunders, C. Roetti, M. Causa`, N. M. Harrison,
R. Orlando, and E. Apra`, CRYSTAL98 User’s Manual 共Univer-sity of Turin, Turin, 1996兲.
41M. C. Payne, M. P. Teter, D. C. Allan, T. A. Arias, and J. D.
Joannopoulos, CASTEP 4.2 Academic version, licensed under the UKCP-MSI Agreement 关Rev. Mod. Phys. 64, 1045 共1992兲兴.
42P. A. M. Dirac, Proc. Cambridge Philos. Soc.26, 376 共1930兲. 43J. P. Perdew and A. Zunger, Phys. Rev. B23, 5048 共1981兲. 44J. P. Perdew, K. Burke, and M. Ernzerhof, ACS Symp. Ser.629,
453 共1996兲.
45W. C. Mackrodt, E. A. Simpson, and N. M. Harrison, Surf. Sci. 384, 192 共1997兲.
46J. Muscat, N. M. Harrison, and G. Thornton, Phys. Rev. B59,
15 457 共1999兲.
47http://www.dl.ac.uk/TCS/Software/CRYSTAL/共The CRYSTAL
Basis set library, 1998兲.
48J. Muscat, N. M. Harrison, and G. Thornton, Phys. Rev. B59,
2320 共1999兲.
49J. Muscat and N. M. Harrison, Surf. Sci.446, 119 共2000兲. 50N. M. Harrison, X.-G. Wang, J. Muscat, and M. Scheffler,
Fara-day Discuss.114, 305 共1999兲.
51J. D. Pack and H. J. Monkhorst, Phys. Rev. B16, 1748 共1977兲. 52C. Pisani, R. Dovesi and C. Roetti, Hartree-Fock Ab Initio
Treat-ment of Crystalline Systems 共Springer-Verlag, Berlin, 1988兲, Vol.
48.
53C. Zhu, R. H. Byrd, P. LU, and J. Nocedal, L-BFGS-B - Fortran
Subroutines for Large Scale Bound Constrained Optimisation
共Dept of Elec. Eng. and Comp. Sci, Northwestern University, Illinois, 1994兲.
54D. Vanderbilt, Phys. Rev. B41, 7892 共1990兲.
55H. J. Monkhorst and J. D. Pack, Phys. Rev. B13, 5188 共1976兲. 56N. Funamori, T. Yagi, and T. Uchida, Geophys. Res. Lett.23, 953
共1996兲.
57B. Silvi, N. Fourati, R. Nada, and C. R. A. Catlow, J. Phys. Chem.
Solids52, 1005 共1991兲.
58P. Reinhardt and B. A. Hess, Phys. Rev. B50, 12 015 共1994兲. 59K. M. Glassford and J. R. Chelikowsky, Phys. Rev. B46, 1284
共1992兲.
60C. Lee, P. Ghosez, and X. Gonze, Phys. Rev. B50, 13 379 共1994兲. 61M. Ramamoorthy, D. Vanderbilt, and R. D. King-Smith, Phys.
Rev. B49, 16 721 共1994兲.
62P. J. D. Lindan, N. M. Harrison, J. M. Holender, M. J. Gillan, and
M. C. Payne, Surf. Sci.364, 431 共1996兲.
63P. Reinhardt, B. A. Hess, and M. Causa`, Int. J. Quantum Chem. 58, 297 共1996兲.
64P. J. D. Lindan, N. M. Harrison, M. J. Gillan, and J. A. White,
Phys. Rev. B55, 15 919 共1997兲.
65K. Rosciszewski, K. Doll, B. Paulus, P. Fulde, and H. Stoll, Phys.
Rev. B57, 14 667 共1998兲.
66S. D. Mo and W. Y. Ching, Phys. Rev. B51, 13 023 共1995兲. 67S. H. Vosko, L. Wilk, and M. Nusair, Can. J. Phys. 58, 1200
共1980兲.
68U. von Barth and L. Hedin, J. Phys. C5, 1629 共1972兲. 69J. P. Perdew and Y. Wang, Phys. Rev. B33, 8800 共1986兲. 70J. P. Perdew and Y. Wang, Phys. Rev. B40, 3399 共1989兲. 71J. P. Perdew and Y. Wang, Phys. Rev. B45, 13 244 共1992兲. 72R. Colle and O. Salvetti, J. Chem. Phys.93, 534 共1990兲. 73L. C. Wilson and M. Levy, Phys. Rev. B41, 12 930 共1990兲. 74J. P. Perdew, Phys. Rev. B33, 8822 共1986兲.
75J. P. Perdew, Electronic Structure of Solids 1991 共Akademie
Ver-lag, Berlin, 1991兲.
76A. D. Becke, J. Chem. Phys.88, 1053 共1988兲.
77C. Lee, W. Yang, and R. G. Parr, Phys. Rev. B37, 785 共1988兲. 78L. C. Ming and M. H. Manghnani, J. Geophys. Res.84, 4777
共1979兲.
79M. H. Manghnami, J. Geophys. Res.74, 4317 共1969兲. 80I. J. Fritz, J. Phys. Chem. Solids35, 817 共1974兲.
81D. G. Isaak, J. D. Carnes, O. L. Anderson, H. Cynn, and E. Hake,
Phys. Chem. Miner.26, 31 共1998兲.
82V. Swamy and L. S. Dubrovinsky, J. Phys. Chem. Solids62, 673
共2001兲.
83Y. Kudoh and H. Takeda, Physica B & C139-140, 333 共1986兲. 84T. Sekiya, S. Ohta, S. Kamei, M. Hanakawa, and S. Kurita, J.
Phys. Chem. Solids62, 717 共2001兲.
85M. Akaogi, K. Kusaba, J. Susaki, T. Yagi, M. Matsui, T.
Kikegawa, H. Yusa and E. Ito, High-Pressure Research:
Appli-cation to Earth and Planetary Sciences 共Terra Scientific
Publish-ing Company/American Geophysical Union, Tokyo, 1993兲.
86N. Wilson and J. Muscat 共unpublished兲.
87B. G. Searle, The DL-Visualise Software package 共http://
www.cse.clrc.ac.uk/Activity/DLV/, 2001兲.