More symmetrical gait after split-belt treadmill walking does not modify dynamic and postural balance in individuals post-stroke.
Carole Miéville., Séléna Lauzière, Martina Betschart, Sylvie Nadeau, Cyril Duclos
AFFILIATIONS:
1. Centre for Interdisciplinary Research in Rehabilitation of Greater Montreal, CIUSSS 5
Centre-Sud-de-l’Île-de-Montréal, Montreal, Canada.
2. School of Rehabilitation, Université de Montréal, Montreal, Canada. Author for correspondence:
Cyril Duclos, School of Rehabilitation, Université de Montréal, P.O. Box 6128, Station Centre-Ville, Montreal, Quebec, Canada, H3C 3J7 Tel: +1-514-340-2111, extension 3048
10
ABSTRACT 15
Spontaneous gait is often asymmetrical in individuals post-stroke, despite their ability to walk more symmetrically on demand. Given the sensorimotor deficits in the paretic limb, this asymmetrical gait may facilitate balance maintenance. We used a split-belt walking protocol to alter gait asymmetry and determine the effects on dynamic and postural balance. Twenty individuals post-stroke walked on a split-belt treadmill. In two separate periods, the effects of 20
walking with the non-paretic leg, and then the paretic one, on the faster belt on spatio-temporal symmetry and balance were compared before and after these perturbation periods. Kinematic and kinetic data were collected using a motion analysis system and an instrumented treadmill to determine symmetry ratios of spatiotemporal parameters and dynamic and postural balance. Balance, quantified by the concepts of stabilizing and destabilizing forces, was compared before 25
and after split-belt walking for subgroups of participants who improved and worsened their symmetry. The side on the slow belt during split-belt walking, but not the changes in asymmetry, affected balance. Difficulty in maintaining balance was higher during stance phase of the leg that was on the slow belt and lower on the contralateral side after split-belt walking, mostly because the center of pressure was closer (higher difficulty) or further (lower difficulty) from the limit of 30
the base of support, respectively. Changes in spatiotemporal parameters may be sought without additional alteration of balance during gait post-stroke.
INTRODUCTION
Individuals post-stroke have activity limitations related to various locomotor 35
impairments, such as reduced walking speed (Balaban & Tok, 2014; Richards et al., 2015), asymmetrical gait pattern (Balaban et al., 2014; Patterson et al., 2008), and static (Tasseel-Ponche et al., 2015) and dynamic balance deficits (Kao et al., 2014; Nott et al., 2014). Post-stroke gait is less stable during the paretic stance phase as revealed by the alteration of the displacements of the centre of pressure under the paretic foot (Chisholm et al., 2011) or the 40
increased angular momentum in the frontal plane during paretic stance phase (Nott et al., 2014). Although variable among individuals post-stroke, balance deficits could explain in part their reduced gait speed and increased fall risk (Weerdesteyn et al., 2008).
Asymmetry of spatiotemporal (ST) gait parameters (e.g. step length, stance time and swing time) has also been shown to be related to reduced gait speed (Patterson et al., 2010), 45
decreased standing balance (Hendrickson et al., 2014) and clinical scores of balance assessment (Lewek et al., 2014). This raises the question whether asymmetrical gait may facilitate balance compared to a more symmetrical gait, in part because of the sensorimotor deficits at the paretic lower-limb.
Asymmetry in step length (SL) and double support time (DST) can be reduced by using a 50
split-belt treadmill protocol in individuals post-stroke (Lauziere et al., 2014; Reisman et al., 2007). Split-belt walking requires a reorganization of the locomotor pattern shown by the alteration of most ST parameters. Following several minutes of perturbation at unequal speeds, changes in SL and DST are maintained for some cycles once the belts return to equal speeds, contrary to other parameters, such as stance time, that immediately come back to
pre-55
perturbation values. This protocol improved SL symmetry when the faster belt was used on the side with shorter SL during split-belt walking after stroke. It also changed the generation of moments at the ankle, with higher plantarflexion moments on the slow belt, and lower moments on the fast belt in post-perturbation (Lauziere et al., 2014). Currently, we do not know whether the changes in SL symmetry and joint moments observed after split-belt walking affect balance. 60
Since these changes influence foot placement and base of support (BoS) configuration in anteroposterior direction (Balasubramanian et al., 2010; Hak et al., 2013), one can expect an impact on dynamic balance, because balance control is determined by foot placement and the position of the center of mass (CoM) relative to the feet (Winter, 1995). Moreover, foot
placement allows the control of the position of the center of pressure (CoP) and the CoP position 65
relative to the CoM controls the CoM accelerations, i.e. the further apart the CoP and the CoM, the larger the acceleration of the CoM (Winter, 1995). Thus, alteration of the symmetry of the ST parameters likely affects balance during gait in individuals post-stroke. Understanding how changes in the symmetry of gait affect balance is important to better support the use of split-belt training, and more generally of interventions to improve symmetry in walking post-stroke. 70
The first objective of the study was therefore to determine the effect of changes in ST symmetry, induced after split-belt walking, on the difficulty in maintaining balance in
individuals post-stroke. It was assumed that dynamic and postural balance would be more difficult to maintain when these individuals walked more symmetrically, which could be one factor explaining why an asymmetrical gait pattern is spontaneously used instead of a more 75
than non-paretic stance phase, and because the effects of split belt on moment generation and asymmetry differ according to which leg is placed on the faster belt during perturbation (Lauziere et al., 2014), a second objective was to identify which of the split-belt treadmill conditions, i.e. the non-paretic or paretic leg on the fast belt, most affects dynamic and postural 80
balance.
METHODS
Participants
Twenty participants (mean age: 49.4 years, standard deviation (SD): 13.2; 13 men) who 85
had their first unilateral supratentorial stroke (14 right-side lesion) more than 6 months ago (mean: 84.4 months, SD: 93.1) were recruited in this study. They were included if they were able to walk independently 10 meters overground at a gait speed 0.5 m/s without assistive devices or physical assistance. They were excluded if they had a cerebellum lesion or any cognitive or medical conditions that could affect their locomotor ability. All participants signed a consent 90
form approved by the local ethics committee.
Clinical assessment
Participants’ self-selected and maximal overground gait speed, functional mobility, balance, and leg/foot motor recovery were evaluated using the 10-meter walk test (Salbach et al., 2001), the Timed Up and Go test (Ng & Hui-Chan, 2005), the Berg Balance Scale (Berg et al., 95
1995) and the Chedoke McMaster Stroke Assessment (Gowland et al., 1993), respectively. To determine self-selected speed on the treadmill, the participants walked with the speed increasing by 0.1 m/s every 45 seconds, until the speed was deemed uncomfortable by the participant. The prior speed was considered the treadmill self-selected speed for this participant.
Experimental protocol
100
The participants walked on the split-belt treadmill following a previously used protocol (Lauziere et al., 2014): 1) baseline, tied belt at self-selected speed, for 3 minutes; 2) perturbation, split belt with the slow belt at self-selected speed and the fast belt at double the self-selected speed, for 6 minutes; and 3) post-perturbation, tied belt at self-selected speed for 3 minutes (idem as baseline). They experienced this protocol twice, first with the non-paretic leg on the fast belt 105
(NP Fast condition), then with the paretic leg on the fast belt (P Fast condition) with 10 minutes of rest between protocols. During all periods, for safety reasons, participants wore a harness that did not provide weight support. Participants held side-mounted handrails only during the
perturbation period. Fifteen consecutive gait cycles were analyzed from the baseline period and at the beginning of the post-perturbation period, i.e. immediately after the perturbation period 110
ended and the participant released the handrail (in the first cycle post-perturbation).
Data collection
A 3D whole-body motion analysis system, i.e. four Optotrak Certus cameras (Northern Digital Inc., Waterloo, ON, Canada) and three to six infrared markers placed on each body segment, was used to estimate body CoM kinematics. The contour of the BoS was determined by 115
the foot contours digitized relative to the foot markers. The instrumented split-belt treadmill (Bertec Fully Instrumented Treadmill (FIT®)) recorded ground reaction forces and the global CoP at a frequency of 600 Hz and these signals were re-sampled at 60 Hz to match the kinematic data. Kinematic and kinetic data were used to quantify difficulty in maintaining balance by using the concepts of stabilizing and destabilizing forces (Duclos et al., 2009; Duclos et al., 2012). 120
The stabilizing force represents the dynamic component, i.e. the theoretical force needed to stop the body movement (CoM velocity) at the limit of the BoS, while the destabilizing force represents the postural component, i.e. the theoretical force needed to bring the CoP to the limit of the BoS. Higher stabilizing force (i.e. higher CoM velocity or shorter CoP-BoS distance) and lower destabilizing force (i.e. lower weight, higher CoM or shorter CoP-BoS distance) indicate 125
greater difficulty in maintaining balance during the task (Duclos et al., 2009; Duclos et al., 2012). This model is sensitive to reduced proprioceptive integration in balance control during walking in individuals post-stroke (Mullie & Duclos, 2014) and changes in difficulty level of balance perturbations in healthy participants (Ilmane et al., 2015). It was also used to show that individuals with spinal cord injury reduced their walking speed to ensure their balance when 130
walking overground (Lemay et al., 2014) or on an inclined pathway (Desrosiers et al., 2015). One variable included in the calculation of both forces is the distance between the CoP and the BoS (CoP-BoS distance) in the direction of CoM velocity (Duclos et al., 2012). It represents the distance available to generate a postural reaction and is not included in other tools to evaluate balance such as the extrapolated center of mass (Hof et al., 2005). Another variable included in 135
the stabilizing force is the CoM velocity (Duclos et al., 2009). These variables (CoP-BoS distance and CoM velocity) were analyzed separately in addition to the stabilizing and destabilizing forces to further understand the determinants of balance difficulty. Peak values (maximum for stabilizing force, and minimum for destabilizing force) obtained during paretic and non-paretic stance phases of the gait cycle were used because they indicate the highest level 140
of difficulty in managing balance during the stance phase (Duclos et al., 2009). Peak values were normalized to the body mass for the stabilizing and destabilizing forces.
Temporal (DST, swing and stance times) and spatial (SL, trunk progression and foot forward placement (Roerdink & Beek, 2011)) parameters were obtained using the vertical ground reaction forces and kinematics of the feet and pelvis. The paretic DST was defined as the 145
time between non-paretic foot contact and subsequent paretic toe-off, and reciprocally for the non-paretic DST. The paretic swing time (SwT) was the time between the paretic toe-off and the subsequent paretic heel contact, while the paretic stance time (StT) was the time between the paretic foot contact and the subsequent paretic toe-off, and reciprocally for the non-paretic side. For the spatial parameters, the paretic/non-paretic SL was defined by the anteroposterior distance 150
of the markers on the paretic and non-paretic lateral malleoli at paretic/non-paretic foot contact. Given the variation of the asymmetry of the SL, the model suggested by Roerdink et al. (2011) for measuring the SL symmetry taking into account the trunk progression (TP) and forward foot placement (FFP) brings additional features to understand the spatial asymmetry during gait in individuals post-stroke. The paretic/non-paretic TP corresponded to the anteroposterior distance 155
traveled by the pelvis marker during the paretic/non-paretic stance. The paretic FFP relative to the trunk was defined as the anteroposterior distance between the marker on the paretic lateral malleolus and pelvis markers at paretic foot contact and inversely for the non-paretic side.
Symmetry ratios (high/low) of ST parameters during tied-belt periods, at baseline and during the post-perturbation period (i.e. before and after the split-belt period) were compared to 160
determine changes in ST asymmetry. A ratio of 1 means symmetry (see Table 1 for baseline asymmetry data). Changes in symmetry were considered when the change was larger than 10% between baseline and post-perturbation values. Because the preliminary analysis showed inconsistent effects of each condition on the symmetry for each ST parameter between
individuals (see first part of the results for a description of individual effects), two approaches 165
were used to analyze the changes in symmetry. First, each ST parameter was analyzed separately to determine the specific effect of the improvement/deterioration of symmetry on balance
difficulty; then the overall symmetry was analyzed because symmetry changed simultaneously in each parameter and the combination of these changes may have had a different effect on balance difficulty. The analysis for each ST parameter consisted in determining the proportion of
170
participants with increased or decreased stabilizing and destabilizing forces among the
participants who improved and deteriorated their symmetry ratios. For the overall symmetry, a global index of symmetry was calculated for each participant using the three temporal (DST, StT and SwT) and the three spatial (SL, TP, FFP) ratios described above. Each ratio was normalized over the range of its values; its relative mean expressed as a proportion of the total range, with 175
the normalized ratio distributed around it, before averaging all six ratios into a global index of symmetry for each participant and in each period (see Supplementary electronic file for details). Difference between global index at baseline and in post-perturbation period was calculated for each participant. Positive values indicate improvement in the ST asymmetry, zero no change, and negative values deterioration of the ST asymmetry. For each condition (NP Fast and P Fast), the 180
global index difference was used to subdivide the group into two subgroups; one showing improvement in ST asymmetry (index > 0) and a second showing a deterioration of ST asymmetry (index < 0). The changes in the balance variables were compared for each ST parameter for the whole group, and for the global index of symmetry in the subgroups to
determine the impact of change in asymmetry on balance control (first objective). In addition, we 185
also compared postural and dynamic balance during the paretic and non-paretic stance phases between NP Fast and P Fast conditions using the entire group of participants (second objective).
Statistical analysis
A Shapiro-Wilk test was used to test the distribution of balance variables, i.e. stabilizing and destabilizing forces, CoP-BoS distance and CoM velocity. Also, preliminary tests were run 190
and confirmed that ST parameters and balance data did not change within the 15
post-perturbation cycles considered for data analysis or between baseline periods of the two tested conditions (NP fast and P fast), by comparing cycles averaged five by five (1-5, 6-10 and 11-15) to each other or between the two baseline periods. To determine the effect of changes in
symmetry of each ST parameter on balance difficulty, binomial tests were used to compare the 195
proportion of participants with improved or deteriorated symmetry who increased or decreased the stabilizing and destabilizing forces, during paretic and non-paretic stance, between baseline and post-perturbation. Second, balance data of the two subgroups were compared at baseline and in post-perturbation period for the paretic and non-paretic stances using two-way repeated-measure ANOVA (sides x periods) with a between-group factor (improved vs. deteriorated 200
global index of symmetry) followed by t-tests in case of significant interactions. Changes in balance variables between groups were also compared with t-tests. These first analyses were conducted separately for the NP Fast and P Fast conditions. To determine the effects of the leg
placed on the fast belt (paretic or non-paretic leg) during the perturbation protocol on balance variables (second objective), comparisons between conditions were performed for the whole 205
group (n=20). Effect sizes (Cohen’s d) were also calculated to give the magnitude of the effects (Nakagawa & Cuthill, 2007). Values of effect size ranging from 0.20 to 0.50 represent a small effect, values ranging from 0.50 to 0.80 represent a moderate effect and values ≥ 0.80 represent a large effect. Level of significance was fixed at 0.05.
210
RESULTS
Participants
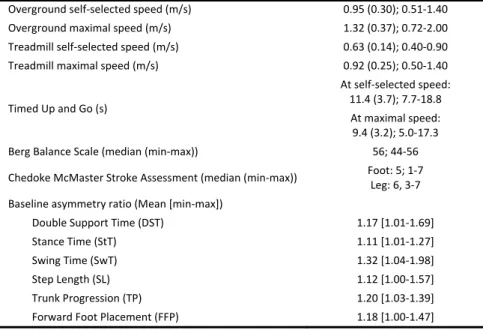
The participants had mild to severe motor or balance impairments. Their characteristics are presented in Table 1. Their average self-selected speeds were 0.95 m/s (SD: 0.30)
overground and 0.63 m/s (SD: 0.14) on the treadmill. 215
Table 1. Clinical status of 20 individuals post-stroke (mean (SD) and range values)
Overground self‐selected speed (m/s) 0.95 (0.30); 0.51‐1.40 Overground maximal speed (m/s) 1.32 (0.37); 0.72‐2.00 Treadmill self‐selected speed (m/s) 0.63 (0.14); 0.40‐0.90 Treadmill maximal speed (m/s) 0.92 (0.25); 0.50‐1.40 Timed Up and Go (s) At self‐selected speed: 11.4 (3.7); 7.7‐18.8 At maximal speed: 9.4 (3.2); 5.0‐17.3 Berg Balance Scale (median (min‐max)) 56; 44‐56 Chedoke McMaster Stroke Assessment (median (min‐max)) Foot: 5; 1‐7 Leg: 6, 3‐7 Baseline asymmetry ratio (Mean [min‐max]) Double Support Time (DST) 1.17 [1.01‐1.69] Stance Time (StT) 1.11 [1.01‐1.27] Swing Time (SwT) 1.32 [1.04‐1.98] Step Length (SL) 1.12 [1.00‐1.57] Trunk Progression (TP) 1.20 [1.03‐1.39] Forward Foot Placement (FFP) 1.18 [1.00‐1.47]
Specific changes in asymmetry of each ST parameter and balance
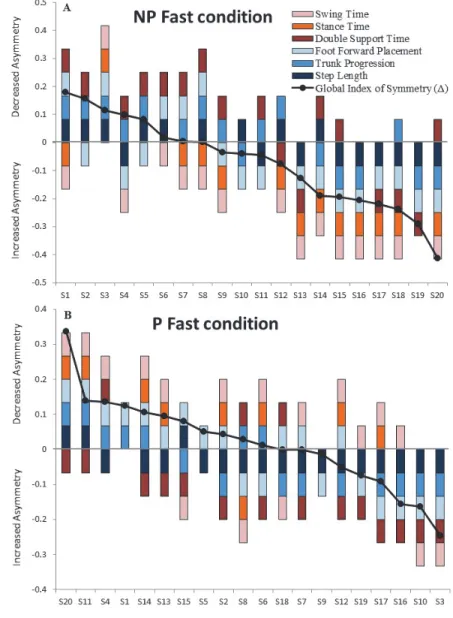
Changes in asymmetry of ST gait parameters in NP Fast (Fig. 1A) and P Fast (Fig. 1B) conditions by more than 10% are presented for each post-stroke participant (S1-S20). For both conditions, results revealed that not all parameters changed towards improved symmetry except 220
in one participant (S3 in the NP Fast condition (Fig. 1A)). 16/20 and 17/20 participants showed a reduced asymmetry of at least one ST parameter in NP Fast and P Fast conditions, respectively. Almost the same number of participants improved their symmetry in spatial parameters (cold-colour (blue tone) bars) as in temporal parameters (warm-(cold-colour (red tone) bars) in both conditions.
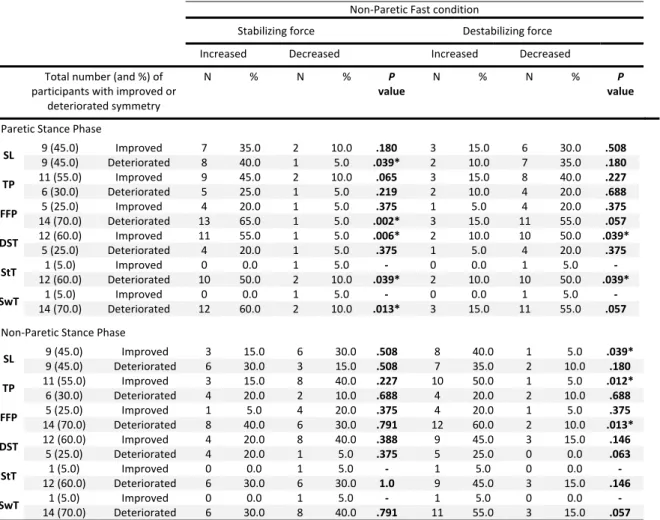
Balance difficulty increased more often on the side opposite to the foot that was previously on the fast belt when each ST parameter was analyzed separately. The stabilizing force increased and the destabilizing force decreased during the paretic stance phase (NP Fast condition, Table 2) or the non-paretic stance phase (P Fast condition, Table 3) in a larger
proportion of the participants, regardless of whether they improved or deteriorated the symmetry 230
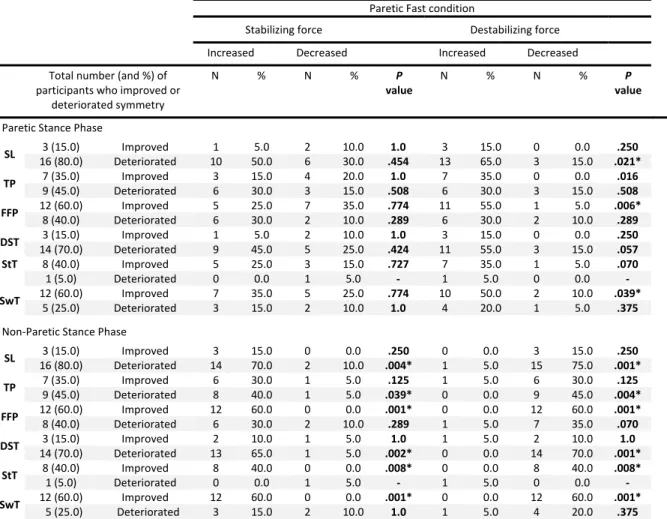
of the ST parameters considered separately. Also, balance difficulty decreased on the side that was previously on the fast belt speed, mostly for the destabilizing force that increased on that side in a larger proportion of participants in both experimental conditions (Tables 2 and 3).
Table 2: Number (and proportion in %) of participants showing increased/decreased destabilizing force 235
(columns) in individuals showing improved or deteriorated symmetry of spatiotemporal parameters (lines) in the Non-Paretic Fast condition
SL: Step Length, TP: Trunk Progression, FFP: Foot Forward Placement, DST: Double Stance Time, StT: Stance Time, SwT: Swing Time. Note that increased (decreased) stabilizing force and decreased (increased) destabilizing force indicate higher (lower) balance difficulty. * indicates P value <0.05 240 Non‐Paretic Fast condition Stabilizing force Destabilizing force
Increased Decreased Increased Decreased
Total number (and %) of participants with improved or deteriorated symmetry N % N % P value N % N % P value Paretic Stance Phase SL 9 (45.0) Improved 7 35.0 2 10.0 .180 3 15.0 6 30.0 .508 9 (45.0) Deteriorated 8 40.0 1 5.0 .039* 2 10.0 7 35.0 .180 TP 11 (55.0) Improved 9 45.0 2 10.0 .065 3 15.0 8 40.0 .227 6 (30.0) Deteriorated 5 25.0 1 5.0 .219 2 10.0 4 20.0 .688 FFP 5 (25.0) Improved 4 20.0 1 5.0 .375 1 5.0 4 20.0 .375 14 (70.0) Deteriorated 13 65.0 1 5.0 .002* 3 15.0 11 55.0 .057 DST 12 (60.0) Improved 11 55.0 1 5.0 .006* 2 10.0 10 50.0 .039* 5 (25.0) Deteriorated 4 20.0 1 5.0 .375 1 5.0 4 20.0 .375 StT 1 (5.0) Improved 0 0.0 1 5.0 ‐ 0 0.0 1 5.0 ‐ 12 (60.0) Deteriorated 10 50.0 2 10.0 .039* 2 10.0 10 50.0 .039* SwT 1 (5.0) Improved 0 0.0 1 5.0 ‐ 0 0.0 1 5.0 ‐ 14 (70.0) Deteriorated 12 60.0 2 10.0 .013* 3 15.0 11 55.0 .057 Non‐Paretic Stance Phase SL 9 (45.0) Improved 3 15.0 6 30.0 .508 8 40.0 1 5.0 .039* 9 (45.0) Deteriorated 6 30.0 3 15.0 .508 7 35.0 2 10.0 .180 TP 11 (55.0) Improved 3 15.0 8 40.0 .227 10 50.0 1 5.0 .012* 6 (30.0) Deteriorated 4 20.0 2 10.0 .688 4 20.0 2 10.0 .688 FFP 5 (25.0) Improved 1 5.0 4 20.0 .375 4 20.0 1 5.0 .375 14 (70.0) Deteriorated 8 40.0 6 30.0 .791 12 60.0 2 10.0 .013* DST 12 (60.0) Improved 4 20.0 8 40.0 .388 9 45.0 3 15.0 .146 5 (25.0) Deteriorated 4 20.0 1 5.0 .375 5 25.0 0 0.0 .063 StT 1 (5.0) Improved 0 0.0 1 5.0 ‐ 1 5.0 0 0.0 ‐ 12 (60.0) Deteriorated 6 30.0 6 30.0 1.0 9 45.0 3 15.0 .146 SwT 1 (5.0) Improved 0 0.0 1 5.0 ‐ 1 5.0 0 0.0 ‐ 14 (70.0) Deteriorated 6 30.0 8 40.0 .791 11 55.0 3 15.0 .057
Table 3: Number (proportion in %) of participants showing increased/decreased stabilizing or destabilizing force (columns) in individuals showing improved or deteriorated symmetry of 245
spatiotemporal parameters (lines) in the Paretic Fast condition
SL: Step Length, TP: Trunk Progression, FFP: Foot Forward Placement, DST: Double Stance Time, StT: Stance Time, SwT: Swing Time. Note that increased (decreased) stabilizing force and decreased (increased) destabilizing force indicate higher (lower) balance difficulty. * indicates P value <0.05 250 255 Paretic Fast condition Stabilizing force Destabilizing force
Increased Decreased Increased Decreased
Total number (and %) of participants who improved or deteriorated symmetry N % N % P value N % N % P value Paretic Stance Phase SL 3 (15.0) Improved 1 5.0 2 10.0 1.0 3 15.0 0 0.0 .250 16 (80.0) Deteriorated 10 50.0 6 30.0 .454 13 65.0 3 15.0 .021* TP 7 (35.0) Improved 3 15.0 4 20.0 1.0 7 35.0 0 0.0 .016 9 (45.0) Deteriorated 6 30.0 3 15.0 .508 6 30.0 3 15.0 .508 FFP 12 (60.0) Improved 5 25.0 7 35.0 .774 11 55.0 1 5.0 .006* 8 (40.0) Deteriorated 6 30.0 2 10.0 .289 6 30.0 2 10.0 .289 DST 3 (15.0) Improved 1 5.0 2 10.0 1.0 3 15.0 0 0.0 .250 14 (70.0) Deteriorated 9 45.0 5 25.0 .424 11 55.0 3 15.0 .057 StT 8 (40.0) Improved 5 25.0 3 15.0 .727 7 35.0 1 5.0 .070 1 (5.0) Deteriorated 0 0.0 1 5.0 ‐ 1 5.0 0 0.0 ‐ SwT 12 (60.0) Improved 7 35.0 5 25.0 .774 10 50.0 2 10.0 .039* 5 (25.0) Deteriorated 3 15.0 2 10.0 1.0 4 20.0 1 5.0 .375 Non‐Paretic Stance Phase SL 3 (15.0) Improved 3 15.0 0 0.0 .250 0 0.0 3 15.0 .250 16 (80.0) Deteriorated 14 70.0 2 10.0 .004* 1 5.0 15 75.0 .001* TP 7 (35.0) Improved 6 30.0 1 5.0 .125 1 5.0 6 30.0 .125 9 (45.0) Deteriorated 8 40.0 1 5.0 .039* 0 0.0 9 45.0 .004* FFP 12 (60.0) Improved 12 60.0 0 0.0 .001* 0 0.0 12 60.0 .001* 8 (40.0) Deteriorated 6 30.0 2 10.0 .289 1 5.0 7 35.0 .070 DST 3 (15.0) Improved 2 10.0 1 5.0 1.0 1 5.0 2 10.0 1.0 14 (70.0) Deteriorated 13 65.0 1 5.0 .002* 0 0.0 14 70.0 .001* StT 8 (40.0) Improved 8 40.0 0 0.0 .008* 0 0.0 8 40.0 .008* 1 (5.0) Deteriorated 0 0.0 1 5.0 ‐ 1 5.0 0 0.0 ‐ SwT 12 (60.0) Improved 12 60.0 0 0.0 .001* 0 0.0 12 60.0 .001* 5 (25.0) Deteriorated 3 15.0 2 10.0 1.0 1 5.0 4 20.0 .375
Changes in overall symmetry and balance (comparisons between subgroups)
For the overall symmetry, in the NP Fast condition, 8 participants improved their
symmetry, using the global index as reference, with mean changes of 0.08 (SD: 0.07; baseline vs. post: 0.47 vs. 0.39, P = 0.01) while the 12 participants who became more asymmetrical had mean changes of -0.17 (SD: 0.11; baseline vs. post: 0.30 vs. 0.47, P < 0.001) (Fig.1A). 260
Corresponding values for the P Fast condition were 0.10 (SD: 0.09 (N=11); 0.44 vs. 0.33, P = 0.003) and -0.09 (SD: 0.08; 0.28 vs. 0.36, P = 0.01), respectively (Fig.1B).
265
270
Fig. 1. Individual ratios of spatiotemporal gait parameters showing decreased or increased asymmetry for each post-stroke participant (S1-S20) in NP Fast (A) and P Fast (B) conditions. The participants are ordered based on the
275
difference in the global index of symmetry (Global index of symmetry (Δ), black dots) between baseline and post-perturbation periods: participants S1 to S8 became more symmetrical (positive Δ) and participants S9 to S20 became more asymmetrical (negative Δ) in post-perturbation in the NP Fast condition (A). Participants S20 to S6 became more symmetrical (positive Δ) and participants S18 to S3 became more asymmetrical (negative Δ) in post-perturbation in the P Fast condition (B).
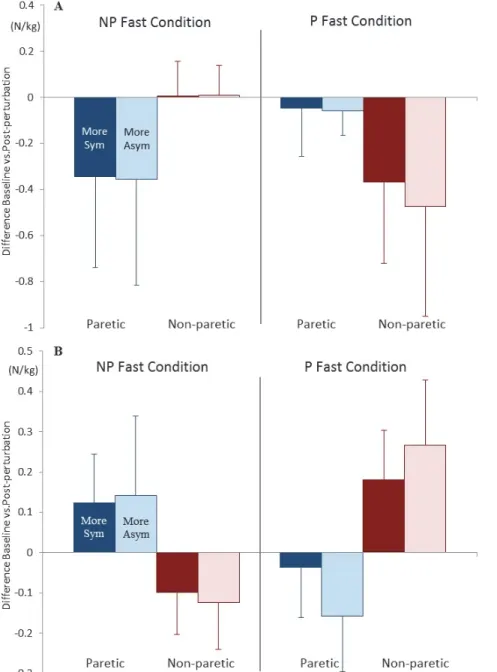
For both conditions, balance comparisons between baseline and post-perturbation periods did not reveal effects of subgroups, or any subgroup interaction with the side or period factors for the stabilizing and destabilizing forces, CoP-BoS distance and CoM velocity. Also,
differences between baseline and post-perturbation periods for the stabilizing and destabilizing forces were not significant between groups during paretic and non-paretic stance phases, for the 285
NP Fast and P Fast conditions (Figure 2). As both sub-groups showed similar changes in balance variables for sides and conditions, the effects of conditions, periods and sides were analyzed for the entire group of participants.
290
295
300
305
Fig. 2. Mean differences and ± 1 SD in stabilizing (A) and destabilizing (B) forces (baseline – post-perturbation) during the paretic (blue) and non-paretic (red) stance phases for the more symmetrical (dark colours) and more
310
asymmetrical (light colours) groups in the NP Fast (left panel) and P Fast (right panel) conditions. Negative values in the stabilizing force and positive values in the destabilizing force indicate increased difficulty in maintaining balance in the post-perturbation period. More Sym: more symmetrical group. More Asym: more asymmetrical group.
Condition effects on dynamic and postural balance
315
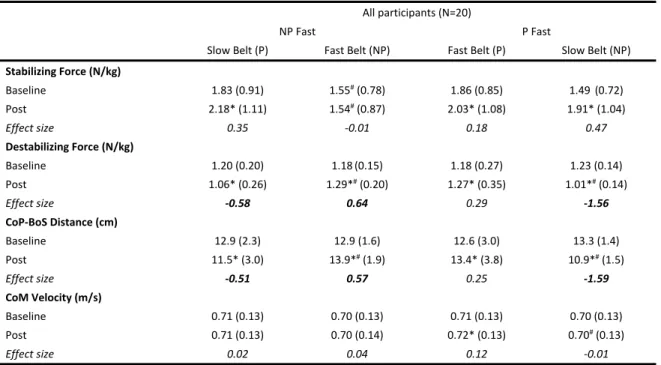
For the stabilizing force, values in post-perturbation period increased compared to baseline (NP and P Fast conditions: P = 0.001 and P < 0.001) except during the non-paretic stance phase in the NP Fast condition (P = 0.810) as also revealed by the very low effect size (effect size (ES) = -0.01) in comparison to the other effect sizes (ES) = 0.35, 0.18 and 0.47, respectively) (Table 4). The destabilizing force and CoP-BoS distance were lower in post-320
perturbation compared to baseline period for the paretic stance phase in the NP Fast condition (P = 0.002; ES = -0.58 and -0.51) and for the non-paretic stance phase in the P Fast condition (P < 0.001; ES = -1.56 and -1.59). The CoM velocity during the paretic stance phase increased in the post-perturbation period in the P Fast condition (P = 0.002; ES = 0.12). All these values indicate more difficulty in maintaining balance in the post-perturbation compared to baseline period 325
during stance phase of the leg that was previously on the slow belt except for the stabilizing force during paretic stance phase in the P Fast condition (Table 4).
Table 4. Mean (SD) peak values of stabilizing and destabilizing forces, CoM-BoS distance and CoM velocity in NP Fast and P Fast conditions during paretic and non-paretic stances for all participants
All participants (N=20)
NP Fast P Fast
Slow Belt (P) Fast Belt (NP) Fast Belt (P) Slow Belt (NP)
Stabilizing Force (N/kg) Baseline 1.83 (0.91) 1.55# (0.78) 1.86 (0.85) 1.49 (0.72) Post 2.18* (1.11) 1.54#(0.87) 2.03* (1.08) 1.91* (1.04) Effect size 0.35 ‐0.01 0.18 0.47 Destabilizing Force (N/kg) Baseline 1.20 (0.20) 1.18 (0.15) 1.18 (0.27) 1.23 (0.14) Post 1.06* (0.26) 1.29*#(0.20) 1.27* (0.35) 1.01*# (0.14) Effect size ‐0.58 0.64 0.29 ‐1.56 CoP‐BoS Distance (cm) Baseline 12.9 (2.3) 12.9 (1.6) 12.6 (3.0) 13.3 (1.4) Post 11.5* (3.0) 13.9*#(1.9) 13.4* (3.8) 10.9*# (1.5) Effect size ‐0.51 0.57 0.25 ‐1.59 CoM Velocity (m/s) Baseline 0.71 (0.13) 0.70 (0.13) 0.71 (0.13) 0.70 (0.13) Post 0.71 (0.13) 0.70 (0.14) 0.72* (0.13) 0.70# (0.13) Effect size 0.02 0.04 0.12 ‐0.01 SD: standard deviation. NP: non‐paretic. P: paretic. N/kg: Newton per kilogram. m: meter. m/s: meter/second. *: significant differences between tied‐belt periods (baseline vs. post‐perturbation; P<0.05). #: significant differences between sides (paretic vs. non‐paretic; P<0.05). Bold values represent moderate to large effect sizes. 330
In terms of "side" effects, results also showed more difficulty in maintaining balance during the stance phase of the leg that was previously on the slow belt. For the NP Fast
condition, values of the stabilizing (P < 0.001) and destabilizing (P = 0.001) forces and the CoP-BoS distance (P = 0.001) during the non-paretic stance phase showed less difficulty in
335
maintaining balance than during the paretic stance phase. For the P Fast condition, in the post-perturbation period, lower values of the destabilizing force and CoP-BoS distance during the non-paretic stance phase indicate higher balance difficulty (P = 0.003 and 0.007). The CoM velocity was lower during the non-paretic than paretic stance phase in the post-perturbation of the P Fast condition (P = 0.001).
340
DISCUSSION
This study aimed to determine the effect of a more symmetrical gait pattern on the dynamic and postural balance of individuals post-stroke. Balance difficulty did not differ between the subgroups that presented a global improvement or deterioration in asymmetry 345
following the split-belt protocol. Improved symmetry had less effect on balance than the type of perturbation, i.e. whether the non-paretic leg or the paretic leg was on the fast belt during the 6-minute split-belt walking, as balance difficulty increased in the post-perturbation period during the stance phase on the leg that was previously on the slow belt. This was also confirmed by the analysis of the effect of the improvement in symmetry of each ST parameter on balance
350
difficulty. It showed that the level of dynamic (stabilizing force) and postural (destabilizing force) balance difficulty increased more often on the side that was previously on the slow belt in both experimental conditions (NP Fast and P Fast).
In agreement with previous studies (e.g. Reisman et al. (2007)), we found that the asymmetry of ST parameters changed after the participants walked on a split-belt treadmill for 355
six minutes. However, improvements of symmetry in some ST parameters were observed with a deterioration of others (more asymmetrical) even for the inter-limb parameters (SL and DST), that showed more persistent changes after the split-belt protocol (Reisman et al., 2007). To quantify overall changes in gait symmetry and assess their effect on balance variables, we used a global index including six ST parameters. This was required to consider changes in the level of 360
asymmetry of more than one ST gait parameter because these parameters did not change independently or consistently between conditions or participants. The weight of the six ST parameters was normalized to calculate the global index of symmetry, as no preliminary data supports the importance of the asymmetry of one or several ST parameters over the others. Such an approach was necessary to determine if a more symmetrical gait pattern was associated with 365
higher balance demand and this comprehensive consideration of ST gait parameters asymmetry has never been used in previous studies on the split-belt protocol. Considering the results of the present study, based on the effect on global asymmetry and asymmetry of each ST parameter, it can be concluded that greater symmetry does not increase balance demand when a split-belt protocol is used to improve the symmetry. It is important to note that the results may differ with 370
a training program targeting gait symmetry in the long run. Reduction of asymmetry may then result from improvements in sensorimotor capacities and muscle strength that would likely affect balance capacities differently than the session of split-belt walking used in the present study.
The second objective was to identify which of the split-belt conditions, i.e. the non-paretic or non-paretic leg on the fast belt, most affects dynamic and postural balance. In post-375
perturbation, as revealed by higher stabilizing and lower destabilizing forces, the dynamic and postural difficulty increased during the stance phase on the leg that was on the slow belt during the split-belt protocol regardless of the side (paretic or non-paretic leg). These findings are mainly explained by the shorter distance between the CoP and the BoS, a variable included in the calculation of both forces. The CoP-BoS distance was decreased for the leg on the slow belt 380
while the CoM velocity was not affected, partly due to the fact that the treadmill speed was fixed. Our results (not presented here) and previous data (Lauziere et al., 2014; Reisman et al., 2007) also showed that on the slow belt, the position of the leading foot was closer to the pelvis (lower FFP) and to the posterior foot (shorter SL), regardless of the symmetry. This reduced the BoS surface, therefore reducing the CoP-BoS distance during the single support phase. Shorter 385
CoP-BoS distance can also be partly explained by higher plantarflexor moments of the slow leg at the end of the stance phase (Lauziere et al., 2014), that would bring the CoP further forward as suggested by Chisholm and collaborators (Chisholm et al., 2011), after split-belt walking.
Reduced step length and increased plantarflexor moment lead to decreased CoP-BoS distance. That SL and DST tend to increase on the side that was previously on the fast belt explained that 390
the difficulty in maintaining balance decreased or did not change during the stance phase on the previously fast belt.
Larger postural than dynamic changes in balance, as underlined by larger effect sizes found for destabilizing (moderate to large effect sizes) than stabilizing (small to moderate effect sizes) forces after the perturbation might be related to the modifications of the foot placement 395
rather than an increase in gait speed. Changes in foot placement were reported for individuals post-stroke when walking overground after split-belt treadmill training (Reisman et al., 2013) or after perturbations (Hak et al., 2013) rather than change in gait speed or step frequency,
respectively, that would affect dynamic more than postural balance.
Due to the chosen experimental design and the difficulty of walking on a split-belt 400
treadmill, it is not possible to determine whether holding the handrails during the perturbation periods contributed to the observed changes in balance difficulty. Also, these results need to be confirmed with an intervention that would systematically alter ST parameters, to better
understand the link between each ST parameter and balance. The generalization of these results to overground balance also needs to be tested.
405
In conclusion, a more symmetrical gait, shown by changes in both symmetry of each ST parameter or global symmetry, did not systematically affect balance difficulty in the direction of the CoM velocity in post-perturbation period after split-belt walking. Increased difficulty in maintaining balance was associated with the leg previously on the slow belt during the split-belt walking. As modifications of the ST asymmetry did not affect balance, the split-belt protocol can 410
be recommended to improve gait symmetry in individuals post-stroke. Considering that paretic stance phase has been reported as less stable (Chisholm et al., 2011; Nott et al., 2014), the higher balance difficulty measured during the NP Fast condition and not, as hypothesized, the P Fast one could also challenge and possibly improve postural and dynamic balance capacities of the participants trained with a split-belt protocol.
ACKNOWLEDGEMENTS
We are grateful to Philippe Gourdou, Michel Goyette and Daniel Marineau for software design and technical support.
We thank the Canadian Institutes of Health Research (Vanier Canada Graduate 420
Scholarship and the Sensorimotor Rehabilitation Research Team) and Fonds de recherche du Québec en santé for their scholarships and Ordre de la physiothérapie du Québec and Réseau Provincial de Recherche en Adaptation-Réadaptation for grants as well as the Canadian
Foundation for Innovation for funding the equipment and material required for the study in the Pathokinesiology Laboratory.
425
REFERENCES
Balaban, B., and Tok, F. (2014). Gait Disturbances in Patients With Stroke. PM&R, 6(7), 635-642.
430
Balasubramanian, C. K., Neptune, R. R., and Kautz, S. A. (2010). Foot placement in a body reference frame during walking and its relationship to hemiparetic walking performance.
Clinical Biomechanics, 25(5), 483-490.
Berg, K., Wood-Dauphinee, S., and Williams, J. (1995). The Balance Scale: reliability
assessment with elderly residents and patients with an acute stroke. Scandinavian Journal 435
of Rehabilitation Medicine, 27(1), 27 - 36.
Chisholm, A. E., Perry, S. D., and McIlroy, W. E. (2011). Inter-limb centre of pressure symmetry during gait among stroke survivors. Gait & Posture, 33(2), 238-243. Desrosiers, E., Nadeau, S., and Duclos, C. (2015). Balance during walking on an inclined
instrumented pathway following incomplete spinal cord injury. Spinal cord, 53(5), 387-440
394.
Duclos, C., Desjardins, P., Nadeau, S., Delisle, A., Gravel, D., Brouwer, B., and Corriveau, H. (2009). Destabilizing and stabilizing forces to assess equilibrium during everyday activities. Journal of Biomechanics, 42(3), 379-382.
Duclos, C., Mieville, C., Gagnon, D., and Leclerc, C. (2012). Dynamic stability requirements 445
during gait and standing exergames on the wii fit(R) system in the elderly. Journal of
NeuroEngineering and Rehabilitation, 9(1), 28.
Gowland, C., Stratford, P., Ward, M., Moreland, J., Torresin, W., Van Hullenaar, S., . . . Plews, N. (1993). Measuring physical impairment and disability with the Chedoke-McMaster Stroke Assessment. Stroke, 24(1), 58-63.
450
Hak, L., Houdijk, H., van der Wurff, P., Prins, M. R., Mert, A., Beek, P. J., and van Dieën, J. H. (2013). Stepping strategies used by post-stroke individuals to maintain margins of stability during walking. Clinical Biomechanics, 28(9–10), 1041-1048.
Hendrickson, J., Patterson, K. K., Inness, E. L., McIlroy, W. E., and Mansfield, A. (2014). Relationship between asymmetry of quiet standing balance control and walking post-455
stroke. Gait and Posture, 39(1), 177-181.
Hof, A. L., Gazendam, M. G. J., and Sinke, W. E. (2005). The condition for dynamic stability.
Ilmane, N., Croteau, S., and Duclos, C. (2015). Quantifying dynamic and postural balance difficulty during gait perturbations using stabilizing/destabilizing forces. Journal of 460
Biomechanics, 48(3), 441-448.
Kao, P.-C., Dingwell, J. B., Higginson, J. S., and Binder-Macleod, S. (2014). Dynamic instability during post-stroke hemiparetic walking. Gait and Posture, 40(3), 457-463.
Lauziere, S., Mieville, C., Betschart, M., Duclos, C., Aissaoui, R., and Nadeau, S. (2014). Plantarflexion moment is a contributor to step length after-effect following walking on a 465
split-belt treadmill in individuals with stroke and healthy individuals. Journal of
Rehabilitation Medicine, 46(9), 849-857.
Lemay, J.-F., Duclos, C., Nadeau, S., Gagnon, D., and Desrosiers, É. (2014). Postural and dynamic balance while walking in adults with incomplete spinal cord injury. Journal of
Electromyography and Kinesiology, 24(5), 739-746.
470
Lewek, M. D., Bradley, C. E., Wutzke, C. J., and Zinder, S. M. (2014). The relationship between spatiotemporal gait asymmetry and balance in individuals with chronic stroke. Journal of
Applied Biomechanics, 30(1), 31-36.
Mullie, Y., and Duclos, C. (2014). Role of proprioceptive information to control balance during gait in healthy and hemiparetic individuals. Gait and Posture, 40(4), 610-615.
475
Nakagawa, S., and Cuthill, I. C. (2007). Effect size, confidence interval and statistical significance: a practical guide for biologists. Biological Reviews, 82(4), 591-605. Ng, S. S., and Hui-Chan, C. W. (2005). The Timed Up & Go Test: Its Reliability and
Association With Lower-Limb Impairments and Locomotor Capacities in People With Chronic Stroke. Archives of Physical Medicine and Rehabilitation, 86(8), 1641-1647. 480
Nott, C. R., Neptune, R. R., and Kautz, S. A. (2014). Relationships between frontal-plane angular momentum and clinical balance measures during post-stroke hemiparetic walking. Gait & Posture, 39(1), 129-134.
Patterson, K. K., Gage, W. H., Brooks, D., Black, S. E., and McIlroy, W. E. (2010). Evaluation of gait symmetry after stroke: A comparison of current methods and recommendations 485
for standardization. Gait and Posture, 31(2), 241-246.
Patterson, K. K., Parafianowicz, I., Danells, C. J., Closson, V., Verrier, M. C., Staines, W. R., . . . McIlroy, W. E. (2008). Gait Asymmetry in Community-Ambulating Stroke Survivors.
Archives of Physical Medicine and Rehabilitation, 89(2), 304-310.
Reisman, D. S., McLean, H., Keller, J., Danks, K. A., and Bastian, A. J. (2013). Repeated split-490
belt treadmill training improves poststroke step length asymmetry. Neurorehabilitation
and Neural Repair, 27(5), 460-468.
Reisman, D. S., Wityk, R., Silver, K., and Bastian, A. J. (2007). Locomotor adaptation on a split-belt treadmill can improve walking symmetry post-stroke. Brain, 130(7), 1861-1872. Richards, C. L., Malouin, F., and Nadeau, S. (2015). Chapter 13 - Stroke rehabilitation: clinical 495
picture, assessment, and therapeutic challenge. In S. N. Numa Dancause & R. Serge (Eds.), Progress in Brain Research (Vol. Volume 218, pp. 253-280): Elsevier. Roerdink, M., and Beek, P. J. (2011). Understanding Inconsistent Step-Length Asymmetries
Across Hemiplegic Stroke Patients: Impairments and Compensatory Gait.
Neurorehabilitation and Neural Repair, 25(3), 253-258.
500
Salbach, N. M., Mayo, N. E., Higgins, J., Ahmed, S., Finch, L. E., and Richards, C. L. (2001). Responsiveness and predictability of gait speed and other disability measures in acute stroke. Archives of Physical Medicine and Rehabilitation, 82(9), 1204-1212.
Tasseel-Ponche, S., Yelnik, A. P., and Bonan, I. V. (2015). Motor strategies of postural control after hemispheric stroke. Neurophysiologie Clinique/Clinical Neurophysiology, 45(4–5), 505
327-333.
Weerdesteyn, V., de Niet, M., van Duijnhoven, H. J., and Geurts, A. C. (2008). Falls in individuals with stroke. Journal of Rehabilitation Research and Development, 45(8), 1195-1213.
Winter, D. A. (1995). Human balance and posture control during standing and walking. Gait and 510