Science Arts & Métiers (SAM)
is an open access repository that collects the work of Arts et Métiers Institute of
Technology researchers and makes it freely available over the web where possible.
This is an author-deposited version published in:
https://sam.ensam.eu
Handle ID: .
http://hdl.handle.net/10985/10076
To cite this version :
Daniel FROELICH, Elisabeth MARIS, Henri RENARD - Sorting mixed polymers from end of life
products by a selective grinding process WASTE AND BIOMASS VALORIZATION p.439450
-2010
Any correspondence concerning this service should be sent to the repository
Administrator :
[email protected]
Sorting mixed polymers from end-of-life product by a selective
grinding process
D. Froelicha 1, E. Marisb H. Renarda
a *Laboratoire Modélisation, Analyse & Prévention des Impacts Environnementaux, ARTS et METIERS ParisTech, 4, Rue lac Majeur Savoie Technolac, 73375 Le Bourget du Lac Cedex,
France
b ARTS, 151, bd de l’Hôpital 75 013 Paris, France
*email: [email protected]
Abstract
European policy on waste and market demand for material are driving the development of sorting techniques adapted to automobiles and electric products at the end of their lifetimes. In this article, we present work on polymer sorting using selective grinding.
Selective grinding is an operation that consists in sorting polymers after shredding. Specific particle size distributions characterize each polymer in the output stream and these differences are used to recover certain polymers by sifting. This process is based on the brittle or ductile properties of polymers.
The first results presented in this work concern the sorting of a mixture of polymers and polyolefins, which are chemically incompatible.
The working method adopted includes three parts. In the first part, a stream of mixed polymers from the shredder residue (SR) of a treatment chain was characterized. The mixed stream was composed of different grades of Polypropylene and different grades of Polyethylene. Afterwards, based on the characterization data, selective grinding tests were carried out on a model mixture with virgin materials. Once the selective grinding conditions were validated, other tests were carried out with shredder residues. The conclusion of this study is that selective grinding can be an efficient technology to sort incompatible polymers, which are not sorted by other processes, such as density separation or automated near infrared sorting.
Keywords: sorting, selective grinding, recycling, polymers, brittle properties
Introduction
The development of recycling contributes to the preservation of raw materials and the reduction of pollutant emissions. In France, it is estimated that only 7% of production comes from plastics recycling (ADEME, January 2009). This means that most plastics are still buried in landfills. These include plastics from end-of-life products, for which dismantling is still not widespread in Europe and not economically viable. Methods of sorting are beginning to emerge, but most do not work for black polymers, commonly used by car manufacturers or in household products. It is estimated that in France, hundreds of thousands of tons of recyclable plastics are buried in landfills each year, without having been sorted or recycled. Among these families of plastics, polyolefins are a growing challenge. They represent up to 50% of the plastics used in consumer products and, after sorting, these materials would be easy to reuse in noble applications as substitutes for virgin materials. The automotive industry
began to use these materials in car production in 1991 and vehicles now contain up to 14% of recycled plastics. Their progress is being blocked by the lack of available sources. Currently, there are sources of blended polyolefins that are easy to collect from the treatment of end-of-life vehicles (ELV) and DEEEs. These mixed plastics come from vehicle dismantling or from the shredder residues (SR) resulting from the recovery fractions of non-ferrous metal from ELV.
To date, methods of sorting mixed plastics remain imperfect. The more sophisticated methods provide, in the better cases, purity rates of about 95%, which is still insufficient to achieve the properties of original material. The use of chemical compatibilization is necessary, but adds an additional cost to recycling and tends to deteriorate the properties of the material. In addition, there are pairs of materials such as polypropylene and polyethylene, which are chemically similar and incompatible as of a certain percentage of mixture that is encountered in our blends of plastics. The sorting of these materials requires the use of near-infrared methods, which are ineffective when the material is dark. Black and grey colors are widely used for consumer products. It therefore appears that these materials end up in landfill. This study was funded by the ANR (National Research Agency) in the framework of a French research program on environmental technology.
The main objectives of this study were as follows: - Characterizing polyolefin fractions from SR
- Developing a sorting process using selective grinding as an alternative to the conventional grinding required for all recycling.
The general approach of the study includes:
- Providing a representative sample of the plastics fraction from a SR source - Characterization of the representative sample
- Phenomenological analysis of the grinding behavior of the reference material at several temperatures using a laboratory grinder. Determination of optimum conditions for grinding. - Developing a methodology to characterize the output purity and the mass yield.
- Testing reference samples with virgin materials in a pilot mill.
- Extrapolation of virgin mixture results on SR. Testing the validity of the extrapolation of selective grinding tests on a reference sample of SR.
- Determining the general level of purity, mass balances and economic processes. - Understanding the limits of the grinding behavior.
1
C
HARACTERIZATION OF A PLASTICS MATERIAL SAMPLE FROM THESHREDDING OF END
-
OF-
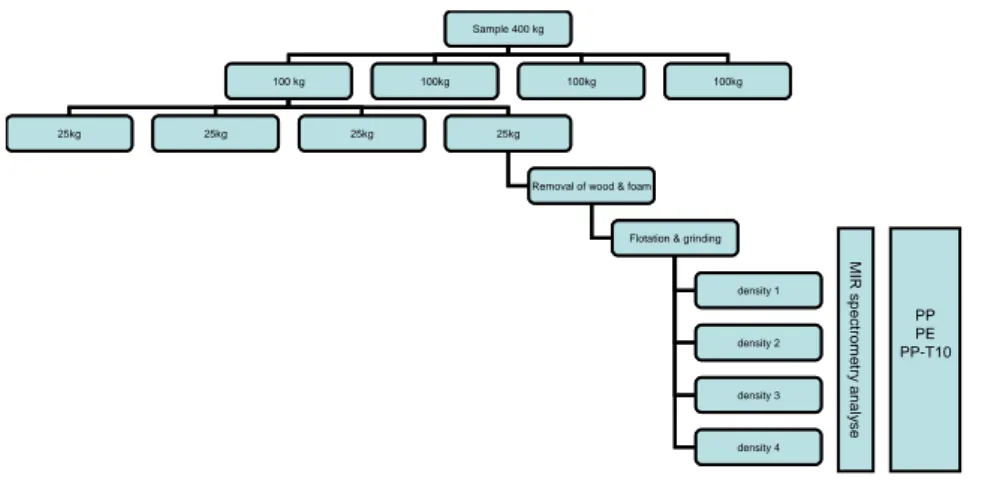
LIFE PRODUCTSThe sampling method is derived from the GY’s theory (Gy, 1982) on heterogeneous waste. In the Gy’s theory, a representative sample is based on a sampling scenario in which all particles have the same probability of being included in the sample (figure 1).
It is primarily based on sample division and several successive grindings of representative batches of mixed PP and PE plastic materials, from the SR of automotive products (approximately 400 kg): the minimum mass of the final sample varies with the cube of the particle size. The composition is characterized with mid-infrared spectrometer analysis.
Figure 1: Diagram of sampling methodology to get a representative sample of SR
The composition of SR is 67.4% of unmodified PP, 24.9% of PE (mostly HDPE) and 7.7% of PP filled with ten percent of talcum (figure 2). This result is consistent with the average composition of the plastic parts in European cars.
25% 67% 8% 0% 10% 20% 30% 40% 50% 60% 70% 80% PE PP PP-T10 type of polymer pu rc e nt a ge
Figure 2: Composition of a representative sample of SR
This result complements a recent study on the characterization of SR where the quantitative results are very similar but the presence of PP loaded with talc was not detected (Bakker, Rem, & Fraunholcz, 2009).
The selective grinding tests were firstly conducted with a standard mixture of virgin materials. This mixture was selected from the results obtained by the analysis of SR
The tests were then carried out with SR.
2 P
HENOMENOLOGY ANALYSIS OF SELECTIVE SHREDDING2.1 Principle
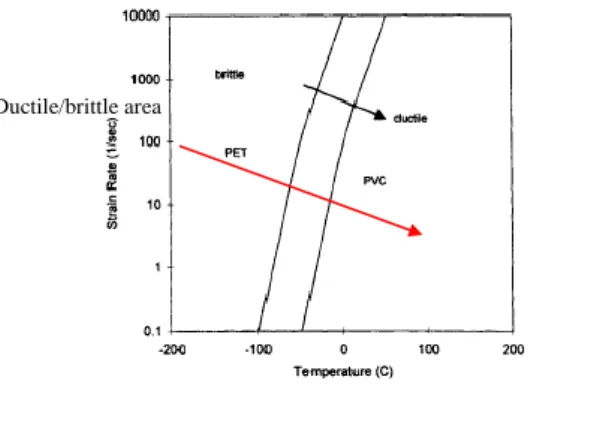
This process is based on the brittle/ductile behavior of polymers as a function of temperature. It is a grinding operation of a mixture of materials characterized by differences in mill output size distributions, these differences being used to isolate certain materials by sifting. The ductile brittle behavior of PVC and PET from packaging has been described (GREEN,
Sample 400 kg
100 kg 100kg 100kg 100kg
25kg 25kg 25kg 25kg
Removal of wood & foam
Flotation & grinding
density 1 density 2 density 3 density 4 Sample 400 kg 100 kg 100kg 100kg 100kg 25kg 25kg 25kg 25kg
Removal of wood & foam
Flotation & grinding
density 1 density 2 density 3 density 4 MIR s pe c tr om e tr y an al y s e PP PE PP-T10
PETIY, Gillis, & Grulke, 1998). Brittle temperatures of PET and PVC are different. PVC shows brittle behavior at a higher temperature than does PET (figure 3).
Figure 3: Ductile and brittle area for PVC and PET polymers
This is also the case for polypropylene and polyethylene. The following table gives the brittle temperature of the polypropylene and polyethylene materials studied. We find a very different brittle temperature for both polymers that can be exploited for their separation at low temperatures.
Brittle temperature (Reference standard ASTMD 746-07)
HDPE LDPE PP copo PP homo
-110°C -70°C -50°C -18°C
Objective to achieve purity after sorting:
Polypropylene and polyethylene are not compatible. A PE impurity rate of less than 5% in the polypropylene results in properties similar to those of virgin material (Froelich et al., 2007).
2.2 Selective grinding hypotheses
At room temperature, the two pairs of PP and PE materials have ductile behavior. At lower temperatures, the PP becomes brittle while the PE remains ductile. A rotating hammer mill (figure 4) will hit and fragment the Polypropylene rendered brittle, while the ductile polyethylene will not break. A simple screening process will sort the two materials.
. Ductile/brittle area Entrée PP PE Output Inpute PP PE hammer dE =K dx/x n dE
Figure 4: Diagram of grinding in the mill chamber
Two types of analysis were carried out on the standard mixture and the fraction of SR: • Analysis of the size distribution of pre-grinded SR obtained with a cutter mill at room temperature.
• Analysis of the size distribution after hammer milling at room temperature and T = -50° C.
2.3 Phenomenological study of kinematics and of grinding particles calibrated with the laboratory grinder.
The objective is to analyze the fragmentation phenomena of sized particles of PP homopolymer and PP copolymer at room temperature (23°C) and at T= -50°C at a speed of 6500t/mn (Vt = 10m/s) in the laboratory mill (hammer mill).
Experimental setup:
- Laboratory hammer mill with a transparent window (Picture 8 and 9) - Refrigerator to reach temperatures between -40 ° C to -80 ° C
- High sensitivity CCD camera of with a rapid flash (0.1 ms) to capture the first shock of the hammer on the particle.
- Audiometers recording the audio signal during the duration of grinding - Electric screeners.
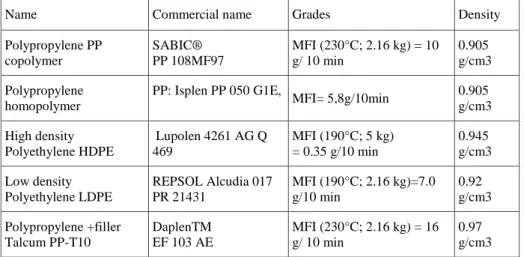
The experimental determination of the optimum temperature for selective fragmentation was conducted with five kinds of polyolefins and the reference materials for the standard mixture, which are listed in the following table.
Name Commercial name Grades Density
Polypropylene PP copolymer SABIC® PP 108MF97 MFI (230°C; 2.16 kg) = 10 g/ 10 min 0.905 g/cm3 Polypropylene homopolymer PP: Isplen PP 050 G1E, MFI= 5,8g/10min 0.905 g/cm3 High density Polyethylene HDPE Lupolen 4261 AG Q 469 MFI (190°C; 5 kg) = 0.35 g/10 min 0.945 g/cm3 Low density Polyethylene LDPE REPSOL Alcudia 017 PR 21431 MFI (190°C; 2.16 kg)=7.0 g/10 min 0.92 g/cm3 Polypropylene +filler Talcum PP-T10 DaplenTM EF 103 AE MFI (230°C; 2.16 kg) = 16 g/ 10 min 0.97 g/cm3
2.3.1 First experimental results
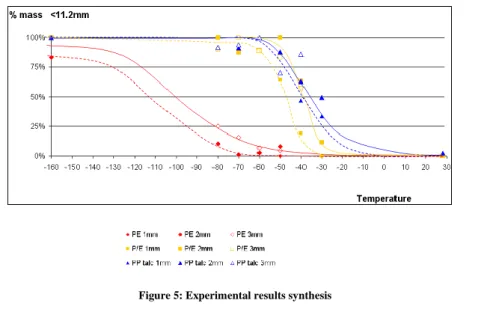
Square particles of 1.5 cm2, made with PP talcum (PP-T), copolymer PP (P/E) and
high-density polyethylene (HDPE) and with variable thickness were introduced in the laboratory mill at temperatures ranging from –160°C to +30°C. The diagram (figure 5) below shows the mass percentage of particles <11.2 mm (mesh screen), depending on the material, temperature and thickness (1 to 3 mm).
Figure 5: Experimental results synthesis
It was observed that:
- At room temperature, all materials have a ductile behavior and do not break.
- At a temperature T = -160°C (liquid nitrogen) all materials show brittle behavior and break. - At a temperature T = -50°C, there is a ductile behavior for HDPE and brittle behavior for PP/T10, P/E (PP copo) regardless of the thickness.
We thus concluded that the temperature T = -50°C is the best condition for selective grinding.
2.3.2 Observation of grinding particles
2.3.2.1 Behavior and kinematics of a particle of PP copolymer at room temperature
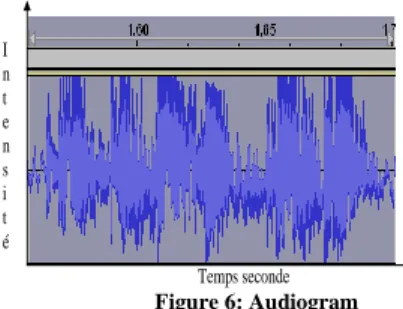
At room temperature, no particle was fragmented during the stay in the grinder chamber. The residence time distribution corresponds to the basic residence time of a particle in the grinder. An audiogram was recorded during the grinding of a copolymer particle at room temperature (see figure 6):
Temps seconde I n t e n s i t é Figure 6: Audiogram
We observed that while the particle was in the mill, there were six stages of grinding with the same intensity. These grinding phases did not lead to the fragmentation of the particle, but rather to a first degree of deformation. This corresponds to energy absorption for a ductile material made of PP Copo. Figure 8 shows the hammer hitting on a particle during the grinding.
The figure 7 gives the particle’s residence time distribution.
0 5 10 15 20 25 30 0-50 50-100 100-150 150-200 200-250 250-300 >300 durée ms p e rc e n ta g e o f n o t b ro k e n p a rt ic le s
Figure 7: Residence time of PP copolymer broken particles
The average stay of the particle in the grinder chamber is about 150ms but standard deviation is important. The residence time can be extended to more than 800ms without breakage.
Figure 8: Unbroken particle after shredding
Hammer Particle Anvil
2.3.2.1 Analysis of residence time of particles of PP copolymer at -50°C.
Figure 9: Audiogram of particles of PP Copo at T = -50C
The grinding begins, as previously, with a series of high-intensity shocks and then continues with less intense shocks (figure 9). It can be assumed that the particle was fragmented, and experienced secondary grinding for a longer period. Figure 10 shows the different steps of particle fragmentation. The particle was not exploded after the first impact in picture (a). The particle was partially fragmented in picture (b) and completely fragmented in picture(c).
Figure 10: Impact point of (a) particle not fragmented after the first hit, (b) percussion followed by partial fragmentation, (c) grinding followed by total fragmentation of the particle.
2.3.2.2 Analysis of residence time of particles of PP homopolymer at room temperature
The PP homopolymer shows a similar behavior at room temperature to the copolymer at a temperature of –50°C. However, in the series of tests carried out, particles were ejected without being ground. If we compare the residence time of these particles, we see that PP homo particles are ejected after a stay of less than 50ms. Figure 11 represents the residence time of ground particles (Copo to Ta and Ta homo)
Time: second I n t e n s i t y
0 5 10 15 20 25 30 0-50 50-100 100-150 150-200 200-250 250-300 >300 Residence time ms p e rc e n ta g e o f p a rti c le s
PPcopo room temprature PP homo room temperature
Figure 11: Residence time of particles of PP homopolymer PP and copolymer
We can infer that there is a probability of around 7% for a particle with brittle behavior to not be properly struck by the laboratory hammer mill and to escape without being fragmented within the first 50 ms. The following pictures show that the first shock does not always break brittle particles. This is a limitation from a sorting point of view and the design of the mill must be improved.
Fragments
Particle fragmentation Deformation and fracturing
Figure 12: Behavior of homopolymer particles during the first shock of at room temperature
The figure 13 represents the active periods of grinding leading to particle breakage. The active duration of grinding is the difference between the residence time and the intervals of waiting time during which the particle is not struck. It is during this time that energy is transferred to the particle.
Hammer anvil
Hammer
0 5 10 15 20 25 30 35 0-50 50-100 100-150 150-200 200-250 250-300 300-350 Residence time ms Pe rc e n ta g e o f b ro k e n p a rti c le s PP homo Tr PP Copo T = -50C
Figure 13: "Active" Residence time of broken particles
We note that although the materials have similar behavior, the copo at -50°C would be more fragile than homo (shorter average residence time).
The temperature measurement on the unbroken particles allows the calculation of the energy transfer function.
2.3.3 Particle size distribution of a mixture of PP copolymer and virgin PP
homopolymer at room temperature
This test was carried out in the same grinding conditions as before. With a 5 mm sieve, there are more than 80% homo PP and 0% PP copo, PP copo did not break at room temperature in the grinding tests. This result confirms the feasibility of selective grinding for PP homo and copo.
Figure 14: Size distribution curves of homopolymer PP and copolymer PP after grinding
2.3.4 Test results for the selective grinding of shredder residues
The tests focused on the actual SR materials provided by a recycling company. These fractions were ground in a cutting mill and screened to get a very homogenous particle size of 10mm. Firstly, it was necessary to develop a rapid method for the identification of particle compositions before and after grinding to assess the purity and yield.
0 20 40 60 80 100 120 6,3 mm 5 mm 4 mm 3,15 mm 2 mm 1,4 mm 1 mm 0,5mm particles size m a s s e e n % PP copo P Phomo
2.3.4.1 Methodology for evaluating shredder particle composition
The literature provides different levels of density in different areas: Density
PP homo PP copo PP+FR LDPE HDPE PP-T10
900-910 900-930 910-950 920-930 940-960 970-1000
In the SR, we identified more than 1% of PP- FR (flame retardant) and a very small amount of LDPE. We saw that the other materials PP, PP-T10 and HDPE were well differentiated in terms of density, with the exception of a potential recovery of PP copo and LDPE. Both the MIR spectrographic analysis of ground fractions and the density measurement allowed the refining of the correlation between polymers and density to avoid the risk of potential errors. This method was considered viable for determining the material content in particle fragments after screening.
2.3.4.2 Grinding at room temperature and optimized grinding speed
Protocol tests with the laboratory mill at room temperature on a sample of 100 predefined particle sizes:
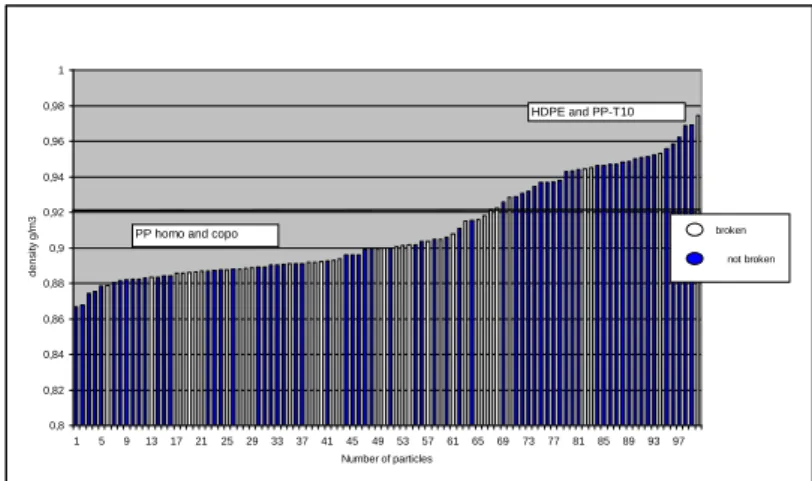
Firstly, the samples were sorted by size and thickness. One hundred particles of the same size and thickness were characterized, one by one, in terms of density and then ground at room temperature at 6500 rpm using the laboratory mill (figure 15). Broken and unbroken particles were identified. A second test was performed in the same conditions but at T = -50°C.
0,8 0,82 0,84 0,86 0,88 0,9 0,92 0,94 0,96 0,98 1 1 5 9 13 17 21 25 29 33 37 41 45 49 53 57 61 65 69 73 77 81 85 89 93 97 Number of particles d e n si ty g /m 3
PP homo and copo
HDPE and PP-T10
Figure 15: Distribution of broken and unbroken particles by density at room temperature
broken not broken
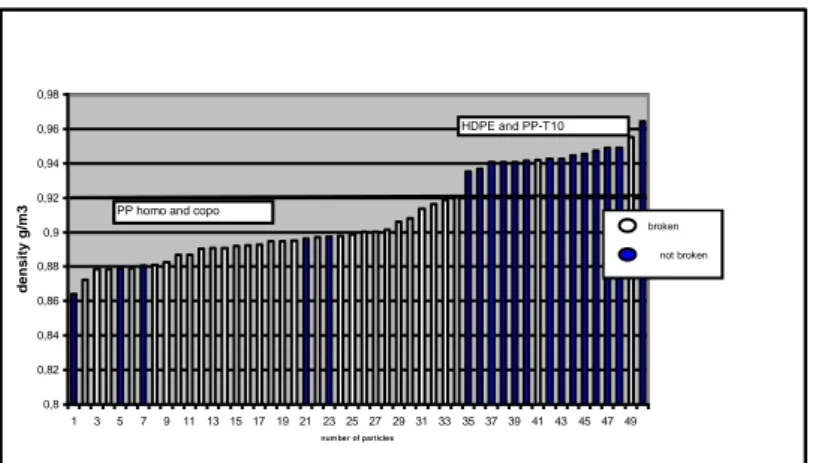
0,8 0,82 0,84 0,86 0,88 0,9 0,92 0,94 0,96 0,98 1 3 5 7 9 11 13 15 17 19 2123 25 27 29 31 33 35 37 39 41 4345 47 49
num ber of particles
d e n s ity g /m
3 PP homo and copoPP homo and copo
HDPE and PP-T10
Figure 16: Distribution of broken and unbroken particles by density at T = -50°C
Conclusions:
1- It can be observed in figure 16 that the number of broken PP particles is higher when the grinding is done at T = -50°C. This result was predicted by the theory and preliminary tests. We also observed some unbroken PP particles. These particles were ejected early in the milling time, as previously observed.
2- For densities greater than 0.93, it is clear that the PE does not break, and the few broken particles are PP talcum. At intermediate densities, some broken particles correspond to the densities of low-density PE.
3 - It should be noted that a number of PP particles were broken at room temperature (figure 15). Tests by impact grinding of PP homopolymer and copolymer particles showed that the PP homopolymer is much more fragile at room temperature than the copolymer as previously shown.
3
GRINDING
TESTS
USING
THE
PROTOTYPE
SEMI-INDUSTRIAL
GRINDER
3.1 Tests on standard material (virgin material)
3.1.1 Standard material sample preparation
The aim of this task was to prepare test specimens of different shapes and thicknesses from the standard materials and to grind them with a cutter mill with a grid of Ø15mm. The samples were made in a injection-molding device with standard materials.
broken not broken
Picture 1: Injection, production of test specimens and particle size reduction with a cutter mill
Results: particle size curves
We observed that pre-shredding with the cutter mill already had a selective effect on particle size distribution at room temperature for T10-PP, LDPE, HDPE, as seen on the following distribution curve. 0 20 40 60 80 100 120 0 2 4 6 8 10 12 particle size mass p er ce n tage PP PP-T10 LDPE HDPE
Figure 17: Size distribution of standard materials after pre-shredding
3.1.2 Test conditions for milling standard samples with the pilot mill
The first step was to reduce the size of the samples with a cutter mill and then to cool them to -50°C in a refrigerated cabinet before introducing the samples into the pilot mill for selective grinding (see picture 5).Picture 2: Continuous feeding operations with mixed thickness and shape factors
Tests on four types of materials: PP, PP-T10, LDPE, HDPE Test conditions:
Commenté [EM1]: Injection , production d’éprouvettes et
• Thickness of plate particles, a mixture of different thicknesses: 1, 2, 3, 4 mm • 0.350 kg / test
Grinding conditions:
• Room temperature, T = -50°C
• Prototype grinder: Impact speed: 22.8 <V <24.8 m / radial speed V= 6000t/mn • (Laboratory grinder: Impact speed v = 10m / s, radial speed V= 6000t/mn) • Hammer size = 0.02 m
• Hammers are equidistant
0 20 40 60 80 100 120 0 2 4 6 8 10 12 particule size Ma ss perc ent age PP T=-50°C PP-T10 T=-50°C LDPE, T=-50°C HDPE T= -50°C
Figure 18: Size distribution curve at brittle temperature of PP, PP-T10, LDPE, HDPE at T = - 50°C
Yield calculation with a mix of standard materials with the same composition as the reference sample of SR (In this case, LDPE was not considered):
T =-50°C Sieve n° 6
Mass composition
Yield % Mass total Total %
PP 67.00 73% 48.91 76% 87% of All PP
PP-T10 8.00 85% 6.80 11%
HDPE 25.00 33% 8.25 13% 13% of PE
Total 100.00 63.96 100%
3.1.3 Selective grinding tests with fractions of shredder residues
Density composition
[90 ; 92] PP in majority
[92 ; 94] Mix fraction
[94 ; 96] PE in majority
[96 ; 100] PP with talc in majority
After the selective grinding, we observed a difference in selectivity at room temperature and at T =-50°C only for the PP particle size distribution (see 19 and 20) and no change for the others fractions.
0% 10% 20% 30% 40% 50% 60% 70% 80% 0 2 4 6 8 10 12 particle size Ma ss perc ent age d [90-92] d [92-94] d [94-96] d [96-100]
Figure 19: Selective grinding at room temperature
0% 10% 20% 30% 40% 50% 60% 70% 80% 0 2 4 6 8 10 12 particle size Ma ss perc ent age d [90-92] d [92-94] d [94-96] d [96-100]
Figure 20: Selective grinding at T=50°C
3.1.4 Final Result
The yield rate and fraction purity results after selective grinding are determined by the quality of the pre-shredding step. The first pre-shredding tests show that for the reference sample, the particle sizes smaller than the size of screen 6 already include particulate PE. To improve yields and therefore the purity rate of selective grinding, it is necessary to improve the quality of the cutter mill (input fraction called the reference sample) to obtain a narrower distribution of particles.
Three trials were conducted with a closer reference size distribution, from [10; 15 mm] instead of [0; 15mm] and the results are reproducible. The purity level of the PP fraction is 99% if we take into account the results with the standard mixture.
Interpretation of results to estimate the rate of purity of the PP fraction (figure 21):
Results for the standard mixtures predict that under the preset conditions for selective grinding, the polypropylene breaks up and the polyethylene does not (Result [I]). The prototype grinder also produces unbroken particles of polypropylene because there is a grinding defect related to the variable residence time of the particles in the grinding chamber (Result [II]).
The MIR spectrometry analysis of the various density fractions indicated the composition of different fractions according to their density. The fraction [90 and 92] is made up of 100%
PP. The other fractions are mixed because the density of PP and the PE overlap. Fraction [94; 96] includes between 85% and 90% of PE, and we can observe in the following figure that this fraction accounts for 27% of the reference fraction. After differential grinding, this fraction comprised 22% of unbroken and 4% of broken particles. These two percentages correspond to the proportion of PE and PP. We can suppose, according to result [I], that the broken particles are indeed PP at 100%. This reasoning can be extended to the other fractions. We can therefore estimate that the purity rate of PP is 99%.
The result [II] explains that the output is not 100% due to defective grinding. Some particles of PP are not ground because they have too short a residence time in the grinding chamber. The total fraction of RB includes 75% of PP and selective grinding makes it possible to sort 59% of the total fraction of PP, the remainder of the fraction of PP is mixed with the PE. The output for PP is thus 79%.
[90;92] [92;94] [94;96] [96;100] total reference [0;6] [6;15] 61% 7% 27% 5% 100% 48% 4% 4% 2% 59% 13% 3% 22% 2% 41% 0% 10% 20% 30% 40% 50% 60% 70% 80% 90% 100% Mass percentage density of particles particles size reference [0;6] [6;15]
Figure 21: final result of sorting tests with SR particle size: [10, 15] mm, grinding at T =- 50°C, selective size of the sieve: 6mm
4 CONCLUSIONS
First conclusion:The standard pre-shredding fractions of SR have an effect on the selectivity of the selective grinding. The closer the particle sizes of the fractions, the better the selectivity of sorting by selective grinding. In the ideal case, the level of purity can reach 99%. Therefore, the quality of pre-shredding with a knife shredder has an effect on the result of the selective grinding. Second conclusion:
The results obtained with the SR are consistent with the results obtained with the standard mixture. Polymer aging seems to have no effect on the selective grinding.
In conclusion, all the phenomena involved in operations to optimize the sorting of different PP and PE have been identified. This process is based on the ductile and brittle properties of polyolefin in some selective grinding conditions. Sorting by selective grinding is conclusive. However, all operations must still be optimized in the context of the industrial development process, particularly to improve the yield of the fractions.
Grinding is a selective route to concentrate sources of polypropylene from used products. This technique could also be interesting for other polymer mixtures. A sampling characterization protocol was developed.
REFERENCES:
ADEME. janvier 2009. Bilan du recyclage 1997-2006, synthèse générale et analyse par filière.
Bakker, E. J., Rem, P. C., & Fraunholcz, N. 2009. Upgrading mixed polyolefin waste with magnetic density separation. Waste Management, 29(5): 1712-1717.
Froelich, D., Maris, E., Haoues, N., Chemineau, L., Renard, H., Abraham, F., & Lassartesses, R. 2007. State of the art of plastic sorting and recycling: Feedback to vehicle design. Minerals
Engineering, 20(9): 902-912.
Green, J. L., Petiy, C. A., Gillis, P., & Grulke, E. A. 1998.
Relationship between strain rate, temperature, and impact failure mechanism for poly(Viny1 chloride) and poly(Ethy1ene terephthalate). POLYMER ENGINEERING AND SCIENCE,
JANUARY 1998, Vol. 38, No. 1.
Gy, P. 1982. Mineral processing: Proceedings of the thirteenth international mineral
processing congress, Warsaw, Poland, June 4–9, 1979 (two volumes - A & B). edited by Prof. J. Laskowski. published by Elsevier, Amsterdam