HAL Id: hal-01398926
https://hal.inria.fr/hal-01398926
Submitted on 18 Nov 2016
HAL is a multi-disciplinary open access
archive for the deposit and dissemination of
sci-entific research documents, whether they are
pub-lished or not. The documents may come from
teaching and research institutions in France or
abroad, or from public or private research centers.
L’archive ouverte pluridisciplinaire HAL, est
destinée au dépôt et à la diffusion de documents
scientifiques de niveau recherche, publiés ou non,
émanant des établissements d’enseignement et de
recherche français ou étrangers, des laboratoires
publics ou privés.
Non-Neutrality Pushed by Big Content Providers
Patrick Maillé, Bruno Tuffin
To cite this version:
Patrick Maillé, Bruno Tuffin. Non-Neutrality Pushed by Big Content Providers. 14th International
Conference on Economics of Grids, Clouds, Systems, and Services (GE- CON’2017), Sep 2017, Biarritz,
France. �hal-01398926�
Non-Neutrality Pushed by Big Content Providers
Patrick Maill´e
Telecom Bretagne, OCIF/IRISA 2, rue de la Chˆataigneraie 35576 Cesson-S´evign´e Cedex, France Email: [email protected]
Bruno Tuffin
Inria Rennes
Campus Universitaire de Beaulieu 35042 Rennes Cedex, France
Email: [email protected]
Abstract—Major content/service providers are publishing grades they give to ISPs about the quality of delivery of their content. The goal is to inform customers about the “best” ISPs. But this could be an incentive for, or even a pressure on, ISPs to differentiate service and provide a better quality to those big content providers in order to be more attractive. This fits the network neutrality debate, but instead of the traditional vision of ISPs pressing content providers, we face here the opposite situation, still possibly at the expense of small content providers though. This paper designs a model describing the various actors and their strategies, analyzes it thanks to non-cooperative game theory, and quantifies the impact of those advertised grades with respect to the situation where no grade is published. We illustrate that a non-neutral behavior, differentiating traffic, is not leading to a desirable situation.
I. INTRODUCTION
Internet traffic has considerably increased in volume in the past years [1], but a large proportion of it is actually due to a very small number of content providers. As of 2013 in North America for example, Netflix and YouTube were accounting for 50% of the whole traffic1. Such big service or content providers (CPs) are becoming omnipresent in our daily life and as a consequence are part of the attractiveness of the subscription to Internet Service Providers (ISPs). On the other hand they have strong quality requirements to be themselves attractive to customers, wishing to propose high definition video services that ISPs need to comply with. To ensure the right service to their customers, those CPs report the quality provided by the various ISPs for their service. Google (owner of YouTube) on its web page https://www. google.com/get/videoqualityreport/ is grading ISPs, depending on your location, based on how well they are able to stream YouTube videos, providing badges “YouTube HD Verified”, “standard definition” or “lower definition”. Google joined here Netflix who was using the so-called ISP speed index (see https://ispspeedindex.netflix.com/) to measure Netflix perfor-mance on the different ISPs. That information indeed helps customers to choose the “best” ISP if they are interested in finding the one optimizing the considered service. It can also put some relevant competitive pressure on ISPs to upgrade their network. But on the down side, it can also be seen as an incentive for ISPs to differentiate service between sources and favor such big providers in order to receive the best grades, at the expense of small providers.
1https://www.cnet.com/news/netflix-youtube-gobble-up-half-of-internet-traffic/
This differentiation threat is highly related to the network neutrality debate [2], [3], [4], [5]. This debate has been vivid for around 20 years, with laws passed worldwide by governments. It comes from ISPs complaining that distant but heavy resource-consuming content providers use their network without financial compensation. As a retaliation if no payment was made, ISPs threatened to block or slow down the traffic of those content providers. This created a lot of protests from user associations and content providers. Interestingly, the threat we imagine in the present work is somewhat the opposite one: ISPs incentivized to favor big CPs to obtain better grades hence more customers, to the benefits of those big providers. Our goal is to model and analyze ISPs’ best strategies in terms of quality offered to a big CP in a competitive context. End users are assumed heterogeneous in terms of interest in the big CP whose quality is publicized. ISPs have to decide how much of their capacity they assign to the big CP. This is to our knowledge the first model trying to tackle this problem. The game is analyzed as a Stackelberg game [6] where first the ISPs competitively decide how much weight they give to the big CP and then the users decide who to subscribe to, given that more subscribers also leads to more congestion. The game is solved by backward induction meaning that, in their decision, ISPs anticipate the subsequent choices of users. We then compare the results with the case where ISPs are neutral, i.e., when they do not favor the big CP. Our results show that a non-neutral scenario may be prejudicial to everybody because no equilibrium in the capacity assignment game between ISPs may exist. Surprisingly also, we highlight situations where such an equilibrium exists with full capacity assigned to the big CP, which leads to the same user repartition between ISPs than in the neutral case.
The rest of this paper is organized as follows. Section II presents the model and the notations. Section III explains the two levels of the game solved by backward induction. The repartition game between users is solved analytically, while the capacity assignment game between ISPs is analyzed numerically, illustrating among other things that there is not necessarily a Nash equilibrium. Section IV finally discusses the results and the comparison with a neutral situation in order to decide whether scrutiny and regulation should be imposed, and presents the most interesting extensions of the model.
II. MODEL
We define the model in this section. We consider two ISPs in competition for users. Users are heterogeneous in their preferences between a good quality for a big CP and for other content (seen as aggregated into a second CP). ISPs have to decide the level of capacity they devote to the big CP to be more attractive to this CP or to focus more on others. Users’ choice is based on the average level of quality they experience, weighted by their preferences.
A. Content providers
To simplify the analysis, we therefore consider two compet-itive CPs, indexed by 1 and 2. CP 1 is assumed to be the big CP, while the other can aggregate competitors so that limiting ourselves to two is without loss of generality.
Let α1 = α and α2 = 1 − α be the volume of traffic
requested to CP 1 and CP 2, respectively, for each user. The total volume is is normalized to 1 without loss of generality; it is then a proportion. Remark that we assume that consumption is constant and independent of the CP attractiveness; user attractiveness to the ISP is with respect to the grade publicized by the CPs.
B. ISPs and quality
We consider two ISPs, named A and B, competing for customers. ISP i has a capacity (that is, throughput) Ci, for
i ∈ {A, B}, and allocates a proportion βi,j(j ∈ {1, 2}) of this
capacity for the traffic of CP j, with βi,1+ βi,2= 1. A neutral
behavior corresponds to βi,j = αj: the capacity allocated to
each CP corresponds to its actual usage; there is no service differentiation for any CP.
Let mA (resp. mB) be the mass of users associated with
ISP A (resp. B).
We define the quality offered to CP j by ISP i as Qi,j:=
Ciβi,j
αjmi
.
In other words, the quality is the inverse of the traffic load of CP j at ISP i: the average capacity per unit of traffic. A neutral behavior with βi,j= αj leads to Qi,j = Cj/mi.
C. End users
End users are assumed heterogeneous in their sensitivity to the ISPs’ grades, even if not reflected in their actual consumption. A user is characterized by a parameter θ ∈ [0, 1] representing the relative weight associated to the quality offered to CP 1. Formally, the felt quality of a user θ at ISP i is
θQi,1+ (1 − θ)Qi,2.
A user θ will then choose the ISP providing the largest quality, i.e., ISP
i = argmaxk∈{A,B}θQk,1+ (1 − θ)Qk,2.
Let F be the cumulative distribution of θ ∈ [0, 1] and f its density, so that user choices give
mi=
Z
1l{i=argmaxk∈{A,B}θQk,1+(1−θ)Qk,2}f (θ)dθ
where 1l{C} is the indicator function that condition C is
satisfied.
In what follows, we will assume θ uniformly distributed over [0, 1] for sake of simplicity. But it can be easily general-ized by a change of variable.
III. MULTILEVELGAME
The notations being introduced, we know define the game between all actors.
A. Game definition
In our model, ISPs and end users make decisions: ISPs choose the fraction of capacity they allocate to each CP, given that their decision and that of their competitor impact their market share, and end users choose their ISP in terms of the felt quality, weighted by their preferences for the quality at the big CP.
But decisions are not taken at the same time scale. Actu-ally ISPs play first and then users make their own choice. The framework is therefore that of a so-called Stackelberg game [6].
We thus end up with a multilevel game where:
1) Each ISP i plays with its capacity repartition βi,1
allocated to CP 1 (the other being allocated 1 − βi,1
in order to maximize its market share.
2) Given the allocated qualities, users choose their ISP. Note that we do not consider pricing strategies of ISPs. This would complicate the analysis and blur the conclusions; we rather assume here that competition has led to ISPs offering similar prices and trying to gain market shares by improving the user perceived quality.
The game is łeader-follower game, meaning that even if ISPs play first, they will make their decision strategically, by anticipating the subsequent decision of users. Hence to make their decisions, ISPs are assumed able to compute the end users’ repartition for any combination (βi,j)i,j. Similarly, in
our analysis we apply the backward induction method, i.e., perform optimizations on capacity repartitions anticipating the reactions of users.
B. Repartition of users among ISPs
Consider the values βi,j as fixed . How do users distribute
themselves according to ISPs? Define
Ci,j0 := Ciβi,j αj
as the available capacity per unit of users for CP j at ISP i, so that Qi,j=
Ci,j0 mi .
A user θ will choose ISP A, and ISP B otherwise, if the (weighted) felt quality at ISP A is larger than that at ISP B
i.e., if
θ (QA,1− QA,2− QB,1+ QB,2) > QB,2− QA,2. (1)
From this inequality, we can get the following existence and uniqueness result about the repartition of users among ISPs. Proposition 1. Assume a uniform distribution of user sensitiv-itiesθ over the interval [0, 1] and any profile of ISP strategies without blocking (i.e., with βj,i > 0 for all j and i). Then
there exists a unique user repartition equilibrium (mA, mB).
Moreover,
• If CA,10 /CA,20 = CB,10 /CB,20 , users are indifferent be-tween A and B, but the repartition is such that
(mA= CA,20 /(C 0 A,2+C 0 B,2), mB= CB,20 /(C 0 A,2+C 0 B,2)). (2)
• Otherwise, there exists a value θ∗ such that forθ < θ∗ the users choose one ISP, and the other for values above thisθ∗.
– If CA,10 /CA,20 > CB,10 /CB,20 values ofθ > θ∗choose A and values of θ < θ∗ choose B,
– We are in the opposite situation if CA,10 /CA,20 < CB,10 /CB,20 .
Proof. The proof is provided in Appendix A.
Remark that the same arguments of the proof can be used, with simplified settings, to express unique solutions if some βi,j are zero. But we did not display those particular cases to
avoid overloading the proposition.
C. Game between ISPs on the quality offered to CPs ISPs A and B play respectively on βA,1 ∈ [0, 1] and
βB,1∈ [0, 1] to maximize mAand mB= 1−mA, respectively,
using the values determined in the previous subsection. Given that we do not have any useful closed-form solution for (mA, mB) in terms (βA,1, βB,1) (actually they are solutions of
second degree polynomials involving several conditions, and do not yield an exploitable expression), we resort to numerical evaluations to solve the game between ISPs.
We first draw the best responses of each ISP in terms of the strategy of its competitor. A Nash equilibrium is a point which is a best response for each ISP, that is an intersection of best-response curves: no one has an interest to unilaterally move from it.
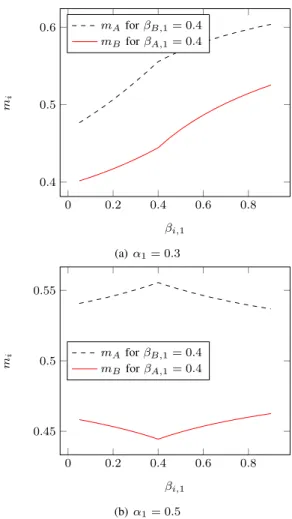
1) Best responses: Figure 1(a) describes the market shares of ISPs in terms of their strategy βi,1 when the strategy βj,1
of the opponent is fixed. The value where it is maximized gives the best response BRi(βj,1) of ISP i in terms of
βj,1. The parameters values in Figure 1(a) are α1 = 0.3,
α2 = 1 − α1 = 0.7, CA = 5, CB = 4. Here it is optimal
to choose αi = 1. We have also checked that when α1 is
large, we have the opposite situation and decreasing masses mA and mB, resulting in optimal values αi = 0. Though,
the functions are not always monotonous, even if they are in many situations. Choose for example α1 = 0.5 (still with
α2= 1 − α1). Figure 1(b) describes the corresponding market
0 0.2 0.4 0.6 0.8 0.4 0.5 0.6 βi,1 m i mAfor βB,1= 0.4 mBfor βA,1= 0.4 (a) α1= 0.3 0 0.2 0.4 0.6 0.8 0.45 0.5 0.55 βi,1 m i mAfor βB,1= 0.4 mBfor βA,1= 0.4 (b) α1= 0.5
Fig. 1. Market shares miof ISPs in terms of the strategy βi,1for given βj,1
when α1= 0.3, α2= 0.7 (top), and α1= α2= 0.5 (bottom).
shares of ISPs, with an interior value βA,1 maximizing mA
for βB,1= 0.4.
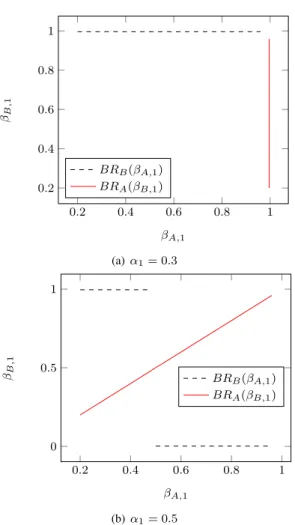
2) Nash equilibrium: Figures 2(a) and 2(b) display, respec-tively for α1 = 0.3 and α1 = 0.5, the best responses of A
and B on the same graph to determine graphically the Nash equilibria.
When α1 = 0.3 (and α2 = 0.7), since best responses of
players are always 1, the Nash equilibrium is (1, 1). In other words, ISPs give all capacity to a single CP, CP 1. On the other hand, when α1 = 0.5 and α2 = 0.5 as in Figure 2(b), while
the best response of A is linearly increasing with βB,1, there
is a discontinuity in the best response of B and we actually end up with no Nash equilibrium, i.e., no point where no ISP would not want to change its strategy.
To understand the discontinuity, we plot in Figure 3 mB in
terms of βB,1 for two close values of βA,1 where the jump
arises: 0.48 and 0.5. The maximal values are at the extreme points of the interval [0, 1] and give very close market shares. For βA,1 = 0.48 the optimal value is at 1, but it is at 0 for
βA,1 = 0.5 .
Remark also from the best response of A in Figure 2(b) that the optimal decisions are not necessarily at the bounds of interval [0, 1]; it depends on the parameter values.
0.2 0.4 0.6 0.8 1 0.2 0.4 0.6 0.8 1 βA,1 βB ,1 BRB(βA,1) BRA(βB,1) (a) α1= 0.3 0.2 0.4 0.6 0.8 1 0 0.5 1 βA,1 βB ,1 BRB(βA,1) BRA(βB,1) (b) α1= 0.5
Fig. 2. Best responses in the repartition game when α1 = 0.3, α2 = 0.7
(top)and α1= α2= 0.5 (bottom).
0 0.2 0.4 0.6 0.8 1 0.44 0.45 0.46 βB,1 m B mB for βA,1= 0.48 mB for βA,1= 0.5.
Fig. 3. Market shares mBin terms of βB,1for given βA,1when α1= 0.5
and α2= 0.5.
IV. DISCUSSION: COMPARISON WITH THE NEUTRAL SITUATION
As we have seen, a (non-neutral) situation where ISPs choose the capacity allocated to each class can lead to ex-treme outcomes and even no predictable outcome (no Nash equilibrium), an uncomfortable situation. This is something unlikely to be accepted by the different actors of the Internet. But one can wonder too what happens in the neutral case where no differentiation is made between CPs. It means that the capacity devoted to each CP is proportional to its volume of traffic, that is βi,j = αj. But that leads to Ci,j0 = Ci, and
from Proposition 1, we have the (unique) user repartition (mA= CA/(CA+ CB), mB = CB/(CA+ CB)).
No comparison can be made with the case α1 = α2= 0.5
where there is no Nash equilibrium, but going back to the non-neutral scenario where α1= 0.3 and α2= 0.7, for which
we have obtained at equilibrium βA,1 = βB,1 = 1, we are
again from Proposition 1 in the situation where CA,10 /CA,20 = CB,10 /CB,20 , so surprisingly the same user repartition as in the neutral case. This would mean no change of behavior from the user point of view, but far less content diversity.
In summary, we have highlighted that even if they might have some pressure to differentiate service, ISPs should not be allowed to do so and their behavior should be under scrutiny. A non-cooperative behavior of ISPs would lead to unpredictable behaviors and potentially less content. Hence this model provides economic arguments in favor of neutrality, contrary to most of the existing literature on net neutrality where adding degrees of freedom (for ISPs to manage traffic as they want) generally allows to reach higher social welfare [7], [8], [9], [10].
An interesting extension of our work will be to consider not only heterogeneous attractiveness in grade advertisements, but a similar (correlated) heterogeneous consumption plan. Solving the equations is much more difficult though, and we believe that the presented model is , at least to our knowledge, the first one trying to analyze such a problem.
REFERENCES
[1] P. Maill´e and B. Tuffin, Telecommunication Network Economics: From Theory to Applications. Cambridge University Press, 2014.
[2] P. Crocioni, “Net neutrality in Europe: Desperately seeking a market failure,” Telecommunications Policy, vol. 35, no. 1, pp. 1 – 11, 2011. [Online]. Available: http://www.sciencedirect.com/science/article/ pii/S0308596110001461
[3] P. Maill´e, P. Reichl, and B. Tuffin, “Internet governance and economics of network neutrality,” in Telecommunications Economics - Selected Results of the COST Action IS0605 EconTel, A. Hadjiantonis and B. Stiller, Eds. Lecture Notes in Computer Science 7216, Springer Verlag, 2012, pp. 108–116.
[4] T. Lenard and R. May (Eds.), Net Neutrality or Net Neutering: Should Broadband Internet Services be Regulated. Springer, 2006.
[5] T. Wu, “Network neutrality, broadband discrimination,” Journal of Telecommunications and High Technology, vol. 2, no. 1, pp. 141–176, 2003.
[6] M. Osborne and A. Rubinstein, A Course in Game theory. MIT Press, 1994.
[7] J. Musacchio, G. Schwartz, and J. Walrand, “A two-sided market analysis of provider investment incentives with an application to the net neutrality issue,” Review of Network Economics, vol. 8, no. 1, pp. 22–39, March 2009.
[8] G. Schwartz, J. Musacchio, M. Felegyhazi, and J. Walrand, “Network regulations and market entry,” in Game Theory for Networks. Springer, 2012, pp. 108–123.
[9] N. Economides and J. T˚ag, “Network neutrality on the internet: A two-sided market analysis,” Information Economics and Policy, vol. 24, no. 2, pp. 91 – 104, 2012. [Online]. Available: http: //www.sciencedirect.com/science/article/pii/S0167624512000029 [10] P. Njoroge, A. Ozdaglar, N. E. Stier-Moses, and G. Y. Weintraub,
“Investment in two-sided markets and the net neutrality debate,” Review of Network Economics, vol. 12, no. 4, pp. 355–402, 2013.
APPENDIXA PROOF OFPROPOSITION1
A user θ strictly prefers ISP A over B if and only if θCA,10 + (1 − θ)CA,20 mA > θC 0 B,1+ (1 − θ)CB,20 mB , or equivalently θ∆ > δ with ( ∆ := C 0 A,1−C 0 A,2 mA − CB,10 −C0 B,2 mB δ := C 0 B,2 mB − CA,10 mA.
Therefore, we can distinguish three possible types of equi-libria.
a) In an equilibrium with ∆ > 0, all users with θ > δ/∆ select ISP A, all users with θ < δ/∆ prefer ISP B, and the set of users indifferent between A and B is of measure zero. Hence for a type-a equilibrium the masses of users with each ISP are of the form mA =
1 − F (θ∗a) and mB = F (θa∗) with F the cdf of
user-specific values θ, and θa∗the corresponding value of δ/∆
at this equilibrium. A user with sensitivity θa∗should be
indifferent between both ISPs, i.e., θ∗aCA,10 + (1 − θ∗a)CA,20 1 − F (θ∗ a) −θ ∗ aCB,10 + (1 − θa∗)CB,20 F (θ∗ a) = 0. When θ follows a uniform distribution over [0, 1], then F (x) = x and the previous equality becomes
θa∗ 1 − θ∗ a (CA,10 −CA,20 )+CB,20 −CB,10 − C0 B,2 θ∗ a + C 0 A,2 1 − θ∗ a = 0. (3) With non-blocking ISP strategies, CA,10 and CB,20 are strictly positive, and (3) has a unique solution in (0, 1). Summarizing, we have a type-a equilibrium if the corre-sponding ∆ is strictly positive, i.e., if in addition to (3) we have CA,10 − C0 A,2 1 − θ∗ a > C 0 B,1− CB,20 θ∗ a . (4)
In particular, (4) implies that (CA,20 − C0 A,1)
θ∗a 1−θ∗
a <
CB,20 − C0
B,1, which plugged into (3) gives
θ∗a 1 − θ∗ a >C 0 B,2 CA,20 , (5) or equivalently 1 θ∗ a < 1 + C 0 A,2 C0 B,2 . (6) Finally, re-writing (3) as CA,10 θa∗ 1 − θ∗ a − CB,20 1 θ∗ a + CA,20 + CB,20 − CB,10 = 0 (7)
and plugging (5) and (6), we get
0 < CA,10 C 0 B,2 C0 A,2 − CB,20 1 + C 0 A,2 C0 B,2 ! + CA,20 + CB,20 − CB,10 = CA,10 C 0 B,2 CA,20 − C 0 B,1 or C 0 A,1 C0 A,2 > C 0 B,1 C0 B,2 .
As a result, a type-a equilibrium, which is unique from (3) can only exist when C
0 A,1 C0 A,2 > C 0 B,1 C0 B,2.
b) We can treat similarly the case when ∆ < 0, by exchanging the roles of ISPs A and B with respect to the previous case. Hence such an equilibrium is of the form mA = θ∗b, mB= 1 − θb∗ with θ∗b the unique solution in
(0, 1) of θb∗CB,10 1 − θ∗b − (1 − θ∗b)CA,20 θ∗b + C 0 B,2− C 0 A,1= 0, (8)
and such a (unique) equilibrium can only exist when
C0A,1 C0 A,2 <C 0 B,1 C0 B,2 .
c) Finally, at an equilibrium with ∆ = 0, all users must be indifferent between the ISPs (otherwise they all prefer the same, while its competitor has no demand (no congestion) and thus infinite quality, a contradic-tion). Therefore, for all θ we have θC
0 A,1+(1−θ)C 0 A,2 mA = θC0B,1+(1−θ)CB,20
mB , which implies, using mA+ mB = 1,
that we have ( CA,10 mA = C0B,1 1−mA CA,20 mA = C0B,2 1−mA
In particular, such an equilibrium can only exist when
C0 A,1 C0 A,2 =C 0 B,1 C0
B,2 (by looking at ratios of left-hand sides and
right-hand sides in the above system of equations), and while the specific user choices are not unique, solving the equation(s) leads to unique values of mA and mB,
given as in (2).
Regrouping the three cases establishes the uniqueness of a user equilibrium as stated in the proposition. To establish existence, we reason on the relative values of C
0 A,1 C0 A,2 and C 0 B,1 C0 B,2 . • First, if C 0 A,1 C0 A,2 = C 0 B,1 C0
B,2 then one can check that mA and
mB given as in (2) is indeed an equilibrium. • Second, if C 0 A,1 C0 A,2 > CB,10 C0
B,2, assume that we do not have
a type-a equilibrium, i.e., that the solution θa∗ of (3) does not give a strictly positive ∆ (or in other words, (4) is not satisfied). We prove below that this leads to a contradiction, following steps close to those of the uniqueness proof. Indeed, (4) not being satisfied means
θ∗a 1−θ∗
a(C
0
A,1− CA,20 ) ≤ CB,10 − CB,20 , which when plugged
into (3) gives θ∗a 1 − θ∗ a ≤ C 0 B,2 CA,20 and 1 θ∗ a ≥ 1 + C 0 A,2 CB,20 . Like for the uniqueness proof, plugging those inequalities into (7) leads to C 0 A,1 C0 A,2 ≤ C0 B,1 C0
B,2, a contradiction with our
starting assumption. Hence when C
0 A,1 C0 A,2 > C 0 B,1 C0 B,2 there exists a type-a equilibrium.
• Third, if C 0 A,1 C0 A,2 < CB,10 C0
B,2, by exchanging the roles of A and