HAL Id: tel-00300727
https://tel.archives-ouvertes.fr/tel-00300727
Submitted on 18 Jul 2008HAL is a multi-disciplinary open access archive for the deposit and dissemination of sci-entific research documents, whether they are pub-lished or not. The documents may come from teaching and research institutions in France or abroad, or from public or private research centers.
L’archive ouverte pluridisciplinaire HAL, est destinée au dépôt et à la diffusion de documents scientifiques de niveau recherche, publiés ou non, émanant des établissements d’enseignement et de recherche français ou étrangers, des laboratoires publics ou privés.
Properties of Semiconductor Nanosstructures
Zhen-Yu Zhao
To cite this version:
Zhen-Yu Zhao. Ultrafast Terahertz Spectroscopy and Nonlinear Optical Properties of Semiconductor Nanosstructures. Atomic Physics [physics.atom-ph]. Université Pierre et Marie Curie - Paris VI, 2008. English. �tel-00300727�
0
THESE DE DOCTORAT DE
L’UNIVERSITE PIERRE ET MARIE CURIE
Spécialité : Physique
(ED107 : Physique de la Région Parisienne)
Présentée par
Zhenyu ZHAO
Pour obtenir le grade de
DOCTEUR DE L’UNIVERSITE PIERRE ET MARIE CURIE
Sujet de la thèse :
Spectroscopie Térahertz Ultrarapide et Propriétés Optiques
Non-Linéaires de Nanostructures Semiconductrices
Soutenu le 17 Juillet 2008 Jury composé de :
Prof. Jérôme TIGNON Directeur de thèse (France)
Prof. Tianqing JIA examinateur
Prof. Maria CHAMARRO
Prof. Fabrice VALLEE Rapporteur
II
Abstract
This manuscript presents 2 individual experimental studies in the field of ultrafast carrier dynamics of semiconductor nanostructures:
1. The development of Terahertz time domain spectroscopy (THz-TDS) and its application in gain measurements of GaAs/AlGaAs quantum cascade lasers.
2. The 3rd order nonlinear optical properties of tellurite niobic glasses doped with AgCl nanocrystalss with Z-scan and degenerate four waves mixing (DFWM).
In order to accomplish this goal, we developed a THz-TDS system with different radiation sources: optical rectification in a ZnTe crystal and interdigitated semi-insulating gallium arsenide photoconductive antennas.
First, we studied the competition between Tera-Hertz (THz) generation by optical rectification in <110> ZnTe crystals, two-photon absorption, second harmonic generation and free-carrier absorption. The two-photon absorption coefficient, second harmonic generation efficiency and free-carrier absorption coefficient in the THz range are measured independently. The incident pump field is shown to be depleted by two-photon absorption and the THz radiation is shown to be reduced, upon focusing, by free-carrier absorption. The reduction of the generated THz radiation upon tight focusing is explained, provided that one also takes into account diffraction effects from the sub-wavelength THz source.
Second, we investigated the temporal and spectral properties of the THz emission of a novel semi-insulating GaAs interdigitated photoconductive antenna with different excited carrier densities, in a temperature range from 4.2K to 270K. The THz emission properties are shown to be linear at low bias fields but saturated at large fields due to the intervalley scattering from the Γ band to the L band. The THz performances also saturate for high laser excitation due to the space charge screening. The carrier dynamics at different temperatures was experimentally investigated by recording the temporal and spectral shape of the THz wave. The emitted THz spectrum shifts to the lower frequency with increasing temperature. The impact of electron-hole mobility in this problem is discussed.
Third, we compared the aforementioned two THz generation methods and decided to use photoconductive antennas as the excitation source of our THz-TDS to investigate the gain and losses of a THz quantum cascade laser (QCL) operating at 2.9THz. We investigated the THz gain variation with different injection currents and different temperatures. We measured THz amplitude and phase spectra, allowing the direct determination of the gain. At the emission frequency of the QCL, a value of 6.5cm-1 is found. Effects such as gain clamping and spectral narrowing are also observed.
Finally, We investigated the non-resonant ultrafast 3rd order nonlinear optical properties of niobic tellurite glass (80TeO2-20Nb2O5) doped with silver chloride (AgCl) nanocrystals. Our samples were synthesized by melting-quenching and thermal treatment techniques. We control the grain-size of AgCl nanocrystals by varying the thermal treatment time. Their structures and AgCl nanocrystalss were characterized by spectroscopy and electronic microscopy. The longer thermal treatment time can enlarge the grain-size and increase the AgCl nanocrystalss density, and further results in forming more defect centers and stronger lattice deformation at the interface of AgCl nanocrystals, which gives rise to the bandgap redshift and formation of trapped state excitons. The larger two-photon absorption and local state carrier absorption result in a decrease of the optical limiting threshold, and the third order nonresonant nonlinear susceptibility χ(3) can be enhanced by the transient polarization of trapped state electrons on the surface of AgCl nanocrytstals.
Keywords : THz Spectroscopy, Optical Rectification, Photoconductive Antenna, Quantum Cascade Laser, Tellurite Glasses, Nanocrystalss, Nonlinear Optics.
III
Résumé
Ce mémoire de thèse présente deux études expérimentales dans le domaine de la dynamique ultra-rapide des porteurs dans les nanostructures semiconductrices:
1. Le développement de la spectroscopie Térahertz dans le domaine temporel (THz-TDS) et son utilisation pour mesurer le gain d’un laser à cascade quantique GaAs/AlGaAs.
2. L’étude des effets de 3ième ordre en optique non linéaire dans des verres de Tellure dopés en nanocristaux AgCl, par "Z-scan" et mélange à quatre ondes (DFWM).
A cette fin, nous avons d’abord construit un montage de spectroscopie Térahertz dans le domaine temporel avec deux sources de rayonnement différentes : la rectification optique dans un cristal non-lineaire <110> ZnTe et par ailleurs des antennes interdigités photoconductrices.
Dans un premier temps, nous avons étudié la compétition entre la rectification optique, la génération de second harmonique, l’absorption à deux photons, et l’absorption par les porteurs libres. Le faisceau pompe subit une absorption à deux photons et le rayonnement THz émis est diminué, dans les conditions de focalisation, par l’absorption des porteurs libres. La réduction de l’émission THz dans les conditions de focalisation est expliquée, à condition de tenir compte des effets de la diffraction de la source THz sub-longueur d’onde.
Dans un deuxième temps, nous avons étudié les propriétés de l’émission THz dans le domaine temporel et spectral d’un nouveau type d’antenne photoconductive interdigitée basée sur du GaAs semi-isolant, en fonction de la densité de porteurs et dans une gamme de température allant de 4.2K à 270K. Les propriétés de l’émission THz sont linéaires pour de faibles tensions appliquées mais révèlent des effets de saturation pour des tensions importantes en raison de la diffusion inter-vallées de la bande à la bande L. Les performances THz saturent aussi pour de fortes excitations laser à raison de l’écrantage des charges. La dynamique des porteurs à été étudiée expérimentalement pour différentes températures. Le spectre THz de l’émission se déplace vers les basses fréquences lorsque la température augmente. L’influence de la mobilité électronique est discutée.
Dans une troisième partie, après avoir comparé les deux méthodes de génération THz ci-dessus et décidé d’utiliser les antennes photoconductives comme source d’excitation pour notre montage THz-TDS, nous avons étudié le gain et les pertes d’un laser à cascade quantique (LCQ) fonctionnant à 2.9 THz. Nous avons étudié les variations du gain en fonction du courant injecté, à différentes températures. Nous avons mesuré les spectres d’amplitude et de phase THz, permettant une détermination directe du gain. A la fréquence de fonctionnement du LCQ, nous mesurons un gain de 6.5cm-1. Des effets comme le « clampage » du gain et l’affinement spectral du gain sont observés et discutés.
Pour finir, nous avons étudié le coefficient de polarisabilité d’ordre 3 des verres de Tellure (80TeO2 -20Nb2O5) dopés en nanocristaux AgCl. Nous avons produit des échantillons par les techniques fonte-trempe et traitement thermique. Les résultats de la caractérisation révèlent qu’un traitement plus long augmente la tailles des nanocristaux qui donne lieu à l’apparition de plus de défauts et une plus grande déformation du réseau cristallin des nanocristaux aux interfaces avec le verre. Des états électroniques piégés apparaissent sous l’effet de la déformation de la structure cristalline. Une forte absorption à deux photons et une absorption des états électroniques piégés réduit le seuil de la limitation optique. Le coefficient polarisabilité non linéaire χ(3) augmente à cause de la formation des défauts et des états électronique localisés.
Mots Clés : Spectroscopie THz, rectification optique, antenne photoconductive, Laser à
cascade quantique, Verres Tellure, nanocristaux, optique non-linéaire.
IV
FIGURE CAPTION
Fig. 1.1 Schmatic diagram of THz-TDS specttrometer.
Fig. 1.2 Diagram of optical rectification and THz emission.
Fig. 1.3 Diagram of THz emission from photoconductive antenna.
Fig. 1.4 Diagram of bolometric detection.
Fig. 1.5 Diagram of Free Space Electro-Optic Ssampling (FSEOS).
Fig. 1.6 Diagram of THz detection in FSEOS.
Fig. 2.1 Laser pulse spectrum.
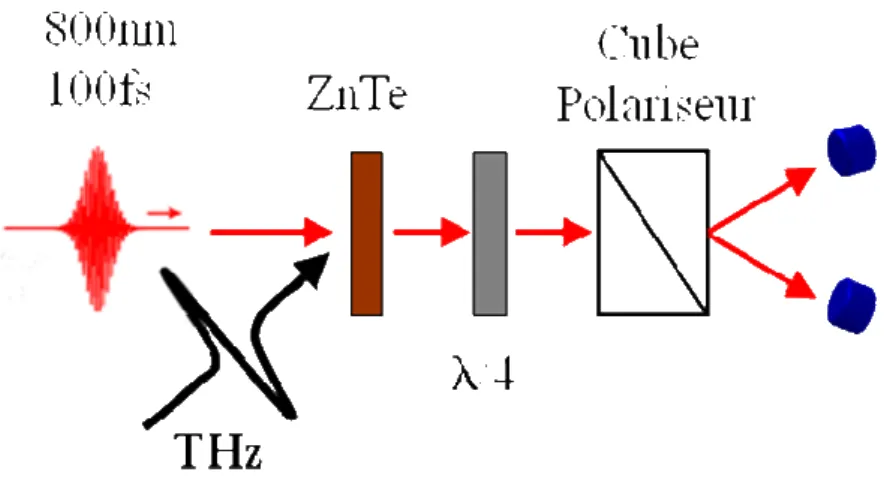
Fig. 2.2 Schematic diagram of THz-TDS; S:sample, M: mirror, BS: beamsplit, τ: time delay, ETHz: THz emitter (ZnTe crystal or photoconductive antenna),
A: ZnTe sensor, B: λ/4 waveplate, C: Wollaston prism, D: balanced detector.
Fig. 2.3 Diagram of auto-correlation geometry.
Fig. 2.4 The SHG intensity autocorrelation at zero time delay.
Fig. 2.5 Diagram of knife edge measurement technique.
Fig. 2.6 Transmission function: (a) Transmission of THz at focal plane (b)
Derivative of the transmission function at the THz focal plane.
Fig. 2.7 Etalon effect in the ZnTe sensor crystal.
Fig. 2.8 Etalon effect induced THz echos in spectra.
Fig. 2.9 (a) THz waveform and (b) THz spectrum in air.
Fig. 2.10 (a) THz waveform and (b) THz spectra in dry-atmosphere
Fig. 2.11 (a) Schematic setup of nonlinear THz experiments; blue cone and line is the SHG signal; L: lens, C: ZnTe crystal, P: picarin lens, B: bolometer, PMT: photon multiplier tube; (b) Diagram of the THz Z-hole measurement.
V
Fig. 2.13 Closed symbols: THz intensity as a function of the ZnTe azimuthal angle.
Open circles: SHG intensity upon focusing. Open squares: transmission at 800 nm.
Fig. 2.14 (a) THz intensity as a function of the distance to focus point (open aperture z-scan). Pump power 300 mW. (b) Circles: SHG power. Squares: transmission at 800 nm. Solid line, right axis: fit of the TPA equation (nonlinear absorption coefficient β = 4.6 cm/GW). Solid line, left axis: fit of the SHG.
Fig. 2.15 Symbols: measured THz intensity. Thin solid line: expected THz emission
z-dependence for large z, when the THz source is larger than the typical THz wavelength. Dashed: expected THz emission z-dependence in the diffraction limit (small excitation spot size). Thick solid line: THz emission z-dependence including TPA only. Dotted line: THz emission including only FCA generated by SHG. Dash-dotted line: THz emission including only FCA generated by TPA.
Fig. 2.16 (a) Image (b) Diagram of interdigitated electrodes on SI-GaAs substrate.
Fig. 2.17 Diagrm of interdigitated SI-GaAs photoconductive antenna.
Fig. 2.18 Schematic diagram of THz-TDS; L: lens, M: mirror, BS: beamsplit, P: off-axis parabolic mirror, τ: time delay, A: ZnTe sensor, B: λ/4 waveplate, C: Wollaston prism, D: balanced detector.
Fig. 2.19 I-V curve of photoconductive antenna.
Fig. 2.20 (a) THz waveform (b) THz Spectra of antenna at different bias field.
Fig. 2.21 Bias dependence of THz emission intnsity of antenna (A) Peak signal (B) integrated signal.
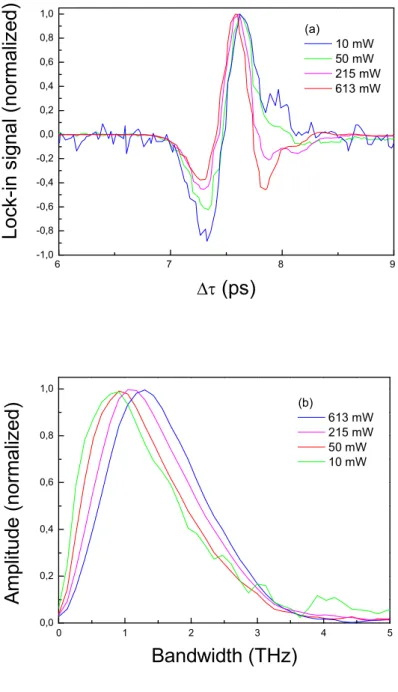
Fig. 2.22 The (a) THz waveform (b) THz spectra of antenna at different pump power.
Fig. 2.23 Laser waist.
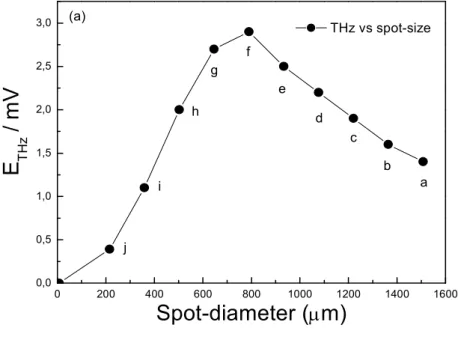
Fig. 2.24 (a) THz intensity vs spot-size; (b) THz waveform vs spot-size.
VI
Fig. 2.26 THz waveform of antenna at different exciting power and different
temperature: (a), (c), and (e) refers to the THz waveform at 100mW, 250mW and 400mW pump power; (b), (d), and (f) refers to the THz bandwidth at 100mW, 250mW and 400mW pump power; rectangular: 4.2K, circle: 70K, up-triangle: 150K, down-triangle: 240K.
Fig. 3.1 Diagram of intersubband transition in an active region of QCL.
Fig. 3.2 Diagram of Bound-to-Continuum Interminiband Transition.
Fig. 3.3 Diagram of THz mode Confined by Surface Plasmon Waveguide.
Fig. 3.4 Schematic setup of L-I curve and V-I curve measurement.
Fig. 3.5 I-V curve of 2.9THz QCL under different temperature.
Fig. 3.6 The resistance of QCL at different injection current.
Fig. 3.7 The L-I curve of QCL at different temperature.
Fig. 3.8 The threshold of 2.9THz QCL at different temperature.
Fig. 3.9 THz amplification at different injection current.
Fig. 3.10 THz waveform of amplificated signal transmitted through the 2.9 THz QCL.
Fig. 3.11 Gain and phase difference of 2.9THz QCL.
Fig. 3.12 (a) Amplified THz waveform at different injection current; (b) Amplified
THz spectra at different injection current.
Fig. 3.13 (a) Amplified THz waveform at different temperature; (b) Amplified THz
spectra at different temperature.
Fig. 3.14 Threshold current of 2.9THz QCL at different temperature.
Fig. 3.15 Gain function of 2.9THz QCL at different temperature.
Fig. 4.1 Diagram of 3 kinds tellurium oxide entities.
Fig. 4.2 Qualitative molecular orbital diagram of TeO4 tbp (left) and TeO3 tp
(right) NBO: non-bridge oxygen orbit. Eg: energy gap between HOMO
VII
Fig. 4.3 Schematic diagram of DFWM experimental setup; M: reflective mirror,
BS: beam-split, D: photodiode, PC: computer, S: sample, L: lens.
Fig. 4.4 Schematic diagram of Z-Scan experimental setup; M: reflective mirror, BS: beam-split, D: photodiode, PC: computer, S: sample, L: lens.
Fig. 4.5 Raman spectra of 6 kinds samples.
Fig. 4.6 (a) The image of AgCl nanocrystalss embedded inside a glass fragment; (b) the SAED pattern of AgCl nanocrystalss in the glass.
Fig. 4.7 FESEM image of the glass sample thermally treated for (a) 30minuetes, (b) 60minuetes, (c) 90minuetes, and (d) 120minuetes.
Fig. 4.8 The size distribution of Ag.Cl nanocrystals for the heat treatment of 30 (a), 60 (b), 90 (c) and 120min (d), respectively.
Fig. 4.9 Absorption spectra for the glass samples with different heat treatment time.
Fig. 4.10 Photoluminescence of thermal treated samples.
Fig. 4.11 Diagram of electron transition of glass under 800nm femtosecond laser excitation
Fig. 4.12 DFWM experimental data and the Gaussian fitting lines.
Fig. 4.13 Optical limiting of the AgCl nanocrystals doped glass samples with
different thermal treatment time.
Fig. 4.14 Open-aperture z-scan curves of the AgCl nanocrystals doped glass samples
VIII
Contents
General Introduction . . . 1
Part 1 1 Principle of THz Time Domain Spectroscopy . . . .. . . 5
1.1 Introduction . . . 5 1.2 THz Generation . . . 6 1.2.1 Optical Rectification . . . .6 1.2.2 Photoconductive Antenna . . . .7 1.3 THz Detection . . . 9 1.3.1 Bolometric Detection . . . 9
1.3.2 Free Space Electro-Optic Sampling . . . 10
1.4 THz Collimation . . . .13
1.4.1 Lens Collimation . . . 13
1.4.2 Parabolic Collimation . . . 13
1.5 Analysis of THz Spectrum . . . 14
2 Development of THz-Time Domain Spectroscopy . . . 15
2.1 Introduction . . . 15
2.2 Ultrafast Laser Source. . . .15
IX
2.3.1 Alignment of THz-TDS. . . .16
2.3.2 Signal-Noise-Ratio Optimization . . . 19
2.3.3 Measurement of THz Focal Area. . . 20
2.3.4 Thickness of ZnTe Emitter and Sensor . . . 21
2.3.5 The Water Influence . . . 24
2.3.6 The Competition between THz Generation and other Nonlinear Optical Effect . . . 25
(A) Experiment . . . 25
(B) Result and Analysis . . . 27
2.4 THz - TDS with a Microstructured - Photoconductive Emitter . . . .34
2.4.1 Structure of Emitter . . . 34
2.4.2 Characterization Experiment . . . . . . 36
2.4.3 Result . . . . . 37
(A) Bias Dependence of THz Emission . . . 37
(B) Space Charge Screening . . . .40
(C) Optimization of Incident Spot-Size in Emitter . . . .41
(D) Temperature Dependence of Emitter . . . .43
2.5 Summary . . . .48
3 Application of THz-TDS: Gain Measurement in a 2.9 THz Quantum Cascade Laser . . . .49
3.1 Introduction . . . . . . .49
3.2 Basic of THz-QCL . . . .49
X
3.4 Characterization of THz QCL . . . 54
3.4.1 Experiment . . . 54
3.4.2 Result and Analysis . . . 55
3.5 Gain Measurement of THz QCL using THz-TDS . . . .59
3.5.1 Observation of 2.9THz Spectral Amplification . . . 59
3.5.2 Gain Measurement at Different Injection Current. . . .60
3.5.3 Temperature Dependence of Gain . . . 67
3.6 Summary . . . .69
Part 2 4 Optical Nonlinearities of AgCl Nanocrystalss doped Niobic Tellurite Glasses . .70 4.1 Introduction . . . 70
4.1.1 3rd Order Optical Nonlinearity . . . 70
4.1.2 Tellurite Glasses . . . 71
4.2 Experiments . . . .73
4.2.1 Fabrication of AgCl Nanocrystalss doped 80TeO2-20Nb2O5 Glasses. 73 (A) Melting-Quenching . . . 73
(B) Thermal Treatment . . . 73
4.2.2 The Grain-Size Characterization of AgCl Nanocrystalss. . . 73
4.2.3 Spectral Characterizations . . . 74
(A) Raman Spectroscopy. . . .74
(B) Absorption Spectroscopy. . . .74
XI
4.2.4 Measurements of Nonlinear Optical Properties . . . .74
4.3 Results and Discussion . . . .76
4.4 Summary . . . 87 Conclusion . . . 88 Reference . . . . . . 90 Appendix A . . . 105 Appendix B . . . 109 Appendix C . . . 111 Appendix D . . . 116 Appendix E . . . 118 Appendix F . . . 120 Publication List . . . 121
- 1 -
General Introduction
With the development of compact femtosecond lasers, ultrafast spectroscopy [1-3] has become a powerful tool for investigating the carrier dynamics in semiconductor nanostructure. Recently, the special attention was dedicated to the long-wavelength edge of far-infrared spectrum between 300 gigahertz (3x10¹¹ Hz) and 3 terahertz (3x10¹² Hz), corresponding to the sub-millimeter wavelength range between 1mm and 100 µm. This spectral range is called terahertz (THz) or the THz gap (due to the major lack of emitters or detectors in this spectral range)[4,5]. It is useful to have the following numbers in mind:
1THz↔330µm↔1picosecond↔4.1meV↔10K
THz waves have a unique character. There are non-ionizing and share with microwaves the capability to penetrate a wide variety of non-conducting materials such as clothes, plastic, wood, sand and soil. Some chemical materials such as gas and liquid have unique spectral fingerprints in the THz band. These properties and the recent development of new techniques triggered special interest both for applications (in imaging, gas sensing etc) as well as for new fundamental physics experiments. With respect to the present work, we underline the development of terahertz time-domain spectroscopy (THz-TDS) [6-10] to investigate the semiconductor nanostructures.
The generation and detection of “T-Rays” had been unknown for a long time, which hampered the development of this technique, until the 1970s. Yang Richard and Shen at Berkeley, Yajima and Takeuchi in Japan presented respectively the demonstration of far-infrared (FIR) generation due to the optical rectification with use of second order nonlinear crystal and picosecond pulses. Nonlinear optical rectification was proposed as the first mean to generate far-infrared radiation. Meanwhile, Auston and Lee at AT&T bell laboratory used ultrashort laser pulses to excite Cr-doped semi-insulating GaAs (SI-GaAs) in “photoconductive switches” to generate far-infrared radiation. Until today, the aforementioned two THz generation methods (optical rectification and photoconductive methods) are successfully used in THz-TDS. The basics about THz-TDS, THz generation and THz detection are given in the Chapter 1.
Compared with other nonlinear crystals, <110> ZnTe crystal have the merit of large second-order nonlinear susceptibilities, have well-suited phase-matching properties [11,12] and so are
- 2 - good optical rectification devices, widely used for THz generation [13-16]. Current challenges in this field concern the competition between optical rectification and other nonlinear processes such as second harmonic generation (SHG), two-photon absorption (TPA) and free-carriers absorption (FCA) [17-21]. Moreover, when the exciting laser spot size becomes smaller than the typical THz wavelength, it induces a decrease of the THz generation due to diffraction [20,22]. Nevertheless, to date, existing analysis of these phenomena are not comprehensive and the explanations are sometimes even contradictory [20,21]. In particular, the effect of free carrier absorption [23] on the THz radiation was neglected in previous studies. While developing a first THz-TDS setup in LPA at ENS, we contributed to this field (Chapter 2) and determined the best conditions for generating THz in our experiment.
On the other side, the technique and the physics of photoconductive antennas are still progressing. Of particular interest for the present work, Dreyhaupt et.al. [24,25] and Hattori et.al. [26] discovered the practical advantages of generating THz using interdigitated photoconductive antennas (at room temperature). The temperature effects are known since Markel et.al.[27] in conventional photoconductive antennas. Rodriguez et al. [28] found that space charge screening (SCS) results in a “bipolar” THz temporal waveform and a THz spectral blue-shift but they ignore temperature dependence of SCS. Nathan Jukam, in LPA at ENS, recently fabricated an interdigitated photoconductive antenna for our THz-TDS setup. We characterized it as a function of temperature and excitation power.
In 1994 [29], a new infrared semiconductor emitter appeared: the quantum cascade laser (QCL), first demonstrated by Faist et al. at Bell Laboratories. A QCL comprises a periodic series of thin layers of varying material composition forming a superlattice. The superlattice introduces a varying electric potential across the length of the device, inducing a varying probability for the electrons to occupy different positions over the length of the device. This is referred to as one-dimensional multiple quantum well confinement and leads to the splitting of the bands of permitted energies into a number of discrete electronic subbands. By suitable design of the layer thicknesses it is possible to engineer a population inversion between two subbands in the system which is required in order to achieve laser emission. Since the position of the energy levels in the system is primarily determined by the layer thicknesses and not the material, it is possible to tune the emission wavelength of QCLs over a wide range in the same material system. The revolutionary progress occurred in 1998, when Sirtori et al. [30] designed the first THz QCL by bandgap engineering, making QCL a THz source. From then on, THz QCL stimulates strong competition for new designs and fabrication techniques [30-32].
- 3 - Terahertz quantum cascade lasers have shown considerable development over the last few years, with operation extended to low frequencies [33], sub-wavelength dimensions [34,35] above liquid nitrogen temperature operation [36,37].
Current challenges, however, include further performance improvements and an understanding of the fundamental gain and loss mechanisms within the QCL. To achieve these goals, novel characterization methods are required to determine key parameters such as the spectral gain and losses, as well as the dynamics that governs the QCL[38,40]. Karl Unterrainer et al.[41,42] first succeeded in measuring the gain in THz QCL with THz-TDS. Considering the performances of THz-TDS, one can use it to measure the gain of THz QCL. After developing our own THz-TDS setup, we used it to study the gain in THz-QCL. Chapter 3 reports on the first results we obtained.
For practical reasons, part of this PhD work was done in France and part of it in China on a slightly different topic. The final chapter 4 concerns the ultrafast dynamics of AgCl nanocrystalss doped tellurite niobic glass. Tellurite glass possesses broad optical transparency, low melting temperature [43,44], and so they have become prospective nonlinear optical materials for photonic devices such as Raman amplifier [45-47], saturable absorber [48], photoluminescence and up conversion fiber [49-51], etc. Many researches indicate that tellurite glass exhibits large nonlinear refractive index (n2) with femtosecond response time, 40 times
larger than that of the silicate glass, and it is a potential candidate in ultrafast optical switching [49]. Recently, many efforts have been made for enlarging n2 and increasing its
transparency by varying the composition of tellurite glass. Moreover, tellurite glass has good nonlinear absorption β, and it can be used as a potential candidate of optical power limiter. Since 1980s [53-56], semiconductor nanocrystalss doped glass (SDGs) rise important attention due to exciton enhancement induced colossal nonlinear refractive index n2. However, their
temporal response is generally in the picosecond range, accompanied with large absorption coefficients [53], which diminishes the figure of merits for optical switching. In order to enlarge n2 at transparency region of glass, a new effort is made to implant nanocrystals inside
glass matrix. Cotter et al. [57] first studied large n2 at non-resonant region of SDGs, and then
most efforts [53,54,58~60] concentrated on the n2 enhancement of silicate glass doped with II-VI
compound nanocrystals such as CdS, CdSe, CdSSe, CdTe, etc. and much larger n2 than
silicate glass can be obtained by implanting semiconductor nanocrystalss inside tellurite host matrix. Compared with silicate glass, tellurite glass has much higher n2, and so good tellurite
- 4 - glass with rather larger n2 can be obtained by implanting semiconductor nanocrystalss inside
tellurite host matrix. Taking account of the glass transition temperature (450°C) of the tellurite host matrix, the I-VII compound AgCl with lower growth temperature than that of II-VI compounds is doped inside tellurite niobic glass matrix. To our knowledge, there is no report on the AgCl nanocrsytal doped tellurite glass, and furthermore, its nonlinear absorption coefficient and optical limiting have not been investigated.
In this last chapter 4, AgCl nanocrystalss doped niobic tellurite glass (80TeO2-20Nb2O5) are
prepared with melting-quenching and thermal treatment method. The AgCl nanocrystals structural properties are investigated with high-resolved transmitted electron microscopy (HRTEM) and scan field-emission scanning electron microscopy (FESEM). The UV-visible absorption spectrum was measured by absorption spectrometry, and the non-resonant third-order nonlinear susceptibility χ(3) was measured by degenerate four wave mixing (DFWM). The optical limiting and nonlinear absorption were investigated by Z-scan technique.
- 5 -
Chapter 1
Principle of THz-Time Domain Spectroscopy
1.1 Introduction
In the chapter 1, we first describe the essential parts of a standard THz-Time Domain Spectroscopy (THz-TDS) set-up. Fig. 1.1 is a schematic diagram of a THz-TDS spectrometer, which is based on the pump-probe like geometry. It consists in a femtosecond laser source, a beam-splitter, a variable delay line, a THz emitter, THz collimating components and a THz detection system. A computer controls the acquisition as well as the displacement of the delay-line.
Fig. 1.1 Schematic diagram of a THz-TDS spectrometer
In the following, we describe (i) the typical THz generation methods that rely either on optical rectification of an ultrafast near-IR laser pulse in a nonlinear crystal, or on photoconductive antennas; (ii) after briefly reminding the principle and limits of the bolometric detection in the
- 6 - context of our work, we describe the principle of THz detection using Free-Space Electro-Optic Sampling (FSEOS); (iii) the main characteristics of THz collimation components and (iv) the principle of the spectrum analysis.
1.2 THz generation
1.2.1 Optical Rectification
The optical rectification is a unique 2nd order nonlinear optical effect which appears in anti-centrosymmetric crystals [61-72]. Typical crystals are <110> zinc telluride (ZnTe) or gallium phosphide (GaP). A near-IR ultrashort laser pulse is used to excite a transparent nonlinear crystal that emits a THz radiation. The THz emission from optical rectification is described diagrammatically in Fig. 1.2.
Fig. 1.2 Diagram of optical rectification and THz emission
Optical rectification can be seen as a difference frequency mixing between the frequency components given by the broadband near-IR laser pulse and occurs in media with a large second order susceptibility χ(2). The nonlinear polarization induced in the material can be written as: ( )
(
)
( )( ) ( ) ( ) ( )
( )( ) ( ) ( )
[
(
)
(
)
]
( )2 ( )2 2 1 2 1 2 1 2 2 1 2 1 2 2 1 2 cos cos 2 1 cos cos SHG OR ijk ijk P P t E t E t t t E t E P + = + + − = = = + = ω ω ω ω ω χ ω ω χ ω ω ω , (1.1)where P is the polarization, χ is the nonlinear susceptibility, E is the electric amplitude of incident beam. The subscript OR and SHG correspond to the optical rectification and second harmonic generation term. The above equation shows that optical rectification is directly
Laser pulse, Δτ :100fs, λ :800nm
Nonlinear crystals
- 7 - proportional to the incident wave intensity, and is in general time-dependent. Because of the dispersion in the nonlinear crystal, the phase matching condition is wavelength limited. Second harmonic generation is inevitable, but since the beams probe different refractive indexes, the phase-matching condition is different. Besides phase matching, the generated THz spectrum is affected by the laser pulse duration, the crystal absorption and thickness. As shown in Chapter 2, a typical THz-TDS system based on commercial 100-fs Ti:sapphire laser generates frequencies up to 3-4 THz (frequencies up to 50 THz can be reached with shorter pulses and adapted crystals). Last, we note that since optical rectification relies on high intensity laser pulses and since the nonlinear crystal is excited in its transparency region, this technique is very well suited to excitation with amplified Ti:sapphire lasers (using an regenerative amplifier). Photoconductive antennas tend to provide better results when working with an non-amplified system. More details about optical rectification can be found in Appendix A.
1.2.2 Photoconductive Antenna
Photoconductive antennas are very popular for generating and detecting THz pulses [73-74]. Here, a semiconductor (typically GaAs) is excited across the bandgap by a near-IR laser pulse to generate carriers (electron-hole pairs) that will be accelerated by an applied bias voltage
[74-93]
. The bias accelerates the newly formed carriers, yielding a transient current (the insulating system becomes conductor). The THz bandwidth is here firstly limited by how fast the carriers can be accelerated or by the carrier lifetime, rather than by the laser pulse duration. Short carrier lifetime can be achieved using low-temperature (LT) or semi-insulating (SI) GaAs. This type of source is typically used with oscillator-only, i.e., non-amplified systems. A generic setup is shown in Fig. 1.3.
For applying the bias, transmission lines are deposited lithographically onto an undoped GaAs wafer. The parallel metal strips of the transmission lines are separated by a certain distance that can range from few µm to centimetres (depending on the required field and input laser power). A dc bias voltage (typically tens of Volts) is applied across the gap via wires bonded to pads at the end of each strip with indium metal. When a near-IR pulse from the Ti:sapphire illuminates the semiconductor surface between the metal strips, the acceleration of the photocreated electrons in the dc field radiates a sub-picosecond THz pulse, which is usually
- 8 - collimated by a crystalline quartz or silicon hyperhemispherical lens and off-axis paraboloidal mirrors.
Fig. 1.3 Diagram of THz emission from photoconductive antenna
The acceleration of carriers in the bias field is the most critical aspect of the problem for THz emission. This is the process that determines the temporal evolution of the initial transient photocurrent. It can be regarded as involving an initial ballistic acceleration of the carriers on a time scale shorter than the carrier scattering time, followed by an approach to the drift velocity. At low carrier densities and room temperature, phonon-scattering dominates the scattering process and the scattering time typically does not exceed a few tenths of a picosecond. The carrier-carrier scattering time may also be important when considering transport phenomena, since these collisions can change the momentum in the electron or hole subsystem. Electron-electron scattering, although it does not contribute to the current relaxation due to momentum conservation, plays an important role in establishing thermal equilibrium among the electrons. The carrier scattering rate is the key parameter in the description of transport. Carrier acceleration subsequent to photo-generation of an ensemble of carriers will persist for a time on the order of scattering time as the steady-state carrier drift velocity is reached. This behavior is captured in the time-dependent mobility function of carriers (see appendix B).
+ - Biased photoconductive antenna
Laser pulse,
Δτ :100fs, λ :800nm
- 9 -
1.3 THz Detection
1.3.1 Bolometric detection
Traditional bolometric detection allows measuring the total energy of a THz pulse and not the amplitude of the THz electric field over time, as in FSEOS. As a consequence, bolometric detection is not suited for THz-TDS. Nevertheless, we used a bolometer to realize part of the work accomplished during this PhD and this paragraph is dedicated to briefly describe the principle this detection technique. A bolometer measures the variation in the radiation absorption and converts this into a measurable quantity such as a voltage or current [94-98]. It can be used to measure the radiation for most wavelengths. However, for sub-millimeter wavelengths (from around 200 µm to 1 mm wavelength), the bolometer is the most sensitive type of detector for any measurement (though records with free-space electro-optic sampling have shown that this technique can be comparable). Typically, a bolometer consists of an absorber and a thermometer of heat capacity C, connected by a small thermal conductance G, to a heat sink held at a fixed temperature T0 (Fig. 1.4 : left). The energy E of the incident
radiation is converted into heat in the absorber, leading to a temperature rise C
E T T
T = i − 0 = , until the radiation power flowing into the absorber is equal to the power flowing into the heat sink through the weak thermal link. The temperature rise is subsequently measured and is directly proportional to the deposited energy. Suppose an incident electromagnetic radiation with frequency ω is absorbed by the bolometer, the temperature will be modulated by Tbolo =T0 −T1eiωt where T0 is equal to T0 =Ts +T0 G0 and T1 =Q1 G
( )
ω . In the bolometer, it composes of two processes: energy dispersion and storage.- 10 - The first process can be written as:
(
)
( )
i T sdis G T T G Te
Q = 0 0 − + ω 1 ω , (1.2) and the storage process by:
(
)
[
]
i T s bolo stock C T T i CTe dt d Q = ⋅ − = ω 1 ω , (1.3)The balance equation of bolometer is:
(
)
( )
i T i T s T i T i Te G T T G Te i CTe dT dR I R I e Q Q ω 2 1 ω 0 0 ω 1 ω ω 1 ω 0 2 1 0 + + + = − + + , (1.4)The sensitivity expression is then:
− + = ⋅ ⋅ = = C i dT dR I G dT dR I P T dT dR Q V S ω 2 1 1 1 1 , (1.5)
From this expression, one can conclude that the sensibility is related to the load resistance RL
and RL>>R.
1.2.2 Free-space electro-optic sampling
Two common detection techniques are used in THz-TDS: electro-optic or photoconductive sampling. In both techniques, a reference near-IR pulse (from the same laser source as the one that generates the THz pulses) illuminates the detection system at the same time and position as the THz pulse to be detected. The detection system will then react differently depending on the value of the amplitude of the THz electric field. These techniques are coherent and as a consequence the noise is low (the time window of the measurement is very small). With respect to the bolometric detection, the advantages are (i) the system does not need to be cooled to cryogenic temperatures (ii) the detection is insensitive to incoherent radiation (thermal noise) (iii) the detection provides the complex THz electric field and not only the intensity. Photoconductive sampling relies on similar principles as photoconductive emission (but in a reversed process) and will not be discussed here. We will concentrate on FSEOS which was used in the present work.
- 11 - The schematic diagram of FSEOS[99-105] is shown in Fig. 1.5 and briefly described in the following. The crystal used for the generation by optical rectification can be used for the detection relying here on the Pockels effect. A reference near-IR pulse is incident on an optical bridge: the linear polarization of the laser beam is transformed into a circular polarization by a λ/4 waveplate. A Wollaston prism separates the parallel and horizontal polarization components. The two resulting beams are sent onto a photodiode balance. In the absence of THz radiation and when the system is correctly aligned, the difference in intensity onto the two photodiodes is zero. In the presence of a THz electric field (arriving at the same time and position as the near-IR pulse), the polarization of the reference beam is modified by Pockels effect, resulting in an intensity difference between the photodiodes. The difference in intensity is proportional to the amplitude of the THz electric field. By changing the position of the delay line, one can then reconstruct the temporal evolution of the THz field. More details can be found in Appendix C.
Fig. 1.5 Diagram of Free Space Electro-Optic Sampling (FSEOS)
The incident THz pulse induces a birefringence in the ZnTe crystal, which gives rise to a phase retardation of the linearly polarized probe laser beam, described as follows:
0 41 3 0 0 41 3 0 0 2 1 2 1 n n E r n n n E r n n n z THz y THz x = − = + = , (1.6)
- 12 -
(
)
THz THz y x THz I I E r n l n n l Γ = ∆ = − = Γ 3 41 0 2 2 λ π λ π , (1.7)By recording the phase retardation, the THz field amplitude can be detected. Both the polarization of THz pulse and probe laser beam are aligned parallel to [110] direction of ZnTe sensor crystal. The Wollaston prism behind the λ/4 wave-plate converts the THz-induced phase retardation of the probe beam into an intensity modulation between the 2 perpendicularly polarized probe beam components. The difference signal is feed back to the lock-in amplifier referenced at a frequency chopping the pumping optical beam to generate the THz radiation.
Fig. 1.6 Diagram of THz detection in FSEOS
In FSEOS, there is a clear trade-off between the sensitivity and frequency response that is determined by the thickness of ZnTe sensor crystal. A thicker crystal produces a greater interaction length, but on the other hand it reduces the detection bandwidth due to group-velocity mismatch. The most distinct advantages of FSEOS are broad-bandwidth detection range and ease of implementation. The shortcoming of FSEOS is that it is very sensitive to laser noise and low-frequency mechanical and acoustical disturbances.
- 13 -
1.4 THz Collimation
1.4.1 Lens collimation
This method is in principle equivalent to the using lenses in geometric optics. However, the lens materials need to be transparent in the THz range. The refractive index nTHz and
absorption coefficient αTHz within the THz frequency range become the key parameters (see
Table 1).
Table 1.1 Refractive index and absorption coefficient of THz transparent materials [2]
Materials nTHz αTHz (cm-1) TPX 1.48 <0.01 Picarin 1.56 <0.01 Sapphire 3.04 <4 High-resistivity Silicon 3.42 <0.1 GaAs 3.59 0.1~3
High-resistivity silicon is silicon with high intrinsic resistivity ρ=10kΩ.cm. Polymer materials display lower absorption at THz frequencies than inorganic solid. Picarin has the advantage of having the same refractive index in the THz range as in the visible, which allows easier alignment of the system (but the material is soft, fragile and polishing into lens shapes remains difficult and expensive).
1.4.2 Parabolic collimation
The most common technique to collimate the THz diverging radiation is to use off-axis parabolic mirrors. Four off-axis parabolic mirrors are typically needed in a THz-TDS set-up. Alternatively, two ellipsoidal mirrors can be used since they offer two focal points at finite distance. Nevertheless, parabolic mirrors are easier to manipulate.
- 14 -
1.5 Analysis of the THz spectrum
The paragraph briefly describes a method to extract physical parameters from a THz-TDS spectrum. THz time domain spectroscopy allows measuring the transmission through a material, giving access to physical parameters by measuring the complex function T(ω)
[106-109]
. It is obtained by measuring the THz beam going through the sample and a reference beam bypassing it:
( )
( )
( )
ω ω ω THz ref THz Sam E E T = , (1.8)where Eref(ω) is the transmitted THz radiation in free space and Esam(ω) is the sampling THz
radiation. The transmitted complex function is composed of different frequency components so that one can extract the phase and amplitude of sampling signal by Fourier transformation. This function contains the physical material parameters through the complex refractive index:
κ
i n
n~= − . The real and imaginary parts can be deduced by calculation from the transform function T(ω):
( )
( )
( )
ω[
(
φ( )
ω φ( )
ω)
]
ω ω 2 1 1 2 exp− − = i A A T , (1.9)where A(ω) and φ(ω) correspond respectively to the magnitude and phase of the THz beams. With d the thickness of sample, n the refractive index and α the absorption coefficient, one can deduce:
( )
(
φ( )
ω φ( )
ω)
π ω 2 1 2 1+ − = fd c n , (1.10)( )
( )
( )
− = ω ω ω α 1 2 ln 1 A A d , (1.11)- 15 -
Chapter 2
Development of THz-Time Domain Spectroscopy
2.1 Introduction
In Chapter 1, we reminded briefly the basic concepts of THz-Time Domain Spectroscopy. In this Chapter 2, we present the THz-TDS system that we developed in the laboratory. We describe the laser source, the alignment and the signal optimization procedures. As reported above, THz generation can be achieved either by optical rectification of by using photoconductive antennas. Here, the two methods are tested. Concerning the first method, we investigate in particular the competition between optical rectification (in <110> ZnTe) and other non-linear processes. Upon focusing, for excitation sizes smaller than the THz wavelength, Second Harmonic Generation (SHG), Two Photon Absorption (TPA) as well as Free Carrier Absorption (FCA) are observed while THz emission is strongly reduced. While TPA is responsible for the optical pump depletion, we find that FCA cannot be neglected as often assumed in the past. Both contributions are found to be of the same order of magnitude. The conditions for the most efficient THz generation are described. Then, we study THz generation in an interdigitated SI-GaAs photoconductive antenna. As compared to traditional photoconductive antennas, this new scheme allows generating THz on a large surface (thus minimizing diffraction effects), under the application of a moderate bias voltage. The structure is characterized versus temperature and exciting carrier density.
2.2 Ultrafast Laser Source
Optical rectification, photoconductive antennas and free-space electro-optic sampling are driven by femtosecond pulse laser excitation. Our Laser system is composed of a Coherent Verdi-V8 solid-state pump laser (wavelength: 532nm, output power: 8W) and a Coherent MIRA900F Ti:sapphire oscillator (center wavelength: 800nm, medium pulse duration: 100fs, repetition rate: 76MHz).
- 16 -
780 790 800 810 820
Wavelength / nm
Fig. 2.1 Laser pulse spectrum
The full width at maximum height (FWMH) of the laser pulse spectrum is about 15nm. Assuming the pulse is Fourier-Transformed limited, one can deduce the pulse duration. The typical pulse duration is 100fs. The particular optics and birefringent filter (for wavelength selection) chosen in this laser system allow to reduce the pulse duration to below 80 fs when necessary. The output power is usually maintained at 1.5W (mode-locked).
2.3 THz-TDS with ZnTe emitter
2.3.1 Alignment of THz-TDS
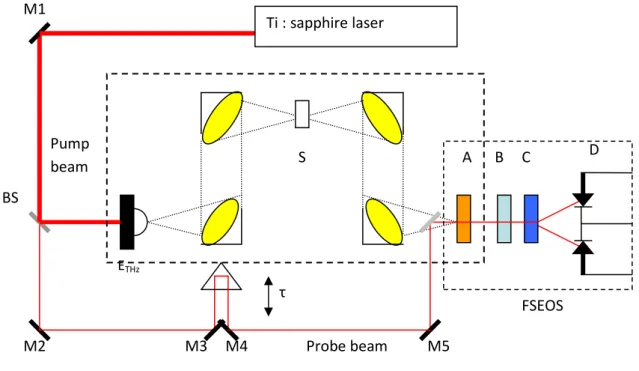
The scheme of our THz-TDS system is shown as follows in Fig 2.2. In the case of optical rectification with a <110> ZnTe crystal emitter, the pump beam is modulated by a mechanical chopper. In the case of photoconductive antennas, an Agilent functional generator drives the antenna (at a frequency which triggers the Lock-In simultaneously). The laser beam is focused onto the surface of THz emitter with a 4cm focus lens. As discussed in details in the next section, for optical rectification, optimum THz generation is achieved when the ZnTe crystal is slightly out of focus. Off-axis parabolic mirrors (PM) collimate the parallel beam.
- 17 - The PMs used in the present work (Janos) have a 100mm diameter, 15.2cm focal length and 90° angle. The four PMs are positioned on xy-stages in order to adjust the distance between emitter and PMs. The focus of first PM has to overlap with the light spot on the THz emitter. In practice, this adjustment can be achieved by replacing the THz emitter by tracing paper, which diffuses the incoming laser beam and makes the alignment easier. In order to recombine the THz beam and the probe beam collinearly into the ZnTe sensor, one can use a pellicle beam splitter (between mirror M5 and the sensor A) which reflects the near-IR beam while transmitting the THz radiation. Nevertheless, a pellicle beam splitter is generally sensitive to mechanical vibrations which easily induce additional noise. An alternative solution consists in using a small (2x2mm) metallic mirror which is more stable and which shadows only a little part of the THz beam.
Fig. 2.2 Schematic diagram of THz-TDS; S: sample, M: mirror, BS: beam-splitter, τ: time delay, ETHz: THz emitter (ZnTe crystal or photoconductive antenna), A: ZnTe
sensor, B: λ/4 waveplate, C: Wollaston prism, D: balanced detector.
The water present in the atmosphere strongly absorbs the THz radiation. An air-tight box, filled in with nitrogen gas or dry air, was fabricated. It comprises all the optical components from the emitter to the ZnTe sensor.
Ti : sapphire laser τ BS M2 M5 M1 M3 M4 ETHz FSEOS S A B C D Probe beam Pump beam
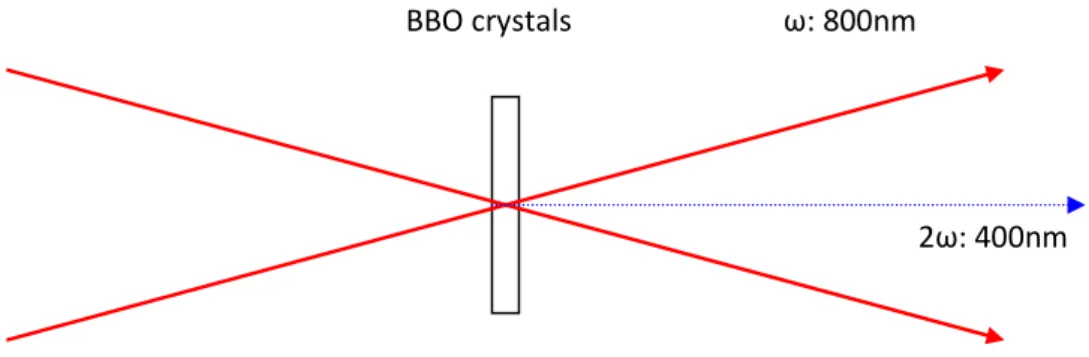
- 18 - The final step is to determine zero time delay and spatial overlap between the probe beam and the THz beam onto the ZnTe sensor. At this stage, the alignment procedure is very difficult: (i) the pre-alignment of the PMs may not be good enough, (ii) the focalization of the THz spot on the ZnTe sensor may not be optimum, (iii) for a first use of the ZnTe sensor, its neutral axis may not be known, (iv) the spatial and temporal is not determined yet, (v) the expected THz signal is weak. In a preliminary alignment, the spatial-temporal overlap is approached by performing an autocorrelation measurement. This is done by removing the THz emitter and replacing the ZnTe sensor by a type-I BBO crystal (0.5 mm). The autocorrelation measurement is then performed between the near-IR pump and the probe beams. The autocorrelation intensity is given by:
( )
( ) (
)
A τ +∞I t I t τ dt −∞
=
∫
− , (2.1)The signal generated in the second-harmonic-generation crystal is proportional to (E(t)+E(t−τ))2. Only the beam propagating on the optical axis, proportional to the cross-product E(t)E(t−τ) are detected (see Fig. 2.3). This signal is then recorded by a slow detector, which measures
( )
( ) (
)
2( ) (
)
M I τ +∞ E t E t τ dt +∞I t I t τ dt −∞ −∞ =∫
− =∫
− , (2.2)IM(τ) is the intensity autocorrelation A(τ).
For a Gaussian time profile, the autocorrelation width is 2 longer than the width of the pulse (and 1.54 longer in the case of an hyperbolic secant squared (sech2) pulse).
Fig. 2.3 Diagram of the auto-correlation geometry
BBO crystals ω: 800nm
ω: 800nm
- 19 - The SHG signal was detected with a photon multiplier (PMT) driven at a voltage of 1KV. The autocorrelation second harmonic generation signal (SHG) is shown in Fig. 2.4. The pulse duration is typically 100 fs in the experiments presented in this work.
-400 -300 -200 -100 0 100 200 300 400 0,0 0,5 1,0
In
te
n
s
it
y
(
a
.u
.)
∆τ
(fs)
Fig. 2.4 The SHG intensity autocorrelation at zero time delay
2.3.2 Signal-to-Noise Ratio optimization
The optimization of the signal-to-noise (SNR) ratio is critical in THz-TDS experiments. Obtaining record SNR ratio (that can reach values as high as 106 to 107) is not the goal of the present work. Common values of the S/N typically reach 104 to 105 after a careful optimization. We underline here the several problems that we met while searching for the first THz signal and optimizing the SNR:
- The THz beam and the probe beam can be recombined collinearly into the ZnTe sensor with a pellicle beam splitter (which reflects the near-IR beam while transmitting the THz radiation: see Fig. 2.2) or a small mirror. Nevertheless, a pellicle beam splitter was found to be very sensitive to mechanical vibrations. We chose to use a small (2x2mm) metallic mirror which is more stable and which shadows only a little part of the THz beam. The SNR was improved from 15µV/Hz to 0.4µV/Hz.
- 20 - - The laser noise and stability was carefully checked with a spectrum analyzer. In optimum conditions, the laser noise is limited to the standard quantum limit (shot noise) at high frequency. High frequency modulation of the laser beam can be reached with an acousto-optic modulator. At the low frequency (kHz range) of a mechanical chopper, the situation is more critical. In our experiment, mechanical noise sources (induced by pumps or by the chopper itself) were identified using the spectrum analyzer, and reduced to a minimum.
- Important gas (nitrogen or dry air) fluctuations in the dry box induce additional noise. The gas pressure was controlled in order to minimize the noise.
2.3.3 Measurement of the THz focal area
The THz spot size was measured with a “knife-edge” technique as illustrated in Fig.2.5.
Fig. 2.5 Diagram of knife edge measurement technique
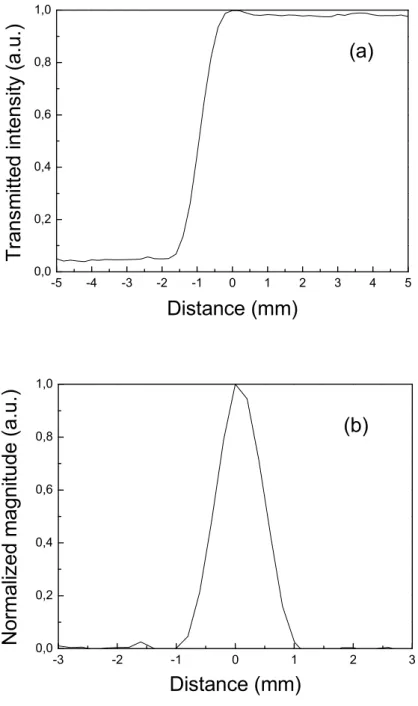
It consists of a micrometer motor-driven translation stage, to which is attached a single-edge razor blade. The razor passes through the focal plane of THz beam. The transmitted THz field is then measured by the FSEOS detection system. The details of the analysis are given in Appendix D. The beam diameter is exacted by derivation the transmission function. In order to extract the position of the THz focal plane, the measurement is performed for several position along the z-axis. The typical THz spot size is 400 to 500µm.
x y z Gaussian Beam Knife Edge Cutting Direction
- 21 - -5 -4 -3 -2 -1 0 1 2 3 4 5 0,0 0,2 0,4 0,6 0,8 1,0
Tr
a
n
s
m
it
te
d
i
n
te
n
s
it
y
(
a
.u
.)
Distance (mm)
(a)
-3 -2 -1 0 1 2 3 0,0 0,2 0,4 0,6 0,8 1,0(b)
N
o
rm
a
liz
e
d
m
a
g
n
it
u
d
e
(
a
.u
.)
Distance (mm)
Fig. 2.6 Transmission function: (a) Transmission of THz at focal plane (b) Derivative of the transmission function at the THz focal plane.
2.3.4 Thickness influence of ZnTe emitter and sensor
ZnTe crystals have a large electro-optic coefficient, but a more compelling attribute is the velocity matching between the femtosecond optical beam in the wavelength vicinity of 800nm and the THz radiation [110-111]. The refractive indices of the near infrared beam (~800nm)
- 22 - match very well with the dielectric constant in the THz range from sub-THz to several THz. This feature means that the thickness of ZnTe crystals has a limited influence on the walk-off effect and results in large conversion efficiency. However, the THz spectral bandwidth depends on the pulse duration and also on the phase matching. A laser pulse can generate a THz pulse with bandwidth twice as broad as the laser pulse itself. Therefore shorter laser pulses are expected to extend the bandwidth of the radiation. However, it is impossible to select an electro-optic crystal that fulfills the group velocity matching condition for all frequency components. In order to minimize walk-off between the THz and optical pulses, thinner crystals must be used. Suppose Ω is the THz frequency, and ω is the optical frequency. Then, the frequency response function for the phase-matched process [111] is
( )
(
)
δ π δ π Ω − Ω = Ω 2 1 2 exp i i G , (2.4)where δ is the phase difference between the pump light and the THz light fo frequency Ω, given by
( )
(
)
n c d n c d g = ∆ − Ω = ε δ , (2.5)Here, d is the thickness of ZnTe crystal, c is the light speed in vacuum, ng is the group
refractive index for the laser pulse, and ε(Ω) is the dielectric constant of the electro-optic crystal at the THz frequency Ω. The phase-matching equations are the same for electro-optic detection.
Besides the phase-matching condition, another important limitation factor is the “etalon” [112] (Fabry-Pérot like) effect of ZnTe crystals. An incident probe pulse passing through the ZnTe sensor is partially reflected by the internal facets of the crystal. During the sampling process, the THz signal is reconstructed temporally by a series of near-IR probe pulses. The sampling diagram is show in Fig. 2.7.
- 23 -
Fig. 2.7 Etalon effect in the ZnTe sensor crystal
In the THz-TDS spectra, this induces THz echoes following the major oscillation. In the example displayed in Fig. 2.8, we used a 1mm ZnTe crystal sensor and a 2mm ZnTe crystal as the emitter. 0 10000 20000 30000 40000 -1,0x10⁻⁴ -5,0x10⁻⁵ 0,0 5,0x10⁻⁵ 1,0x10⁻⁴ 1,5x10⁻⁴ THz emitter echos THz sensor echos E T H z ( V ) ∆τ (fs)
Fig. 2.8 Etalon effect induced THz echos in spectra
2θ d T1 T2 R1 R2 R3
- 24 -
2.3.5 Water absorption and typical spectrum in dry atmosphere
THz radiations are easily absorbed by the water present in the air so that the terahertz time-domain spectroscopy has to be performed in a purged system (nitrogen or dry-air). To illustrate this, Fig. 2.9 shows a THz-TDS spectrum obtained in normal atmosphere (60% humidity). The spectrum contains about thirty strong lines in the given frequency range. The NASA catalog[113,114] allows identifying a majority of the lines.
0 5 10 15 20 -1,0x100 -5,0x10⁻¹ 0,0 5,0x10⁻¹ 1,0x100 (A) THz waveform
T
H
z
s
ig
n
a
l
∆τ/ ps
0 1 2 3 4 5 6 1E-3 0,01 0,1 1 (B) THz spectra A m p lit u d e ( a .u .) Frequency (THz)- 25 - 4 5 6 7 8 9 10 -100 -50 0 50 100 150 E le c tr ic F ie ld ( V /c m ) ∆τ / ps 0 1 2 3 4 5 6 0,01 0,1 1 A m p lit u d e ( a .u .) Frequency (THz)
Fig. 2.10 (A) THz waveform and (B) THz spectra in dry-atmosphere
2.3.6 The competition of THz generation and nonlinear optical effect
(A) Experiment
The excitation of the <110> 2-mm-thick crystal was provided by a 800nm Ti:sapphire laser (100 fs pulses) at 300mW, using a 4cm focusing lens. The ZnTe crystal is virtually
- 26 - transparent in the frequency domain of interest[19]. The detection of the THz radiation was performed by a liquid helium cooled bolometer.
Fig. 2.11 (a) Schematic setup of nonlinear THz experiments; blue cone and line is the SHG signal; L: lens, C: ZnTe crystal, P: picarin lens, B: bolometer, PMT: photon multiplier tube; (b) Diagram of the THz Z-hole measurement.
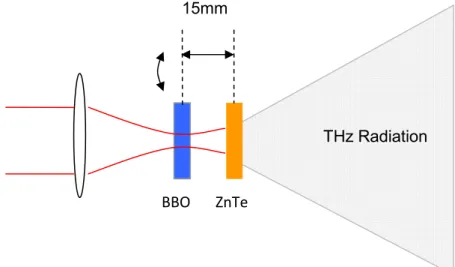
For reasons that we’ll discuss below, we performed as well a “two-color” experiment described in Fig. 2.12: a BBO crystal is placed at the focus of the near-IR beam and the ZnTe crystal is placed further on the z-axis.
Ti :sapphire M1 M2 Z ZnTe L P1 P2 B / PMT (a) Lock-In Laser pulse, Δτ :100fs, λ :800nm ZnTe Z Lens
SHG & Transmitted beam
(b) THz cone
- 27 - The transmitted laser beam is measured with a silicon photodiode (OPA 5T), the SHG a photon-multiplier tube (PMT) associated with a blue pass filter.
Fig. 2.12 Schematic setup the “two-colour” experiment.
(B) Result and Analysis
0 60 120 180 240 300 360 0.6 0.8 1.0 0.0 0.5 1.0 1.5 2.0
Angle (degree)
T
ra
n
s
m
is
s
io
n
I
n
te
n
s
it
y
T
H
z
/
S
H
G
i
n
te
n
s
it
y
Fig. 2.13 Closed symbols: THz intensity as a function of the ZnTe azimuthal angle. Open circles: SHG intensity upon focusing. Open squares: transmission at 800 nm.
15mm
THz Radiation
ZnTe BBO
- 28 - Fig. 2.13 shows the THz emission, SHG and the transmission laser beam as a function of the azimuthal angle of the ZnTe crystal. The THz emission and SHG have the same profile: extreme are obtained for the same angles and both intensities vary in the range from 0 to 100%. The transmission at 800 nm presents variations opposite of two previous ones: maxima of the transmission correspond to the minima of the THz radiation and SHG respectively. The attenuation of transmitted beam varies from less than 20%.
The THz and SHG intensities are proportional to the square of the nonlinear polarization which angle dependence is determined by the 2nd order nonlinear susceptibility tensor
[ ]
dijk[116]
. The linearly polarized optical pump beam is normally incident upon the <110> crystal and the angle between its electric field E(ω) and the <001> axis is noted θ. E(ω) is given by:
( )
− = ω θ θ θ ω ;cos 2 sin ; 2 sin cos 0 t E E , (2.6)The polarization associated to OR and SHG in crystallographic axis are described by:
(
)
(
)
(
)
d E E(
)
t P t E E d P k j ijk j k SHG i k j ijk j k OR i 2 1 , 2 1 1 2 , 1 2 cos cos ω ω ω ω ω ω ω ω + = + − = − ∑ ∑ , (2.7)where the indices refer to the set
{
x,y,z}
.For a crystal with zinc-blende structure, such as ZnTe, the nonlinear susceptibility tensor is:
= 14 14 14 0 0 0 0 0 0 0 0 0 0 0 0 0 0 0 d d d dil , (2.8)
where the index l refer the Voigt notations.
The angle θ dependence of the THz and SHG intensities is then determined by the following expression:
( )
θ f E d IITHz ∝ SHG ∝ P2∝ 142 04 with f
( )
θ =sin2θ(
1+3cos2θ)
, (2.9) In principle, optical rectification, SHG as well as TPA can be responsible for the optical pump depletion. Nevertheless, the optical rectification efficiency is only on the order of 10-7 and, as- 29 - already pointed out in previous studies [123], SHG generation is also inefficient in depleting the pump and the variations observed in transmission can only be attributed to TPA. Therefore, the variation of transmission originates from the angle dependence of TPA (through a coefficient β given below). Hutchings and Wherrett[118-121] theory of TPA show that β strongly depends on the relative orientation of the light polarization with the crystal axes. In the case of a linear polarization contained in the <110> plan, the orientation dependence of TPA is given by:
( )
θ ∝ −σ( )
θ β f
2
1 , (2.10)
where β is the anisotropy parameter of TPA.
Finally, the azimuthal dependence of the THz emission, SHG and the transmission intensity is determined by the same function f
( )
θ . This function reproduces exactly the experimental variations.We note that easy crystal axis determination is highly desirable when developing ultra-fast THz spectroscopy experiments based on optical rectification and free-space electro-optical sampling. In this case, as already pointed out, several parameters need to be properly adjusted simultaneously: crystals orientation, pump focusing, time delay, spot overlap. The measured intensity depends on the angle φ between the THz electric field and the z axis:
ϕ 2 sin 3 1 + ∝ THz signal E I , (2.11)
So, the maximum sensitivity is reached when the [-110] axis is parallel to THz field. In this context, Fig. 2.13 also shows that measuring the angle-dependence of the transmission is the simplest method for determining the best crystal orientation for optimum THz generation. For a THz-TDS system, a convex lens is generally used to collimate laser beam on the crystal to increase the energy density for higher THz emission power below the damaged threshold. However, we have previously shown that SHG and TPA play a significant role when the crystal is placed at the laser beam waist. When the crystal is placed out of focus (e.g. z = 8mm), the intensity have a quadratic behaviour with the exiting power, which corresponds to the expected variation. Nevertheless, when the beam is focused on the crystal (z = 0), the THz emission tends to saturate what clearly shows that the other nonlinear processes affect the optical rectification.