i
UNIVERSITÉ DU QUÉBEC
INRS- ÉNERGIE, MATÉRIAUX ET TÉLÉCOMMUNICATIONS
Development of an intense THz source using tilted
pulse front method in LiNbO
3crystal and its
application in non-linear THz spectroscopy
par Gargi Sharma
Thèse présentée pour l’obtention
du grade de PhilosophiæDoctor (Ph.D.) en Sciences de l’Énergie et des Matériaux
Jury d’évaluation
Président du jury Dr. Francois Vidal, (INRS-EMT) et examinateur interne
Examinateur externes Dr. Daniel Mittleman, (Rice University) Dr. Safieddin Safavi-Naeini, (University of waterloo)
Directeur de recherche Dr. Tsuneyuki Ozaki, (INRS-EMT) Codirecteur de recherche Dr. Roberto Morandotti, (INRS-EMT)
ii
Abstract
The aim of this thesis was to develop an intense THz sources using tilted pulse front technique and its application in nonlinear THz spectroscopy of semiconductors and graphene.
At the Advanced Laser Light Source, an intense THz source based on large aperture ZnTe crystal had already been available. This source uses 50mJ laser energy to generate THz pulses with 1J energy. The main limitation of the ZnTe based source is its low signal to noise ratio, as it uses the 100Hz laser system, where the pulse to pulse fluctuation may vary up to 10%.
To overcome the limited signal to noise ratio and to increase the efficiency of THz generation, a new intense THz source based on the tilted pulse front technique in LiNbO3 crystal is designed and developed as a first part of this thesis. At the time of source characterization it was realized that the measurement of intense THz electric field is a big challenge, as the conventional electro-optic sampling technique suffers from the limitation of over-rotation. In this thesis work a new detection technique has been demonstrated based on spectral domain interferometry, which not only overcomes the limitation of over-rotation but also significantly simplifies the detection system.
Using the developed intense THz sources, the nonlinear response of semiconductors like GaAs are investigated. Optical pump-THz probe technique is used to investigate the carrier dynamics in GaAs sample. When the THz electric field is intense enough, it not only probes but also pumps the semiconductor which is observed as absorption bleaching of the intense THz pulse in the GaAs sample. The first experiment was done at fixed optical pump fluence. For further investigation, the optical pump fluence is increased and as a result THz induced absorption bleaching is decreased. The results are modeled using intervalley
iii
scattering Drude model. This simple model explains the experiment results quite well.
Next, using the available THz sources, the linear and nonlinear properties of graphene have been investigated. The sheet conductivity of the graphene sample is investigated using a low energy THz source. The sheet conductivity varies from sample to sample and can be used to test the quality of the graphene sample. After performing linear characterization, the nonlinear properties of graphene sample are also investigated using intense THz sources available at ALLS. The results show that when the graphene sample is pumped with an intense THz electric field, the frequency multiplication effect takes place. This is the first experimental demonstration of the nonlinear effects at THz frequencies. We are in collaboration with Tokyo University for theoretical modeling of these experimental observations.
iv
Acknowledgement
First of all I would like to thank my principle supervisor Dr. Tsuyenuki Ozaki for his constant support throughout my doctoral work. His excellent guidance, motivation and immense knowledge always inspired me. This work would not have taken its present shape without him.
I am honored to work with Dr. Roberto Morandotti, my co-supervisor, who put a lot of efforts in arranging the funding for several of my doctoral projects. He has been an excellent critic and a great source of improvisation.
My sincere thanks also goes to Dr. David Cook (McGill University) who is although not on my supervisor list but has guided me and helped me understanding my work a lot.
Besides my supervisors, my lab members have also played a crucial role in completion of my thesis. I would like to thank Dr. Francois Blanchard who helped me in initial course of my work. Dr. Ibraheem Al-Naib supported me throughout my PhD work, whether it was in the lab or writing papers, he was always there to provide his valuable suggestions to improve the work. I am thankful to Dr. Luca Razzari as well for helping me in understating the theoretical aspects of the experimental work that I performed. A big thank to Regis Imbault who helped with the French translation of my thesis abstract.
The ALLS facility at INRS is a major contributor to the success of this work. I am thankful Amelie Auger, Mathieu Giguere, Stephane Payeur, Francois Poitras and all other members of ALLS. Special thanks goes to Antoine Lamaree, who would respond to my calls (even on sunny weekend) and rush to the lab to fix the problems with laser.
My special thanks to Guy Lebrun, and all the technicians at machine shop, they always helped me to fix my small issues in their busy schedule.
v
INRS administration was a great helping hand throughout my stay at INRS. I appreciate the efforts of Nathalie Graveline, Helene Sabourin, Louise Hudon, and all who do their best to simplify the life of lazy student like me at INRS.
My husband Kanwarpal spent several nights at the couch at INRS cafeteria while I was performing experiments on weekends in ALLS. I am lucky to have him as he not only provided the scientific input to my work but also supported me morally throughout my PhD. My sincere gratitude towards my parents and my sister Shivani, for their encouragement throughout my life.
I am grateful to INRS and FQRNT for the financial support for my doctoral work.
Last but not least, I would like to thank the members of the review committee who took out time from their busy research life and reviewed my thesis.
vi
Table of figures
Figure 1. Electromagnetic spectrum ... 1
Figure 2. THz generation via optical rectification. ... 10
Figure 3. THz detection using electro-optic sampling ... 13
Figure 4. THz generation by Cherenkov radiation. ... 21
Figure 5. Coherent THz generation in tilted-pulse-front. ... 23
Figure 6. An optical beam incident on the grating (at an angle α)... 25
Figure 7. Imaging of the laser beam spot with a demagnification ... 26
Figure 8. Top view of the sLN crystal.. ... 28
Figure 9. Experimental set up layout.. ... 29
Figure 10. THz energy as a function of optical pump energy... 31
Figure 11. Image of a focused 0.6 μJ THz pulse ... 32
Figure 12. Temporal shape of the THz pulse ... 33
Figure 13. Schematic of spectral domain interferometry.. ... 38
Figure 14. Change in the FFT signal ... 42
Figure 15. Experimental set-up. ... 45
Figure 16. THz pulse measured with a spectral domain technique ... 49
Figure 17. THz spectrum associated to the pulse in Figure 16 ... 50
Figure 18. 2D Spatial profile of the THz beam... 51
Figure 19. Schematic of the optical-pump-THz-probe technique... 53
Figure 20. Typical optical-pump / THz-probe spectroscopy scan. ... 54
Figure 21. Electric field, magnetic field and propagation vector... 56
Figure 22. GaAs band structure [89] ... 59
Figure 23. Schematic of the high-intensity THz pulse source ... 60
Figure 24. (a) Electric field profile of the terahertz beam ... 61
Figure 25. Normalized transmission of the peak electric field ... 63
vii
Figure 27. Transmitted THz waveforms ... 69
Figure 28 . Time evolution of the average electron drift velocity ... 71
Figure 29. Real (1) and imaginary (2)part of the complex ... 73
Figure 30. The carrier density dependence of the ... 76
Figure 31. Electron mobility as a function of carrier density. ... 79
Figure 32. Honeycomb structure of graphene ... 82
Figure 33. Energy dispersion relation of graphene (adapted from Ref [121]) ... 83
Figure 34. The atomic force microscopy images ... 87
Figure 35 Raman spectrum of graphene edge, ... 88
Figure 36. Transmission of the electromagnetic signal ... 90
Figure 37. Experimental set-up for linear THz spectroscopy. ... 93
Figure 38. THz pulse shape and corresponding spectrum in inset. ... 94
Figure 39. (a)THz pulse (b) corresponding spectrum ... 95
Figure 40. Experimentally extracted conductivity ... 96
Figure 41. Typical experimental set-up for nonlinear ... 99
Figure 42. The electric field and corresponding spectrum ... 101
Figure 43. Normalized transmission through the graphene sample ... 102
Figure 44. THz electric field and corresponding spectrum through ... 104
viii
Table of Contents
Chapter 1 ... 1
Introduction and objectives ... 1
1.1 Introduction ... 1
1.2 Objective of the thesis ... 3
1.2.1 Intense THz source development ... 4
1.2.2 THz detection using spectral domain interferometry ... 5
1.2.3 Nonlinear THz spectroscopy ... 5
1.2.3.1 Semiconductors ... 5
1.2.3.2 Graphene ... 6
Chapter 2 ... 7
Intense THz generation via tilted-pulse-front technique in LiNbO3 crystal………7
2.1 Introduction ... 7
2.2 Optical rectification for THz generation ... 8
2.3 THz detection using free space electro-optic sampling ... 12
2.4 Intense THz generation via optical rectification method ... 17
2.4.1 Choice of material for optical rectification ... 17
2.4.2 Cherenkov scheme ... 20
2.4.3 Tilted-pulse-front technique ... 22
2.4.3.1 Pulse front tilt introduced by a grating ... 24
2.4.3.2 Optimization of the pulse-front-tilting setup ... 27
2.4.3.3 Description of the sLiNbO3 crystal used to implement the tilted pulse front technique ... 27
ix
2.4.3.4 Experimental set-up ... 29
2.4.3.5 Source characterization ... 30
2.5 Comparison of the tilted pulse front LiNbO3 THz source with the large aperture ZnTe THz source ... 34
Chapter 3 ... 36
THz detection using spectral domain interferometry ... 36
3.1 Introduction ... 36
3.2 Theoretical background... 38
3.2.1 Depth range of SDI ... 41
3.2.2 Signal-to-noise ratio of the system ... 43
3.3 Experimental design ... 45
3.3.1 Numerical processing of the data ... 47
3.4 Results and discussion ... 48
3.4.1 System characterization ... 48
3.4.2 THz electric field measurement ... 49
Chapter 4 ... 52
Nonlinear THz spectroscopy of semiconductors ... 52
4.1 Introduction ... 52
4.2 Optical-pump/Terahertz-probe (OPTP) or time-resolved terahertz spectroscopy (TRTS) ... 53
4.3 Thin film equation for optical-pump / THz-probe spectroscopy ... 55
4.4 Optical-pump / THz-probe measurement of a GaAs sample ... 58
4.4.1 THz source used for the experiment ... 60
4.4.2 Optical pump/THz probe experiment ... 62
4.4.3 Theoretical interpretation ... 63
x
4.4.4 Simulated results ... 68
4.4.5 Velocity overshoot ... 71
4.4.6 Conductivity extraction ... 72
4.5 Carrier density effects on nonlinear absorption of THz radiation in GaAs .... 74
4.5.1 Experimental set-up ... 74
4.5.2 Definition of absorption bleaching ... 74
4.5.3 Experimental results and discussion ... 75
Chapter 5 ... 81
Linear and nonlinear THz spectroscopy of graphene ... 81
5.1 Introduction ... 82
5.2 Methods of fabrication ... 84
5.2.1 Mechanical exfoliation ... 84
5.2.2 Chemical vapor deposition ... 85
5.2.3 Graphene from silicon carbide crystal ... 85
5.3 Graphene characterization... 86
5.3.1 Atomic force microscopy ... 86
5.3.2 Raman spectroscopy ... 87
5.3.3 THz spectroscopy ... 88
5.4 Determining the sheet conductivity of a graphene sample ... 89
5.5 using THz spectroscopy ... 89
5.5.1 Theoretical background... 89
5.5.1.1 Fresnel coefficients ... 91
5.5.1.2 Graphene sheet conductivity ... 92
5.5.2 Experimental extraction of sheet conductivity... 93
xi
5.7 Investigation of the nonlinear response of graphene using intense THz source
... 99
5.7.1 Measurement of the graphene sample fabricated by Kyushu University ... 100
5.7.2 Measurement of the graphene sample fabricated by NTT ... 103
5.8 Discussion ... 105
Chapter 6………..106
Conclusion………...107
6.1 Intense THz source development using the tilted-pulse-front technique in LiNbO3 crystal ... 108
6.2 THz detection using spectral domain interferometry ... 108
6.3 Nonlinear THz spectroscopy of semiconductors ... 109
6.4 THz linear and nonlinear spectroscopy of graphene samples ... 110
6.5 Future perspective ... 111
6.5.1 Up-grading the LiNbO3 source using the 100 Hz laser system ... 111
6.5.2 THz detection improvements ... 111
6.5.3 Linear and nonlinear THz spectroscopy of various semiconductors and graphene ... 112
List of variables………113
References………116
Résumé en français………..126
xii
II. Génération des THz intenses ………...128
III. Détection THz par interférométrie du domaine spectral………..132
IV. Spectroscopie THz non linéaire de semi-conducteurs……….136
V. Spectroscopie THz linéaire et non linéaire du graphène……….142
1
Chapter 1
Introduction and objectives
1.1 Introduction
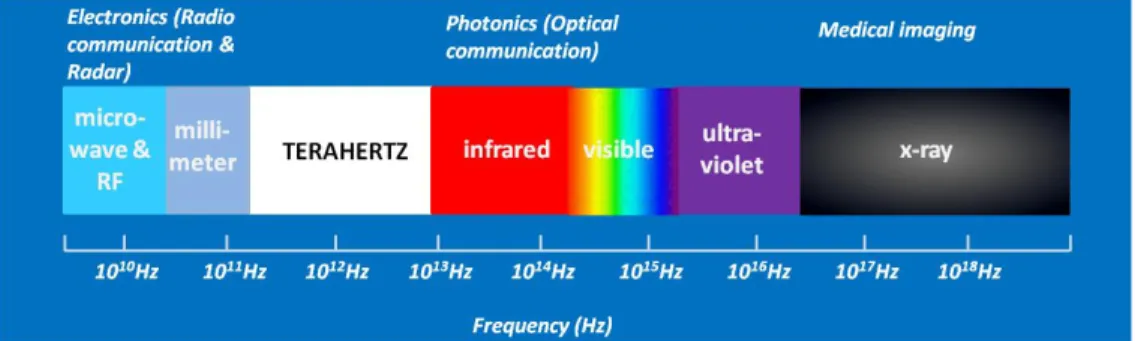
Figure 1. Electromagnetic spectrum
The complete electromagnetic spectrum can be roughly divided into different wavelength regions, as shown in Figure 1. In this spectrum, the terahertz (THz)
2
frequency band lies between 0.1 and 10 THz, being one of the least explored region in the electromagnetic spectrum. Several important phenomena take place in this frequency range, making THz a field of substantial interest to the research community. For example, intermolecular vibrations of solid materials are observed at THz frequencies [1]. In biology, important collective modes of proteins vibrate at THz frequencies [2]. The rotational energy levels of small molecules also fall within the THz frequency range [3]. Rotation and collective modes cause polar liquids (such as water) to strongly absorb THz frequencies [4, 5]. Furthermore, in gaseous and solid plasma, the molecules oscillate at THz frequencies [6, 7]. Matter at temperature above 10 K emits blackbody radiation, which also falls within THz frequencies [8].
The fact that coherent detection techniques could be used makes coherent THz radiation a very important tool for studying the fundamental properties of various molecules. Further, THz frequencies also have a huge potential in imaging, offering several advantages over conventional imaging and spectroscopy techniques. For example, its low photon energy (4.1 meV) allows THz radiation to penetrate through many materials (such as wood or plastic) without photoionizing the molecule, unlike X-ray radiation. These two fundamental properties make THz technology a potential tool for several applications. This trend is presented well in the most cited publications in the field of THz, namely: THz spectroscopy [9, 10] and THz imaging [11, 12].
One of the most challenging scientific applications of high power terahertz waves is nonlinear spectroscopy. Using intense THz sources, it is now possible to study the nonlinear optical response of materials at THz frequencies and at picosecond (and even sub-picosecond) timescales. For example, a long-lived coherent THz emission (centered at around 2 THz), as well as a carrier-wave Rabi oscillations have been observed between bound impurity levels of n-type GaAs, excited by an intense THz pulse with peak electric field amplitude of 70 kV/cm [13, 14]. In addition, THz-intensity-dependent cross phase modulation has been observed in electro-optic crystals, in turn leading to spectral shifting, broadening
3
and modulation of co-propagating laser pulses [15, 16]. Using intense THz pulses, there have been reports of lattice anharmonicity and self-phase modulation in LiNbO3 [17], and THz-electric–field-induced impact ionization in InSb [18, 19]. Moreover, these sources have allowed the observation of a decrease in THz absorption due to intervalley scattering in doped InGaAs, GaAs, Si, and Ge using THz-pump / THz-probe techniques [19-21]. More recently, they have also enabled the detection of the Kerr effect at THz frequencies, resulting in a THz intensity dependent birefringence in liquids [22]. Intense THz fields are used to map the effective mass anisotropy in the non-parabolic conduction band of an InGaAs thin film [20]. There have also been studies on THz electro-optic modulation of excitons in carbon nanotubes [23], THz induced saturation absorption in semiconductors [24] and coherent control of antiferromagnetic spin waves [25].
In spite of the results mentioned above, the field of THz nonlinear spectroscopy is still at its preliminary stage. The best is still to come, the main limitation being the availability of high power THz sources. Not surprisingly, many researchers across the world are working on the development of intense THz sources to exploit this field of research.
1.2 Objective of the thesis
The main objective of this thesis is to develop an intense THz source and to use it to study the nonlinear THz response of semiconductors and graphene. This thesis is arranged as follows. First, the intense THz source developed using the tilted-pulse-front technique in a LiNbO3 crystal is explained in Chapter 2. During the course of this thesis work, a novel technique for THz detection using spectral domain interferometry has been proposed and demonstrated, and the
4
details of this technique are described in Chapter 3. Finally, the developed source is used to investigate the nonlinear response of various materials, and the results obtained are described in Chapter 4 and 5.
1.2.1 Intense THz source development
The Advanced Laser Light Source (ALLS) facility, located at the Varennes, Québec campus of the INRS, is one of the leading facilities for intense THz research. The THz group at ALLS has successfully demonstrated the generation of high-power THz radiation using optical rectification in a large aperture zinc telluride crystal [26]. This source uses ~50 mJ of laser energy as the pump, resulting in a peak THz electric field as high as 200 kV/cm. Such high electric field is good for observing nonlinear THz phenomena in various materials. The main limitation of this THz source is the signal-to-noise ratio, since the laser used to pump this source has a repetition rate of 100 Hz, and the pulse-to-pulse fluctuations could be as high as 10 %. In general, the electric field strength of this source is already close to the threshold for observing nonlinear THz response in many materials, and the low signal-to-noise ratio increases the experimental challenges significantly. One way to increase the signal-to-noise ratio is to increase the generated THz electric field or energy. With the current technique, crystals with larger size and higher pump laser energies are required, leading to unpractical set-ups.
Recently, a new technique has been proposed to generate intense THz sources: optical rectification pumping a LiNbO3 crystal with the tilted-pulse-front method. To date, this is arguably the most efficient way to generate THz radiation, with an efficiency as high as ~10-3. One of my first tasks was to demonstrate this source at ALLS using a relatively low power laser system, providing 4 mJ of laser energy at
5
1 kHz repetition rate and 40 fs pulse duration. The details of this source are discussed in Chapter 2.
1.2.2 THz detection using spectral domain interferometry
During the characterization of the intense THz source mentioned above, we experienced the problem of detecting intense THz electric field. The conventional method for THz detection is electro-optic sampling. It is a commonly used method but has many limitations when it comes to detecting intense THz electric fields, including the problem of over-rotation. In Chapter 3, we describe a novel technique based on modified electro-optic sampling using spectral domain interferometry for THz detection. This technique enables us to detect intense THz electric field without the limitation of over-rotation.
1.2.3 Nonlinear THz spectroscopy
The next objective of this thesis was to study nonlinear THz spectroscopy of various materials.
1.2.3.1 Semiconductors
Chapter 4 is dedicated to the nonlinear experiments performed on semiconductors. We have investigated the optical-pump / THz-probe
6
spectroscopy of GaAs samples. In these experiments, the THz probe is the intense THz pulse, so it is not only probing but also pumping the GaAs sample. Here, we observed THz-pulse-induced intervalley scattering, resulting in absorption bleaching of the intense THz pulse.
Next, the effect of optical pump fluence on THz-induced absorption bleaching is investigated. It is observed that the carrier density in the conduction band of the semiconductor strongly affects this phenomenon.
The results are modeled using an intervalley-scattering-based Drude model. This simple model gives reasonable agreement with our experimental observation.
1.2.3.2 Graphene
In Chapter 5 of this thesis, some of our experimental results recently obtained with graphene are discussed. Graphene is one of the most exciting materials currently investigated, because of its many unique properties, including high mobility and the possibility of frequency multiplication at THz frequencies, as shown by our recent experimental results.
7
Chapter 2
Intense THz generation via
tilted-pulse-front technique in
LiNbO
3
crystal
2.1 Introduction
To be able to investigate the nonlinear response of materials at THz frequencies, one requires intense THz sources with high electric field strengths. In this chapter, the intense THz source using the tilted-pulse-front technique in LiNbO3 crystal is discussed, designed and demonstrated, as a first step towards nonlinear THz spectroscopy.
8
2.2 Optical rectification for THz generation
Optical rectification (OR) is a second-order nonlinear optical process in which, following the application of an intense laser field, a quasi dc polarization is induced in an electro-optic crystal due to difference frequency generation. This effect was first observed in 1962 by M, Bass et al., by using Ruby lasers in a KDP crystal [27]. If the incident laser pulses have femtosecond duration, then the difference-frequency generation between the various frequency components of a broadband femtosecond laser pulse gives rise to broadband THz radiations. Although it has been known for a long time that the emission of radiation in the far-infrared can result from the optical rectification of an optical pulse [28], experimental and theoretical evidence of rectification in (110) crystal semiconductors was only demonstrated in 1994 by Rice et al. [29].
The other conventional way to generate THz radiations is the photoconductive antenna, where the femtosecond laser pulse excites the electrons in the conduction band of the semiconductor, and the subsequent acceleration of carriers due to the applied voltage gives rise to emission of radiation. If the lifetime of the carrier lies within the picosecond range, THz radiation is generated.
Optical rectification is a more popular choice for THz pulse generation when working with amplified lasers, because the pump laser intensity threshold for saturation is much higher than that in photoconductive antennas [30-35]. On the other hand, THz generation by non-resonant optical rectification has the unique advantage of an extremely broad spectral bandwidth [36], compared to photoconductive antenna THz generators, when pumped with sub 100 femtosecond laser pulses. The mathematical formulation of the theory of THz generation is discussed further.
Mathematically, the polarization P can be expanded into a power series of the electric field Eopt,
9
( ) ( ) ( )
( ) 1 ( ) opt( ) 2 ( ) opt( ) opt( ) 3 ( ) opt( ) opt( ) opt( ) ...
P t t E t t E t E t t E t E t E t
(2.1) where χ(n) is the nth order nonlinear susceptibility tensor. The second term in Eq. (2.1) is responsible for the optical rectification process; This is the result of noncentrosymmetric nature of the nonlinear crystal, which induces optical rectification . If the incident light is a plane wave, then it can be expressed as,
( )
( ) ( ) . opt 0 optE t E exp i t d cc (2.2)
By substituting Eq. (2.2) into Eq. (2.1), the polarization for the optical rectification can be rewritten as,
( ) ( ) * ( ) ( ) ( ) exp[ ( ) ]
2 2 2 OR opt 1 opt 2 1 1 2 P t 2 E E i t d d (2.3)Here, and , where is the difference between the various frequency components of the broadband laser pulse. On substituting these values in to Eq. (2.3), one gets:
( ) ( ) * ( ) ( ) ( ) exp[ ]
2 2 OR opt opt 0 0 P t 2 E E i t d d (2.4)In the far field, the radiated electric field is proportional to the second order derivative of the induced polarization with respect to time.
10 ( ) ( ) ( ) 2 2 THz t 2 POR t t E (2.5)
The susceptibility tensor is the property of the nonlinear crystal structure. Thus, by knowing the crystal structure and the incident light, Eq. (2.5) can be used to calculate the far-field waveform of the radiation.
The actual configuration for generating THz pulses via optical rectification is rather simple, as shown in Figure 2. As discussed above, when an intense laser beam propagates through a second order nonlinear medium, a transient polarization is induced, which results in the generation of THz radiation. The generated THz pulse is proportional to the second-order time derivative of this polarization [29, 37-40]
Figure 2. THz generation via optical rectification in a nonlinear crystal. A femtosecond laser pulse, passing through a χ(2) material, generates a broadband THz pulse by means of
difference frequency generation processes in between all the spectral components of the broadband optical pulse.
11
The efficiency, shape and frequency distribution of the radiated THz waveform depends on various factors, such as the materials used, crystal orientation, thickness, absorption and dispersion, diffraction, phase matching, and saturation. Although all of these factors affect the efficiency of THz generation, for a nonlinear process such as optical rectification, phase matching is the most important factor. For efficient transfer of energy from optical to THz radiation, the phase matching condition, which is given by the following equation, should be satisfied:
( ) ( ) THz( )
k k k (2.6)
Here, k is the wave vector, is the angular frequency of the pump beam, and Ω is one particular frequency of the radiated THz wave packet. Using this expression, we may depict the radiated THz waves as the superposition of all the frequency components in the optical pump beam. Additionally, Ω depends on the second-order dispersion coefficient of the crystal, as well as on the pump beam spectrum and on the phase shift between the pump and the THz waves.
From Eq. (2.6) one can write,
THz opt k k (2.7)
Eq. (2.7) gives the phase matching condition for efficient THz generation from the optical pulse. This states that the group velocity of the optical wave should match the phase velocity of the THz wave [33]. Eq. (2.7) is the condition
12
for collinear phase matching, where the optical and THz wave propagates collinearly through the nonlinear medium. The phase matching condition is satisfied only when the participating waves are in phase with each other. This leads to maximum conversion of energy along the propagation of the optical wave through the nonlinear medium. Phase mismatch leads to a phase walk-off as the optical wave propagates through the medium. When the phase difference between the optical and the THz pulse is more than π, there will not be any energy transfer between the two. The length for which the phase difference between the optical and the THz pulse changes by π inside the nonlinear medium is known as the coherence length of the crystal [39].
c
kL
(2.8)
Here k k( ) k( ) k THz(). In order to generate efficient THz radiation from a bulk crystal, the thickness of the crystal cannot be longer than the coherence length, in order to avoid the conversion cancellation due to phase mismatch.
2.3
THz detection using free space electro-optic sampling
Free-space optic detection uses the linear Pockels effect in an electro-optic (EO) crystal to detect the quasi-DC electric field of the THz pulse with respect to a femtosecond gating pulse. This technique was first demonstrated in 1996, by X.-C. Zhang's group [41], the group of P. Jepsen and M. Helm [42] and
13
finally, the group of T.F. Heinz [38]. A schematic diagram of this technique is shown in Figure 3.
Figure 3. THz detection using electro-optic sampling technique using a ZnTe crystal (see text below for a description of the technique)
In the absence of the THz field, a linearly polarized gating pulse traverses a ZnTe crystal and passes through a
/ 4 waveplate unaffected and becomescircularly polarized. The orthogonal polarization components of the gating pulse are then equally separated by a Wollaston prism, and each is sent to one of the photodiodes of a balanced two-photodiode detector. Since the pulse is circularly polarized, each photodiode reads the same voltage, which is sent to a lock-in amplifier, subtracts the two and returns a zero reading. When the THz field overlaps the gating pulse in time, the polarization of the gating beam is rotated slightly by an amount proportional to the strength of the electric field (Pockels effect). In this case, after the
/4 plate, the polarization is elliptically polarized14
and after separation by the Wollaston polarizer, there is an imbalance between the signals of the two photodiodes, registered by a lock-in as a signal proportional to the subtraction of the two components. Such signal is directly proportional to the electric field of the THz pulse, and by scanning the time delay between the gating beam and THz beam, the entire THz waveform may be mapped in time. The lock-in amplifier is locked to the frequency of an optical chopper, which modulates the THz source beam at, e.g., 500 Hz for a 1kHz repetition rate laser system. Conventionally for EO sampling ZnTe crystal is used, although crystals like GaSe, GaP, InP, GaAs and DAST have also been demonstrated [43-45]. A detailed study on the crystal orientation dependence of the THz detection in ZnTe is given in Ref. [46]. Because the nonlinear optical rectification process is instantaneous, one would assume that the bandwidth is only limited by the sampling pulse duration. However, the detection bandwidth is fundamentally limited by the phase mismatch between the THz pulse and the 800 nm detection pulse due to a difference in the refractive index at these two wavelengths [38]. Very thin ZnTe crystals, which minimize the influence of this phase mismatch, have been used to extend the detection bandwidth to 100 THz, using sub ten femtosecond pulses [47]. Other sources that limit bandwidth are absorptive phonons at 1.6 and 3.7 THz in ZnTe [48], as well as a transverse optical (TO) phonon at 5.31 THz [41].
For a zinc blend crystal, such as ZnTe, when an electric field is applied, the refractive index ellipsoid is given by:
2 2 2 41 x 41 y 41 z 2 0 x y z 2r E yz 2r E zx 2r E xy 1 n (2.9)
15
where n is the refractive index of the crystal without the electric field, x, y, z 0 are the coordinates of the ellipsoid and Ex, Ey, Ez, are the applied electric fields along the corresponding axes, respectively. r14 is the EO coefficient of the crystal. A phase delay (the retardation introduced in the wave due to the applied electric field) can be calculated according to the change in the refractive index.
2 d n
(2.10)
Here, d is the thickness of the EO crystal and n is the difference of the refractive index for the two axes. Here the process is assumed to be phase matched. If only normal incidence is considered, and if the THz electric field E makes an angle with the X axis (-110) of the ZnTe crystal, then the phase delay in (100), (110) and (111) oriented ZnTe crystal is
0 [ (100) ]
for crystal
(2.11)
cos [for (110) crystal]
dn r E0 413 2 1 3 (2.12) 3 0 41 8 [ (111) ] 3 dn r E for crystal (2.13)
16
sin sin sin
2 2 2 0 0 1 I I 2 I 2 2 4 (2.14)
However, in reality, the EO crystal is not perfectly homogeneous, thus inducing a phase delay0, Eq. (2.14) then becomes:
( ) sin 2 2 0 0 1 I I 2 4 (2.15)
If 0 , then Eq. (2.15) becomes
sin 2 0 0 1 I I 2 2 (2.16)
Here, I represents the signal difference (or gain) with and without the presence of the THz field. As a note, since this technique is very sensitive, it is good to extract the electric field information only if the modulation between the two polarization components of the probe pulse is small. If the modulation is high, the approximation sin
is not valid anymore, in turn inducing inaccuracies in the electric field evaluation. For the THz electric field greater than few tens of kV/cm, the EO sampling is used only to extract the temporal shape of the THz pulse.17
2.4 Intense THz generation via optical rectification method
2.4.1 Choice of material for optical rectification
Various materials have been studied for efficient THz generation by optical rectification. THz generation by optical rectification can be mathematically expressed as a difference frequency generation in a second order nonlinear crystal. When phase matching is achieved, the efficiency of THz generation in a nonlinear medium in the absence of pump absorption is given by:
2 2 2 2 2 2 2 0 sin / 4 2 exp 2 / 4 THz eff THz THz gr ph THz opt THz L d L I L L n n c (2.17)where THz is the THz generation efficiency, is the difference (THz) frequency, deff is the effective nonlinear coefficient, I is the intensity of the input laser pulse, 0is the free space permittivity, cis the velocity of the light, L is the
length of nonlinear crystal, THzis the intensity absorption coefficient of the THz radiation in the crystal, noptgrand ph
THz
n are the group and phase refractive index for an optical and a THz beam, respectively. If the absorptionTHzL1, Eq. (2.17) can be simplified as:
2 2 2 2 2 0 2 eff THz gr ph opt THz d L I n n c (2.18)18
If THz absorption is very high inside the nonlinear crystal, that is THzL1 Eq. (2.17) can be rewritten as:
2 2 2 2 2 0 32 exp 2 eff THz THz gr ph opt THz THz d I L n n c (2.19)From Eqs (2.18) and (2.19), it is clear that it is useful to increase the crystal length only below the penetration depth of the THz radiation 1
THz
. Only those photons that are produced within the region Leff THz1 will exit the surface of the crystal and can significantly contribute to THz emission. The other determining factor in choosing the crystal thickness is the dispersion of the optical pump pulse and the THz pulse inside the nonlinear medium. For example, for a 100 fs optical pulse, the crystal thickness is limited to 1-2 mm. Various crystals have been investigated for generating THz radiation using optical rectification. The different parameters contributing to THz generation by optical rectification in various crystals are shown in Table 1.
Table 1. Comparison of different materials for THz generation via optical rectification[49]
Material Group index
for 800nm Phase index for THz Electro-optic coefficient r(pm/V) Absorption coefficient (THz) CdTe 3.73 3.23 4.5 4.8 GaAs 4.18 3.61 1.43 0.5 GaP 3.57 3.34 0.97 1.9 ZnTe 3.31 3.17 4.04 1.3 GaSe 3.13 3.72 1.7 0.07 LiTaO3 2.22 6.42 30.5 46
19
sLiNbO3 2.23 5.16 30.9 16
DAST 3.31 2.4 77 150
Table 1 shows the important properties of various materials for THz generation via optical rectification. At room temperature, DAST has the highest electro-optic coefficient. DAST has been used recently to generate THz pulses with a 50 kV/cm focused field strength [50-52]. However, this material is not commonly used for intense THz generation because it is very fragile, and present strong absorption at 800 nm wavelength. CdTe has the fourth highest electro-optic coefficient, but there has been no report of its use for THz generation via optical rectification yet. One possible reason could be that CdTe is strongly absorbing at the 800 nm output of Ti:sapphire lasers [38, 53]. ZnTe is the most commonly used electro-optic crystal for optical rectification and electro-optic sampling, even if the electro-optic coefficient for ZnTe is only the fifth largest in Table 1. ZnTe is used widely because of the collinear velocity matching between the pump pulse and the THz radiation, which is approximately fulfilled for Ti:sapphire laser pulses.
However, it is important to notice that sLiNbO3 (sLN) has the second highest electro-optic coefficient, its value being more than seven times larger than that of ZnTe. The energy of the THz pulses (even at room temperature) generated using sLiNbO3 is orders of magnitude higher [54] than that for ZnTe for the same pump energy. The other advantage of sLN crystal is that much higher pump laser energy can be used, as compared to other materials. One reason for this is that the relatively small band gap of many semiconductors allows two-photon absorption of the pump pulses at 800 nm [40, 55-57]. However, the band gap of sLN is significantly higher [58, 59] than other materials, which restricts two-photon absorption at 800 nm. This results in much higher THz pulse energy generation
20
and higher conversion efficiency. The problem with sLN is the strong THz absorption due to the carriers created by two-photon absorption.
Even though the electro-optic coefficient of sLN is very high, this crystal was not commonly used for THz generation prior to 2007. The main reason for this was the phase mismatch between the group velocity of the optical pulse and the phase velocity of the THz pulse given by Eq. (2.7). From table 1, the group index of the optical pump pulse is lower than the phase index of THz pulse. Mathematically, one can write nTHzph noptgr . To efficiently generate THz radiation via optical rectification, the two indices should match, that is ph gr
THz opt
n n . In collinear geometry, the phase matching condition in LN can be achieved by quasi phase matching (QPM) in periodically poled lithium niobate (PPLN). Multi-cycle narrow-band THz radiation has been generated in PPLN [55, 60]. To generate a single-cycle THz pulse, one needs to use non-collinear phase matching condition. In particular, nonlinear phase matching condition in sLN can be achieved by the techniques detailed below.
2.4.2 Cherenkov scheme
A schematic diagram showing the mechanism of the Cherenkov scheme is shown in Figure 4. Here, THz radiation is generated by optical rectification if the group velocity of the optical pump pulse exceeds the phase velocity of the THz pulse. In an electro-optic crystal like sLN, this condition is easily fulfilled [61]. As can be seen from Figure 4, the Cherenkov radiation is emitted in the form of a cone.
The angle of the cone can be determined by the ratio between the group refractive index of the optical pulse and the phase refractive index of the THz pulses, given by the following expression
21 gr opt -1 c ph THz n θ = cos n (2.20)
For instance, if we consider sLN, the group index of the optical pump at 800nm wavelength is 2.25, and the phase index for the THz pulse is 4.95, which results in a Cherenkov angle 0
63
c
θ .
Figure 4. THz generation by Cherenkov radiation. Here voptgr is the group velocity of the optical pulse and vTHzph is the phase velocity of the generated THz radiation. Phase matching
condition is achieved at the critical angle c, which also determines the THz generation angle given with respect to the propagation direction of the optical beam.
THz radiations can only be generated via the electro-optic Cherenkov effect if the beam waist (w0) of the optical pump beam is considerably smaller than the axial spread of the beam:
22 w0 gr opt opt c << τ n (2.21)
Here τopt is the optical pulse duration of the optical beam, which has to be significantly shorter than the generated THz radiation [61, 62].
The Cherenkov scheme was demonstrated initially to allow THz generation in an electro-optic crystal where the group velocity of the optical pulse is greater than the phase velocity of the THz radiation [61, 63]. However, this method has not been used for efficient THz generation. There are two main reasons for this; (i) the THz radiation is generated in a cone shape, which makes it difficult to collect the generated radiation for the purpose of possible applications. (ii) The spot size of the optical pump beam should be small, following Eq. (2.21). Therefore, the THz generation efficiency cannot be increased by using larger optical pump spot size, because the radiated energy strongly drops when the beam waist approaches the axial spread of the pulse inside the electro-optic crystal. Due to the limited spot size of the optical pump laser, the maximum pump energy that can be used to generate THz radiation is strongly limited by the damage threshold of the material. [61]
2.4.3 Tilted-pulse-front technique
In 2002, Hebling et al. proposed a very efficient method to generate intense THz radiation [64], which was subsequently demonstrated by the same group [49, 65]. The technique involves tilting the pulse front of the optical pump, to match the group velocity of the optical pulse with the phase velocity of the THz pulse. The mechanism of the tilted-pulse-front technique is described in Figure 5.
23
The pulse front tilt is realized by tilting the pulse front of the optical beam with respect to phase front, which were initially perpendicular to the direction of propagation of the optical beam. THz radiation is excited along this tilted pulse front direction. The pump pulse propagates with a velocity gr
vis
v , but the projection of this velocity in the direction of propagation of the generated THz is gr
vis c
v .cosθ .
Here, θ is the tilt angle introduced in order to match the group and phase c velocities of the THz and optical pulse respectively. Thus, the phase matching condition in this case will be given by
cos
gr ph
vis c THz
v .
θ = v
(2.22)Using this scheme, it is possible to match the two velocities by choosing an appropriate tilt angle θc , in a material with significantly large dielectric constant.
Figure 5. Coherent THz generation in tilted-pulse-front geometry. In this process, the phase mismatch between the optical and THz waves is overcome by tilting the pulse front of
the optical wave, thereby resulting in a new phase matching condition: v cosθoptgr c vTHzph . Due to this phase matching, unlike the Cherenkov mechanism, all the generated THz
24
2.4.3.1 Pulse front tilt introduced by a grating
In order to tilt the pulse front of the optical beam with respect to the phase front, a grating is typically used. The typical method to tilt the pulse front using a grating is shown in Figure 6. Using simple ray optics formulation for an optical beam that is incident on the grating with an angle α and is diffracted by an angle β, the pulse front tilt angle θc is given by the following expressions:
sin tan tan cos c θ = (2.23)
This equation can be rewritten as
sin sin tan cos c θ = (2.24)
By using the grating equation sinsin mN, where α and β are the angle of incidence and diffraction, respectively, m is the order of diffraction, N is the number of grooves per millimeter of the grating, and λ is the wavelength of the optical beam, the pulse front tilt angle is given by:
mN tan cos c θ = (2.25)
25
Figure 6. An optical beam incident on the grating (at an angle α)with a pulse front and phase front perpendicular to the direction of propagation of the beam. After diffraction (at
an angle β) the pulse front of the grating is tilted by an angle c.
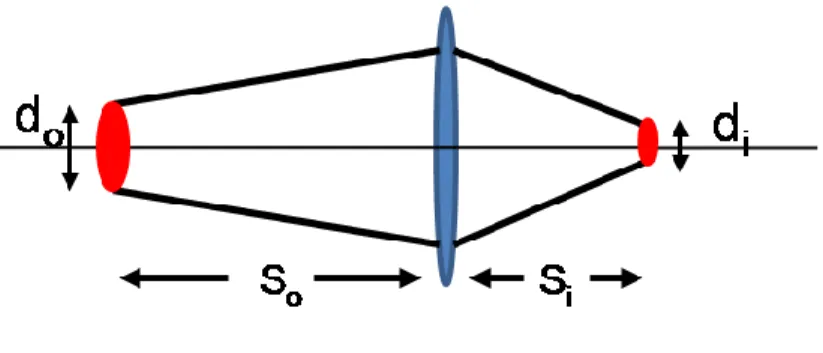
The optical beam diffracted from the grating will diverge according to the bandwidth of the laser. In order to collect the beam and to achieve higher intensity at the crystal position, a lens is used, as shown in Figure 7, to image the optical beam on to the crystal position (di) with a certain demagnification with respect to the spot size at the grating position (d0). This demagnification (F=do/di=So/Si, where So and Si is the object and image distance in the one-lens configuration) will increase the tilt introduced by the grating by a factor F, so the tilt equation will be : tan cos c FmN θ = (2.26)
26
Figure 7. Imaging of the laser beam spot with a demagnification of F=So/Si, where So and
Si are the object and image distance respectively.
Eq. (2.26) is for a beam propagating in air, but for THz generation, the beam must propagate inside the LiNbO3 crystal, and thus the index of refraction of the crystal will also play a role in the pulse front tilt. If nopt is the index of refraction for the optical beam inside the crystal, then the pulse front tilt equation will be:
tan cos( ) c opt F mN n (2.27)
From this equation, the angle of diffraction is given by:
-cos tan 1 opt c F mN n (2.28)
Using the grating equation, the angle of incidence of the input beam can be determined by:
27
-
-sin - sin cos
tan 1 1 opt c F mN mN n (2.29)
If the optical pump beam is incident onto the grating, with an angle of incidence α given by the above equation, the required pulse front tilt for the phase matching condition in the sLN crystal will be introduced into the optical beam.
2.4.3.2 Optimization of the pulse-front-tilting setup
In order to obtain optimal pump-to-THz conversion in a tilted pulse front setup, the following conditions have to be fulfilled:
1. Velocity matching of the pump and the THz radiation require a certain tilt angle θ of the pump pulse c front inside the crystal, given by Eq. (2.27)
2. The pump pulse duration has to be minimal across the tilted pulse front.
3. The pump pulse front has to be flat within the crystal.
2.4.3.3 Description of the sLiNbO3 crystal used to implement
the tilted pulse front technique
The crystal used in our experiment is a 1mol% Mg doped LiNbO3 crystal. The optical properties of the LN crystals are improved by Mg doping. In Mg doped
28
sLN crystal, the photorefractive losses are found to be dominant [66]. In order to fulfill the velocity matching condition, the crystal is cut at 630, which is determined by the group index of the optical beam and the phase index of the THz beam inside the crystal. In our case, their values are 2.25 [49] and 4.95 [67], respectively. The top view of the crystal is shown in Figure 8.
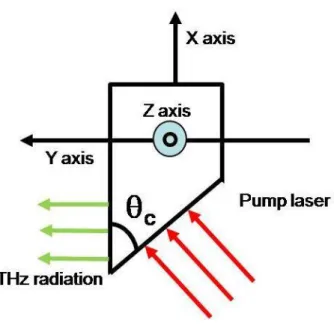
Figure 8. Top view of the sLN crystal. The crystal is cut at the phase matching angle θc. THz radiations will be generated (green arrow lines), when an optical beam (red arrow lines)
is incident on to the crystal with a pulse front tilt angle of θc, so that the phase matching condition is satisfied.
29 2.4.3.4 Experimental set-up
For developing this source, the kHz Ti:sapphire laser available in the ALLS laboratory at the INRS campus in Varennes is used. This laser delivers 4 mJ laser pulses with 30 fs pulse duration at 1 kHz repetition rate and with a wavelength of 800 nm. The diameter of the optical beam is 5 mm. The layout of the experimental set up is shown in Figure 9.
.
Figure 9. Experimental set up layout. The input laser is split between the pump and the probe beam using beam splitter BS1. The pump beam is used to generate THz using tilted
pulse front method in LiNbO3 crystal. The generated THz is steered using four off axis mirror and focused at the ZnTe crystal. The probe beam is used to detect the generated THz via electro optic sampling technique. The THz signal is measured using lock-in amplifier and
30
The pump beam is split into two parts using a combination of a half wave plate and a polarizing beam splitter BS1. The horizontally polarized beam is first demagnified by a factor of 2 by using a telescope made of two lenses with focal lengths of 200 mm and -100 mm, respectively. This demagnification is required to increase the pump laser intensity at the crystal position. This demagnified, p-polarized beam is sent to the grating (which is more efficient for p-polarization). The s-polarized beam is sent to the detection side (probe line). The pump beam is incident onto the grating with an angle of incidence of 37.31°, determined by Eq. (2.27). The pump beam diffracted from the grating is imaged onto the crystal with a demagnification of 1.7, using a lens with a focal length of 75 mm. After the lens, a half wave plate is placed between the lens and the crystal, in order to rotate the polarization of the pump beam from horizontal to vertical, resulting in the polarization of the pump laser parallel to the z-axis. THz radiation is generated from the crystal and is collected by the gold-coated off axis parabolic mirror. The THz beam is focused on to the 0.5-mm-thick ZnTe detector crystal using an off-axis mirror. In order to maintain the linearity of the detection, the THz electric field is reduced at the ZnTe crystal using wire-grid polarizer and silicon wafers. Free-space electro-optic (EO) sampling is used for the detection of the THz signal [46].
2.4.3.5 Source characterization
A. Energy measurement:
Our first measurement was done to investigate the efficiency of THz generation using the tilted-pulse-front technique in an sLN crystal. For this purpose, the THz energy is measured using a pyroelectric detector (Coherent
31
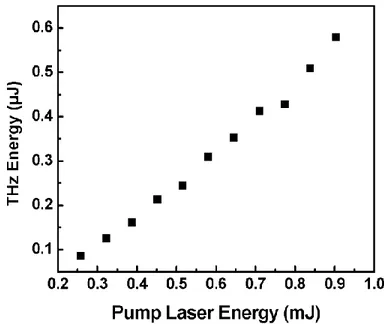
Molectron J4–05). Figure 10 shows the dependence of the THz electric field on the optical pump energy. The maximum energy is measured to be 0.6 J, with an input pump power of 0.9 mJ at the sLN crystal surface. This results in a maximum conversion efficiency of 4
6 10 . In an optical rectification (OR) process, one would expect the THz pulse energy to increase quadratically with the incident pump fluence. Instead, it is clear from Figure 10 that the process is partially saturated, thus resulting in a linear increase of the THz energy as a function of the laser pump energy. In the present configuration, the pump energy could not be further increased, to avoid damage of the grating. As such, we did not reach the complete saturation regime.
Figure 10. THz energy as a function of optical pump energy. The THz energy is measured using pyroelectric detector (Coherent Molectron J4–05).
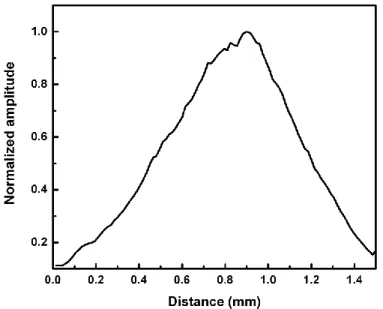
32 B. THz spot size measurements
In order to complete the evaluation of the source, we imaged the THz beam at the focus using a pyroelectric IR camera (ElectroPhysics, model PV320). In this way, we could evaluate easily the peak electric field using the full characteristics of the beam, specifically the energy and physical dimensions of the THz beam at the focus. Recently, we have been able to capture the image of the THz beam using a BaSrTiO3 (BST) pyroelectric infrared camera (Electrophysics model PV320-L2V). This camera operates with an internal 10 Hz chopper and has a 320 240 pixel imaging array, with a pixel spacing of 48.5 m, with a spectral response between 7 to 14 m. This camera shows the possibility of imaging high-power THz beams directly and in real time [26]. In Figure 11, we show the image of the THz beam at focus, which is used to estimate the electric field. The measured spot size is 0.80.7 mm2 at 2
1 / e of the intensity profile.
Figure 11. Image of a focused 0.6 μJ THz pulse generated using a 0.5-mm-thick ZnTe crystal. The measurement is done using pyroelectric infrared camera (Electrophysics model
33 C. THz pulse shape measurement
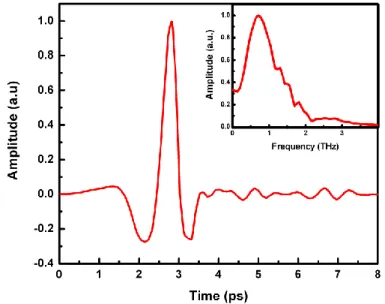
The temporal shape of the THz pulse is measured using the EO sampling method previously discussed in section 2.3. Figure 12 shows the THz pulse shape, and the inset shows the Fourier spectrum corresponding to this temporal profile.
Figure 12. Temporal shape of the THz pulse measured using electro optic sampling. Inset shows the corresponding spectrum.
We have evaluated the THz electric field, following the same method as reported in [68], i.e. by using the following expression
0 0 2 2 opt η W E = πw g t dt (2.30)34
Here, E0 is the THz peak electric field, η0 is the free-space impedance (377 ohms), W is the THz energy, wopt is the intensity beam waist, and g(t) is the temporal shape of the THz electric field (with a peak value normalized to 1), which can be easily retrieved from the EO sampling measurements.
Knowing the THz spot size, the temporal profile of the THz pulse (measured from EO sampling), and the THz energy measured from the pyroelectric detector and substituting all these values in to Eq. (2.30), the THz electric field can be evaluated. For our LN THz source, we evaluate a peak THz electric field at the focus of the ZnTe detector position of .
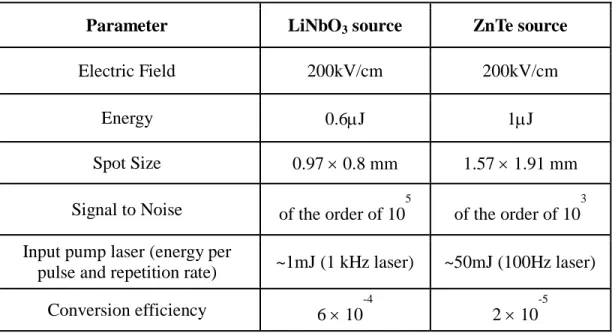
2.5 Comparison of the tilted pulse front LiNbO
3THz source
with the large aperture ZnTe THz source
We have compared the tilted-pulse-front based LiNbO3 THz source with another intense THz source available at ALLS [26] based on optical rectification in a large aperture ZnTe crystal. The ZnTe source uses a laser with ~60 mJ energy and at a repetition rate of 100 Hz. Table 2 gives the comparison of different parameters for the two sources. As can be seen from
Table 2, the efficiency of the tilted pulse front LiNbO3 source is 30 times higher than the ZnTe source; this shows that the tilted-pulse-front technique is one of the most promising way to generate intense THz radiation, with 50 times less driving laser energies required for similar performances.
35
Table 2. Comparison of the tilted pulse front LiNbO3and large aperture ZnTe source
Parameter LiNbO3 source ZnTe source
Electric Field 200kV/cm 200kV/cm
Energy 0.6J 1J
Spot Size 0.97 0.8 mm 1.57 1.91 mm
Signal to Noise of the order of 105 of the order of 103 Input pump laser (energy per
pulse and repetition rate) ~1mJ (1 kHz laser) ~50mJ (100Hz laser)
36
Chapter 3
THz detection using spectral
domain interferometry
3.1 Introduction
As discussed in the previous chapter, for the EO detection of intense THz electric fields, we had to reduce the electric field at the detection crystal using wire-grid polarizers or several silicon wafers, in order to maintain the linearity of the detection.
In EO sampling, a linearly polarized femtosecond laser pulse co-propagates with a picosecond THz pulse in an EO crystal. The THz electric field induces
37
birefringence in the crystal, which changes the polarization of the linearly co-propagating laser pulse. The change in the phase between the two polarization components of the probe beam (which is proportional to the THz electric field) can be measured by using two cross polarizers placed before and after the detection crystal. In this case, the phase change appears as a modulation in the intensity of the probe beam. The complete THz waveform can be reconstructed by scanning the probe pulse over the entire THz pulse.
To improve the performance of EO sampling, several refinements have been proposed. Such improved THz detection techniques include chirped pulse or spectral encoding techniques [27], cross correlation techniques [69], two dimensional THz pulse characterization techniques with dual echelons [70] and tilted wavefront detection techniques using a prism [71].
All the aforementioned EO-sampling-based techniques have used two cross polarizers to measure the THz electric field. However, with recent advances in high power THz generation techniques, the use of thicker crystals poses a big problem in terms of over-rotation. If the THz electric field is high enough to introduce a phase difference of more than 90°, this leads to a reversal in the intensity modulation of the detection beam, leading to ambiguities in the measured THz field [72]. This situation is termed as "over-rotation". Birefringence introduced in the EO crystal is proportional to both the THz electric field and the thickness of the crystal. One could in principle use thinner crystals to avoid over-rotation, but this is not desirable due to internal reflection. Moreover, the use of thin crystals reduces the signal-to-noise ratio (SNR) of the measured THz signal, due to the decrease in interaction length.
To overcome the limitation of over-rotation in the measurement of an intense THz signal, we propose a novel technique based on spectral domain interferometry (SDI). In this technique, instead of using two cross polarizers, we measured the change in the phase difference introduced in the probe beam due to the THz electric field. The suitability of spectral domain interferometry in measuring phase changes as small as few micro-radians has already been demonstrated by various groups [73]. This technique not only overcomes the
38
problem of over rotation, but also simplifies the set-up by eliminating the need of polarization optics after the EO sampling crystal and the lock-in amplifier.
3.2 Theoretical background
The SD-LCI technique is based on a Michelson interferometer [74], where a broadband, low coherence source is used to illuminate a reference surface and a sample as shown in Figure 13.
Figure 13. Schematic of spectral domain interferometry. The broadband light source is split in two parts. One part of the beam goes to sample surface and the other goes to the reference surface. After reflection from sample and reference surface, the two beams are sent to the grating via beam splitter. The diffracted spectral components of the beam are focused by lens and the interference pattern between the various spectral components of the
39
Consider that the sample is composed of two reflecting layers, one at an optical path difference of Z1 and another at an optical path difference of Z2 from the reference surface. The reflected light from the two illuminated objects is combined onto a dispersion grating that angularly separates the different wavelength components, which form an interference pattern onto a linear CCD camera using a lens. At the image plane, the phase difference between the signal reflected from the reference surface and the first layer of the sample is given by [75, 76]: 1 0 1 4 ( )k Z (3.1)
where λ is the wavelength, is the phase change introduced by reflection at the first layer and Z1 is the optical path difference between the reference surface and the first layer. Eq. (3.1) can be rewritten in terms of the wave-number, k = 2π/λ, such that
1( )k 0 2kZ1
(3.2)
which is a linear relationship between the phase and the wave-number. As the frequency along the k-axis is given by the rate of change of the phase with respect to the wave-number, Eq. (3.2) leads to
1 1 1 ( ) 1 2 k k Z f k (3.3)
Similarly for the second reflecting layer in the sample, the frequency of the phase is given by
40 2 2 2 ( ) 1 2 k k Z f k (3.4)
One should note that analysis in the k-space is preferred to λ-space since fk is independent of k, whereas the equivalent frequency derived from Eq. (3.1) in λ-space, would vary with λ. Thus, sampling the interferogram intensity data uniformly along the kaxis would cause a broadening in the frequency spectrum, which reduces axial depth resolution of the system [75, 76].
The intensity distribution along k-axis on the linear CCD camera as a result of the interference between the signal reflected from the reference surface and the signal reflected from the two layers of the sample can be expressed as
1( ) 0( ) 2 r( ) ( ) cos1 1( ) 2 r( ) ( ) cos2 2( )
I k I k I k I k k I k I k k (3.5)
where I0(k) is a dc term, Ir(k), I1(k) and I2(k) are the intensity of the signals coming from the reference surface, the first layer, and the second layer, respectively, and
1(k) and 2(k) are the phase difference between the signal from the reference surface and the first layer, and the reference surface and the second layer, respectively. Because of the presence of cosine term and the fact that the phase difference is dependent on k, a modulation in the spectrum intensity along the k-axis is introduced. In Eq. (3.5) the modulation is the result of two signals with frequencies given by Eq. (3.3) and (3.4), which are directly proportional to Z1 and Z2, respectively. One should note that if there were Nl layers in the sample, the signal from each layer would interfere with the reference signal and produce a modulation in the spectrum intensity along the k-axis whose frequencies would be proportional to the optical path difference between the reference surface and all Nl corresponding reflecting layers. The Fourier transform of the intensity pattern at

![Table 1. Comparison of different materials for THz generation via optical rectification[49]](https://thumb-eu.123doks.com/thumbv2/123doknet/5402134.125867/30.918.171.749.791.1056/table-comparison-different-materials-thz-generation-optical-rectification.webp)