Science Arts & Métiers (SAM)
is an open access repository that collects the work of Arts et Métiers Institute of Technology researchers and makes it freely available over the web where possible.
This is an author-deposited version published in: https://sam.ensam.eu
Handle ID: .http://hdl.handle.net/10985/18515
To cite this version :
Tharmalingam SIVARUPAN, Mohamed EL MANSORI, Nicolas CONIGLIO, Matthew DARGUSCH - Effect of process parameters on flexure strength and gas permeability of 3D printed sand molds - Journal of Manufacturing Processes - Vol. 54, p.420-437 - 2020
Any correspondence concerning this service should be sent to the repository Administrator : archiveouverte@ensam.eu
1
Effect of process parameters on flexure strength and gas
permeability of 3D printed sand molds
1,3Tharmalingam SIVARUPAN*, 1,2Mohamed EL MANSORI, 1Nicolas CONIGLIO,
3Matthew DARGUSCH
1Laboratoire MSMP-EA7350, Arts et Métiers ParisTech, 2 Cours des Arts et Métiers,
13617, Aix-en-Provence, France,
2Texas A&M Engineering Experiment Station, Institute for Manufacturing Systems, Texas A&M University, College Station, TX, 77843, USA,
3Centre for Advanced Material Processing and Manufacturing (AMPAM),
The University of Queensland, Brisbane, Australia.
1. Abstract
3D printed sand molds for the casting industry play a vital role in manufacturing intricate parts from a computer model. The possibility of producing fairly significant structural castings using a small job-box 3D sand mold printer is another advantage compared to the direct metal 3D printing processes. It is important to identify the relationship between the process parameters and the properties of the sand mold in order to produce a mold with the required strength, permeability and stiffness; to reduce gas emissions during casting and minimize the mass of combustible materials in the mold. Hence, it is possible to create an excellent casting by improving the design of such molds for liquid alloy filling and solidification. The relationship between the printing parameters and the properties of the mold can be a great tool for foundrymen, primarily to optimize the strength and permeability properties of these molds and therefore to provide exact boundary conditions for the solidification simulation prior to a casting trial. This paper reports on a study of a basic outline to quantify the role of the sand mold printing process parameters, particularly the recoater speed and print resolution, on the
[*] Dr T Sivarupan (E-mail: t.sivarupan@uq.edu.au), Prof. Dr. M El Mansori (e-mail l:
mohamed.elmansori@ensam.eu) , Dr N Coniglio (e-mail : niclolas.coniglio@ensam.eu), Prof M Dargusch (e-mail : m.dargusch@uq.edu.au)
2
mold strength and permeability, and their impacts on the anisotropic behavior of the printed sand molds.
Keywords
3D Printing, sand mold, granular materials, additive manufacturing, low-pressure sand casting
2. Introduction
The authors have recently published a review article related to 3D sand mold printing and therefore a breief literature study is incorporated in this paper [1]. 3D sand mold printing technology (with resin and hardener) is used in current casting processes not only for rapid prototyping of sand mold but also for large-scale production [2]. It shows economic advantages over the traditional pattern making process, especially, in case of higher part complexity and high production volume, or, in the event of low production volume regardless of the complexity [3,4]. 3D sand mold printing has proved to utilese the design freedom for cast models. It became possible to achieve quality casting by using conical-helix sprue in the design of mold assembly and this exhibits reduced inclusions withing the castings and hence higher ultimate flexural strength of the cast products when compared to straight sprued casting in the traditional casting process [5]. 3D printed sand molds show superior mechanical strength, compared to the traditional sand molds, with low gas emissions; greater dimensional accuracy and structural stability at high temperature, and can be printed directly from a complex CAD model (especially cellular structures [6]) [7]. A schematic of the steps in printing process can be seen in Fig. 2 of Ref. [1]. which focuses on the 3D printing of inorganic sand mold. A most recent study revealed that the castings produced through printing 3D sand mold reduce the overall energy and resourses consumption per unit mass of product, compared to the traditional casting process [9]. In addition to the design freedom for sand casting products through 3D printed sand molds, riser insulated with hollow structures helps retain the molten metal for prolonged time, and hence the feeding efficiency is enhanced.[10,11]
Metallic parts produced using 3D- /direct- metallic printing technology, show anisotropic mechanical properties and especially have weak strength in the Z-direction [12]. Casting using a 3D printed sand mold would be, hence, a better choice to overcome this issue, in addition to the previously discussed advantages over traditional mold making. Moreover, the production of the sand mold assembly is not limited to the size of the job box and therefore any significantly
3
large single castings can be produced. It is not limited by the type of alloy to be used as long as the alloy is castable for a particular design and a choice of right sand is made for the mold printing. With the direct metal printing, only a part size compareable to the job-box size would be possible to produce otherwise multiple number of parts should be assembled to have a large scale object.
However, the 3D printed mold should have sufficient mechanical strength to avoid damage during handling or before casting, and also to prevent erosion and distortion of the cavity surfaces by the pressure and temperature of the molten metal during pouring and solidification. Therefore, the process parameters of a 3D printer should be carefully selected to obtain the desired minimum strength. The strength and gas permeability can be competing factors. It is not an aim to produce molds with high strength and therefore, it is important to understand the process parameters for required properties of sand mold before printing them. Molds with higher strength can also cause casting defects such as hot-tearing in the final casting. Excessive amounts of binder will not only increase the cost of production but also cause mold shrinkage [13] and produce excessive gas during casting which can cause porosity in the casting. Excessive binder usage in the sand mold or having a large mold to casting volume ratio [14] can also reduce gas permeability and increase the amount of toxic gases such as CO (e.g., more than 30 ppm, for aluminum depending on the pouring temperature) [15] produced during casting. Optimizing the amount of binder content is therefore an important issue, also, for the quality of the sand casting. An unreasonable amount of catalyst, which is used to assist the polymerisation of resin, in the mold could also cause mold/core shrinkage, especially during its evaporation [13]. A recent study showed that the permeability and the 3PB-strength can be optimum when curing the mold at 100 °C for 2 hours for the sand mold with binder content up to 2 wt.% [16], and the printed sand mold can be preserved for later use for a long time without significantly altering its 3PB-strength and permeability [17]. Few other studies also have been recently published on how the sand mold can be characterised using x-ray tomographic study [18,19] to reconfirm the boundary conditions (e.g. gas permeability of the mold) that had been used in mold filling and alloy solidification simulation before the actual casting; whether the actual properties of the printed mold are similar to those used in the computer simulation. Hence, the relationship between these parameters of the 3D sand mold printing process and the properties of the printed mold are of vital importance.
Phenolic and furan binder systems are the two commonly used organic binders in the 3D printing of sand molds; the former is reported to have lower heat absorption rate [20] due to
4
higher bound water content compared to the latter. 3D printed molds show greater structural stability at high temperature, compared to the traditional chemically bonded molds which produce more significant amounts of gas and hence are associated with poor casting yields [7]. Controlling the amount of binder content is a major issue in producing a mold with the required mechanical and binder burn out properties. The curing mechanism of furan resin and its thermal strength [21], and the optimization of process parameters for the cured 3D printed sand mold focused on the properties of ZCast™ 3D have been studied elsewhere [22–25].
Furfuryl alcohol-based furan resin starts polymerizing to give water and a solid crosslinked polymer when exposed to sulfonic acid. This cross-linked polymer binds the sand particles within the 3D-printed sand molds.
Mechanical properties of the 3D printed sand mold depend directly on the variation in the compacting force applied on the sand bed (by the recoater) during the printing process, the volume and resolution (at each coordinate of the job box) of binder droplets, and also its type, and the sphericity of sand particles used. Recoater blade gap, which cannot be freely increased, determines the amount of sand particles to be droped on the sand bed. The compacting the sand bed should be done in a very controlled manner. Both of these will severely affect the dimensional tolerance of the printed part. Hence, the current study is focused on optimizing these process parameters to 3D print any sand mold with the necessary average strength and permeability. It is vital to produce a mold with good gas permeability to enable rapid evacuation of both the gases in the mold and the gases produced during casting without causing feeding issues or gas porosity within the casting. A recent study revealed that the use of special and more rounded sand particles can help smooth 3D sand mold printing process especially during the release of sand particles from the recoater of the printing machine [26]. These engineered sand particles are usually supplied by the manufacturers of sand printers and were used during the current study.
The primary objective of the experiments was to measure the effects of the recoater speed and X-resolution of the printhead on the 3DP mold characteristics. There are only two major companies that produce these types of machine. Both are licensed by The Massachusetts Institute of Technology (MIT) to manufacture this kind of 3D sand mold printers. Hence, all of the 3D printing machines for furan sand molds have similar manufacturing processes whether it is a horizontal printing or inclined printing type.
5
The 3PB test (three-point bending/ flexure strength), tensile testing on dog bone shape specimen or compressive testing [27], gas permeability and the mass of combustible materials present (loss-on-ignition, LOI) in the mold are some of the parameters that can be measured to characterize the properties of sand molds. It has been hypothesized that the properties of the 3D printed sand mold mainly depend on the excellent packing of sand particles and for this reason only the 3PB test, permeability test, and density calculations were incorporated in this study. Once these process parameters for optimum packing are identified, a suitable bonding material (Phenolic binder system with higher mechanical performance for ferrous alloys, furan binder system for light alloys, or any other inorganic binder system.[8]) and related process parameters can be chosen to print a part with the required properties. This study also analyzes the suitability of these traditional characterization methods for a 3D printed sand mold. In the modern casting process, solidification simulations can be performed, before a casting trial using a computer software program. To do this, a 3D model of the 3D printable sand mold with its original properties of the sand compaction and binder may be useful to precisely simulate the solidification process.
3. Experimental method
3.1 3D Printing process
Recoater speed is the speed at which the recoater spreads the pre-mixed sand (with the activator) on the building platform. X-, Y-, and Z- resolutions are the minimum distance after which the printhead nozzles inject the binder droplet on demand over the previous layer of sand. The X-resolution is adjusted based on the set X-resolution by altering the speed of the print head whereas the Y-resolution is always a constant, 101.6 µm for the ExOne S-print. This is the fixed distance between the ink jet nozzles in the Y-direction. Z-resolution is determined by the sand layer thickness and depends on the average sand particle size. Usually, twice the average sand size is set to obtain excellent strength of the printed mold or in other words to maximize the wetting of sand particles by the resin. It is clear that the print resolution is non-uniform in the X, Y, and Z directions and hence this results in anisotropic properties of the printed sand mold in these directions.
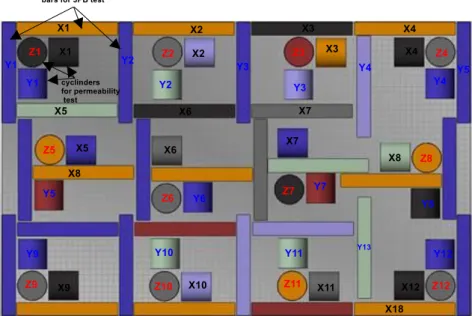
A job box, Fig. 1, was designed using a commercial software program, NetFabb™, in order to cover the maximum possible number of samples to be printed in the platform to test the effect
6
of coordinates and other process parameters (Table 1) such as recoater speed and x-resolution on the compaction of the 3D printed mold using the furan binder† – acid activator‡ system. There were 12 × 3(-directions for each of the 12 coordinates in the job box) cylinders§ to test the permeability and 18 and 14 bars** in X- and Y- directions, respectively, to assess the three points bending strength (3PB), in each job-box. 3PB tests on the printed bars and permeability tests on the cylinders were carried out as shown in Fig. 2. Results were compared in 3D plots to imitate the job box coordinates in the XY plane with permeability, 3PB, or density along the z-axis.
Fig. 1: Top view of the Job box configuration. There were 12 randomly placed (to represent various job box coordinates) cylindrical specimens in each X, Y, and Z orientation as well as 18 bar specimens in each X and Y directions. X1-X18 refer to the X-oriented 3PB test bars and Y1-Y14 the same for the Y direction. A similar nomenclature was used for the cylindrical permeability test specimens; X1-X12/ Y1-Y12/ Z1-Z12.
The printing process was initiated by mixing the sulfonic acid (0.18 wt.% of the sand) catalyst
and Mg inhibitor (0.4 wt.%) with 8kg of sand particles and temporarily storing this in the mixing
chamber of the 3D printing machine. It was then passed into the recoater which spread these
sand particles at a maximum horizontal speed of 1.3 m.s-1 however only 10 to 22%
† furfuryl alcohol, room temperature density 1130 kg/m³ ‡ Sulfonic acid, room temperature density 1220 kg/m³ § Dimensions ; radius 50 mm and height 50 mm ** Dimensions 22.4 × 22.4 × 172 mm3
7
0.286 m.s-1) of this maximum achievable speed was investigated, as shown in Table 1. Around
ten layers (1.4 mm = five times recoater movement × 2 layers each time × sand particle size of
140 µm) of these acid and Mg inhibitor-mixed sand particles were initially deposited on the
job-box, to avoid sticking the printed part to the job-box, before the print-head sprayed the
furfuryl alcohol based resin on demand as per the first cross-sectional slice of the designed part
(STL file††). Then two layers of these acid-mixed sand particles are spread on the job-box again,
once the job-box had been lowered by 280 µm in the Z-direction. The process continued until
the last slice of the STL file was printed, and the final two sand layers were spread. The 3D
printings were performed in a room maintained at a temperature of 25±3 °C and relative
humidity of 40± 10 %. The specimens were taken out of the job box and cleaned. They were
tested after holding for 24 hours to ensure a complete polymeric cross-link and therefore the
maximum mechanical performance in the printed specimen, [7,28] as stated in the next
paragraph. The manufacturer of the 3D sand printing machine recommends using the recoater
speed range between 0.11-0.2 ms-1(~10-16 %) [29] without any correlation with adjustable
recoater blade gap or the sand particle size‡‡. It is hypothesized that these parameters influence
the spreading of the sand particles and hence the properties.
Sand§§ particle size (140 µm), activator content (0.18 wt. % of sand), mixing time of sand with
activator (60 s), magnesium inhibitor (0.4 wt. % of sand), heating temperature (32°C) and print
head voltage (78V) were all kept constant. The dotted color code indicates the 0.14 mm, and
the solid color is 0.12 mm X- resolution of the printing in the Table 1 and Figs. 4-7. One color
code for the same recoater speed and this code will be used in the 3D plots.
††(1) the cyclindrical model, for the permeability test, with 50 mm height and 50mm radius was sliced (50000 µm/280µm ≃) into 178 circular cross sectional slices of each 50 mm radius for the Z-oriented specimens and the others (X- and Y- oriented) had variable sized rectangles with a maximum size of 50×50 mm2 (2) and the 3PB test specimen had (22400 µm/280µm≃) 80 rectangular cross sectional slices of each 172 mm× 22.4 mm.
‡‡ Commercially avaiable sizes of 140, 190, or 250 µm
8
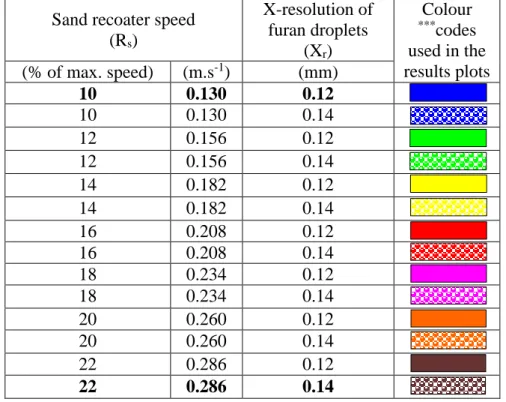
Table 1: The process parameters used in the experiments. The recoater speed is expressed in m.s-1 or as % of maximum achievable speed of the printer used for the study; e.g., 10% (first column) refers 0.130 m.s-1
Sand recoater speed (Rs) X-resolution of furan droplets (Xr) Colour ***codes used in the results plots (% of max. speed) (m.s-1) (mm) 10 0.130 0.12 10 0.130 0.14 12 0.156 0.12 12 0.156 0.14 14 0.182 0.12 14 0.182 0.14 16 0.208 0.12 16 0.208 0.14 18 0.234 0.12 18 0.234 0.14 20 0.260 0.12 20 0.260 0.14 22 0.286 0.12 22 0.286 0.14
3.2 Testing of Mechanical and Physical Properties
3PB tests on the 3D printed sand bars were performed, Fig. 2 (a), using an electric motor driven 3PB testing machine (Simpson brand, measuring range up to 12.8 MPa with a precision of ±0.05 MPa when using the low-pressure gauge mode) at a load rate of 0.1 MPa.s-1. Only X- and Y- directions were considered in regard to the 3PB strength due to financial reasons inorder to minimize the job-box volume during printing of the specimens. However, permeability was tested in the z-direction as well. The mold assembly will most probably fail in the X- or Y- direction (tension) as the Z- direction will be under self-loading (compression) of the assembled mold, in the case of weaker 3PB strength, during casting. This is another reason for the omission of the 3PB-test in the Z-direction. However, it may be of interest in a future experiment. The gas permeability measurements on the cylindrical specimen, as indicated in Fig. 2 (b), were carried out using a Simpson digital permeability meter by the orifice standard method
9
recommended by AFS, with measuring range 0-1000 ±1 GP†††. The calculation of gas permeability was performed using equation 1.
𝐺𝑝 = 𝑄×ℎ
𝐴×𝑝×𝑡 (1)
Where Gp is the gas permeability, Q - air volume in the chamber (2000 cm3), h - height (50mm) and A - cross sectional area 19.63 cm2 of the test specimen, p - pressure in cm of water, and t - passage time for 2000 cm3 of air in minutes.
Fig. 2: Schematic of (a) the 3PB test procedure for X and Y oriented bars and (b) the directions of permeability tests on the X, Y, and Z cylindrical specimens.
†††The gas permeability value (GP) gives the amount of air in cm3, which passes through a cube or cylinder, having
10
3.3 Microstructural characterization
Backscattered electron images of a few samples were also obtained (using the parameters shown in each micrograph) to check the grain size recommended by the supplier as well as the distribution of furan and sand particles. An X-ray tomography image obtained on one of the printed specimens is presented as an example from another study; the settings are shown in the next paragraph.
Micro computed tomography (µ-CT) images were acquired using an XT H225 L micro-focus CT system (Nikon Metrology, UK). The scans were obtained using a micro-focus 225 kV source fitted with a tungsten reflection target together with a Perkin Elmer XRD 1621 detector. The scan settings used were: 100 kVp, 83 µA, 354 ms exposure, 3142 projections acquired during a full 360° rotation using an average of 8 frames per projection. Only one slice is supplied here.
4. Results
While Fig. 3(a) and (b) show that sand particle size and distribution, Fig.3(a) show the binder distribution (the dark regions) on a 3D printed sand specimen. Measured flexure strength, density, and permeability values are compared in Figs. 4-6 and A- 1-3 (each Z-axis has the same range in all of these figures for better comparison while X and Y axes represent the same job-box coordinates for the comparable 3D plots) for the corresponding process parameters, Table 1. It is clear that there is a relative variation in the properties of the 3D printed specimens from different coordinates in the job-box especially when the recoater speed was very high, >0.234 m.s-1, Fig. 4(a)-(d) and 5 (a)-(d). Backscattered electron images obtained on the sand specimens printed from different job-box coordinates are compared, in Fig.8-9 , for two different Rs values, 0.182 and 0.286 m.s-1(14% and 22% of the maximum achievable speed of 1.3 m.s-1), even though there are no distinct differences observed on these images for the various process parameters or job-box coordinates.
11
(a) (b)
Fig. 3: (a) Backscattered electron image showing the compacted sand particles and furan resin (dark) on them (3D printed sand specimen, Rs=22%); SEM image of the resin-bonded silica sand‡‡‡ particles printed by S-Max ExOne™ 3D printer, showing the average grain size of 140 µm. (b) X-ray tomography image (one slice) showing the compacted sand particle (bright) distribution and the void region (dark) but not distinguishing the resin and sand (Rs=20%).
12
(a) (b)
(c) (d)
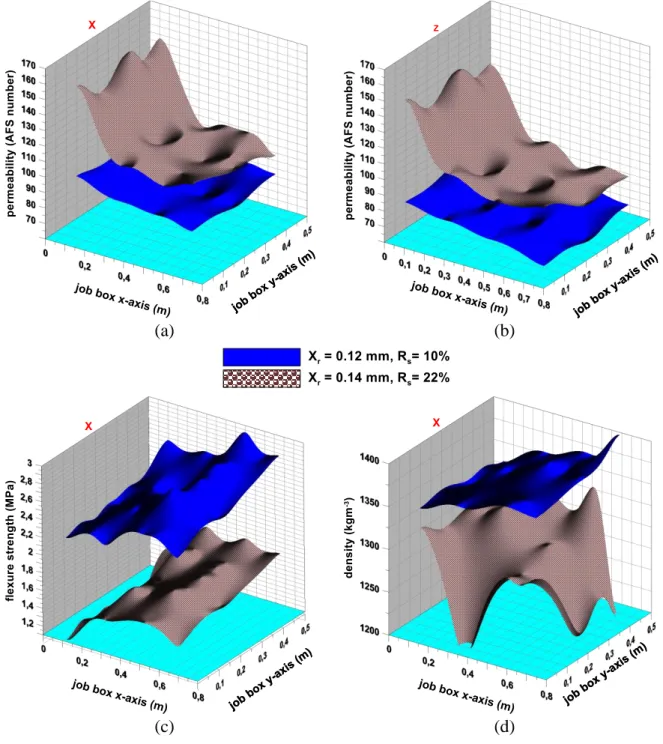
Fig. 4: Permeability (a) in x-and (b) z- directions, (c) flexure strength in x-direction (±0.05MPa) and (d) density in x-direction of 3D printed specimens as a function of job-box coordinate for different process parameters (the actual points are connected to create these contour surfaces using GrapherTM software); (blue) R
s=10%, Xr = 0.12 mm and (dot-dot brown) Rs=22 %, Xr = 0.14 mm for the specimens printed in the X or Z orientation as indicated on the top of the plots. For clarity, only the two extreme cases are shown here. The remainder of the data are shown in Figs. A-1-3.
13
Fig. 5: Flexure strength(±0.05MPa) as a function of job-box coordinate and process parameters (the actual points are connected to create these plot surfaces); for recoater speed between 10% and 22 %, (left, solid colour) Xr = 0.12 mm (right, dot-dot colour) Xr = 0.14 mm, and for (top) X and (bottom) Y orientation as indicated. (middle) This standard color code has been used in all of the following figures as well.
14
Fig. 6: Permeability of the 3D printed specimen as a function of job-box coordinate and process parameters(the actual points are connected to create these plot surfaces); for recoater speed between 10% and 22%, (left) Xr = 0.12 mm (right) Xr = 0.14 mm, and for X, Y, and Z orientation as indicated. See color code in Fig.5.
15
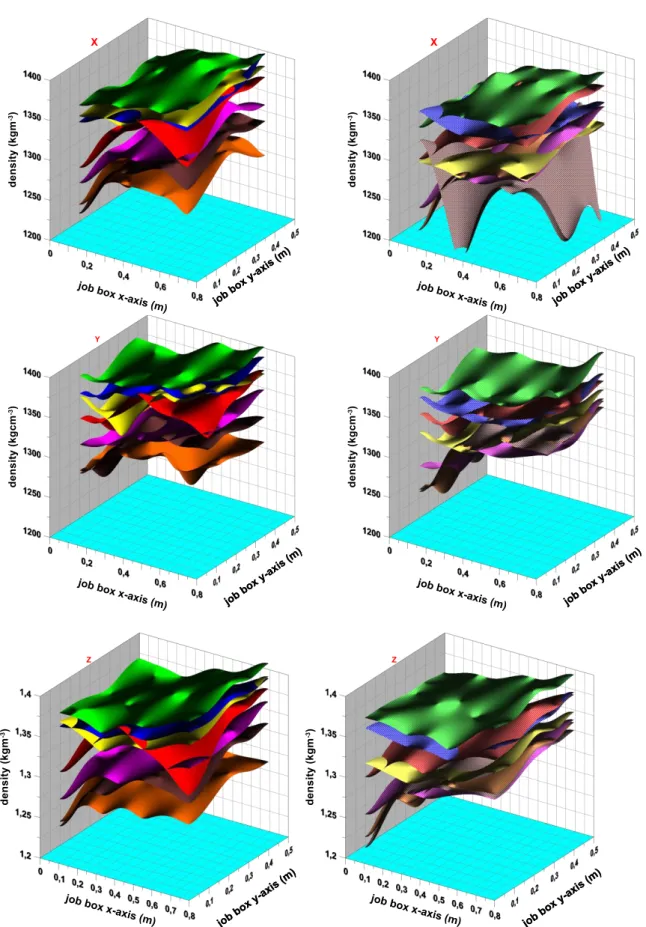
Fig. 7: Density of the 3D printed specimen as a function of job-box coordinate and process parameters; for recoater speed between 10% and 22 %, (left) Xr = 0.12 mm (right) Xr = 0.14 mm, and for X, Y, and Z orientation as indicated. See colour code in Fig.5.
16
Fig. 8: Representative SEM images of a 3D printed sand specimen printed at locations (top to bottom) 4, 6, and 9 of the job box (see Fig. 1) with different process parameters (left) Rs=14 % and (right) Rs=22 %. Higher magnification images are shown in Fig.9
17
Fig. 9: Higher magnification images of Fig.8; SEM images of a 3D printed sand specimen printed at locations (top to bottom) 4, 6, and 9 of the job box (see Fig. 1) with different process parameters (left) Rs=14 % and (right) Rs=22 %.
18
Fig. 10 (top) Flexure strength (±0.05MPa) variation with the recoater speed for (black) X and (blue)Y bars with (a) Xr = 0.12 mm and (b) Xr = 0.14 mm; error bars and the line connecting the mean values of flexure strength for each speed are displayed with the respective symbol colour. (bottom) Similar plots for permeability variations; (c) Xr = 0.12 mm and (d) Xr = 0.14 mm. Red colour indicates Z cylinders.
19
The three-point bending (3PB) strength does not seem to show a significant print orientation effect when X and Y oriented bars were considered, Fig 10 (a) or (b). For slower recoater speed range, around 0.130-0.182 m.s-1(10-14%), better and similar properties were achieved regarding the flexure strength, Fig.5, permeability, Fig.6, and density, Fig.7. At higher recoater speed, above 0.208 m.s-1 (>16%), inconsistent properties were obtained from different job-box coordinates for any particular printing process parameter. The overall density of printed specimens increased and permeability decreased with the reduced recoater speed and hence the three-point bending strength also increased. The three-point bending test is commonly used in industry even though the results of this method mainly depend on the quality of a narrow region (in the middle where the crack initiates) of the test specimen. As the 3D printed specimen was manufactured layer by layer, it can be assumed that the quality of any region within a test sample can be considered to be uniform in a particular direction. Hence, this method was used for an initial qualitative study to compare the effect of recoater speed, and also job-box coordinates, on the strength of the printed specimen.
4.1. Effects of the X-resolution on the flexure strength and permeability
The print-head injects the furan droplets closer to each other (in the XY plane) when decreasing the value of Xr (increased print resolution) in the printer settings and hence increase the binder content in the printed mold. The mold will be stronger and will have more binder content if the sand particles are packed well by the recoater. In other words, if the Xr value is increased, the amount of binder content in the printed part is decreased.
In contrast, to the above trend, the permeability of the 3DP mold is decreased by reducing the Xr value due to increased binder content blocking the pore connectivity in the mold. More attention must be given to the packing of sand particles rather than the Xr value unless it is larger than the sand particle size.
20
4.2. Effects of packing of sand particles on flexure strength and permeability
Fig. 11: Permeability as a function of the overall density of 3D printed cylindrical sand specimens for (a) both Xr=0.12 and 0.14 mm, (b) linear fitting of these data and the data for higher recoater speeds of 0.234-0.286 m.s-1 are indicated, (c) linear fitting of these data for Xr=0.12 mm only, and (d) data for Xr=0.14 only, when the print orientation was X, Y, and Z.
Quartz (Silica) has a theoretical density of 2648 kg.m-3 and hence compacted perfect spherical particles (not the attomic packing) of this silica can achieve an overall maximum density of 1960 (74% of 2648) kg.m-3 with hexagonal close-packing (not the attomic packing), 1801 (68% of 2648) kg.m-3 with body-centered cubic packing or 1387 (52% of 2648) kg.m-3 with simple cubic packing when considering the ideal sinario. Eventhough the sand particles do not have
21
perfect sphrical shape but they do have highier spericity than that are used in the traditional sand casting; these are engineered sand particles with precise particle size distribution (140 µm). The experimental results, Fig. 11, show that the maximum overall density of the 3D printed specimen is well below (only 54% is achieved, compared to the maximum achievable density of 74 %, refer previous paragraph) the theoretical maximum possible packing density due to sphericity <1 of particles and mostly less than perfect packing. Alternatively they may have been packed in near perfect simple cubic manner which is useful for permeability (48% space between sand particles), but not the best for strength. This needs to be further evaluated by X-ray tomography study inorder to veryfy the arrangement of these sand particle; the centre of gravity of these particles should be checked for the packing arrangement using software packages such as AVIZO™. Based on the density data of the printed sand mold the maximum possible packing was not achieved in any case. Therefore it can be assumed that the centres of gravity of these particles follow the packing of near perfect simple cubic pattern. This assumption may be valid based on the following facts, listed below(1-4).
(1) Maximum achieved density of parinted sand specimens was 1423 kg.m-3 (dry sand+acid+furan-evaporated water) and this is matching the theoretical density (1387 kg.m-3) value for the simple cubic packing of sand particles. Note: the dry sand density1418 kg.m-3.
(2) The sand particles were wet during packing hence very cohesive due to the mixed sulfonic acid.
(3) The sand particles are spread over the furan-spread, previous sand layer, hence these particles have a greater chance of sitting on the layer of previously coated particles than going in between the particles, i.e. to the lower level position required to densely pack them.
(4) Recoater always moved in one direction while spreading the sand particles.
The SEM images are in 2D, a 3D model is vitally important to verify the effective packing of these particles. In case, these assumptions are not valid, then the model explained in the next chapter can still be valid when the folow rate of the particles is considered.
22
5. The model for the recoating process parameter
Figure 12 shows a schematic depiction of the sand recoating process in the 3D sand mold printer. When the recoater moves horizontally from one position, A, to another coordinate, B, the sand particles free fall to fill a gap, Lz (= 2Dg, e.g., 280 µm ), in the job box, assuming the sand particle had no initial velocity. This assumption is valid as the recoating process does not project the sand particles with initial speed as this process may destroy the dimensional accuracy of the 3D printed parts. Even, if there were any initial speed of the sand particles, caused by the oscillating unit inside the recoater, this will be negligible due to the collision of a group of continuously following particles (which were wetted by the acid activator) on the wall of the recoater. This oscillating unit inside the recoater is designed to maintain the flowability of the acid-mixed sand similar to that of dry sand. In case there was a considerable initial speed of the sand particles, this would have caused a near perfect sand filling process with the higher recoater speed, however, the experimental results did not support this; the optimum recoater speed was 0.130 m.s-1 and is similar to the speed achieved, due to gravity, by the sand grains as they reach the job box from a distance equal to the layer thickness. If the sand particles had any initial speed, the density of the 3D printed part must have been greater than the dry sand density; this was not achieved with the recoater speed greater than 0.182 ms-1.
The following modelling idea may seem to approximate the ideal nature of the sand recoating process, assuming spherical sand particles, but the sand particles used in the 3D printing process are engineered sand particles with specified average particle size and had very narrow size distribution. The model does not consider each particle as a perfect sphere, but it assumes an average particle size. The model does not rely on the simple cubic packing, only it explains the supply of sand particles to fill the gap volume when the job-box was lowered by around 280 microns. It requires a minimum speed depending on the recoater gap which cannot be adjusted too large because it will severely affect the dimensional accuracy of the printed part. The volume of sand released must be equal to the volume created by lowering the jobbox during a recoater iteration. Moreover, the sphericity of the sand was around 70%, a previous study confirmed by the Exone company for its FS0001 sand particles.
The vertical free fall time, tz, taken by the sand particle when falling through a distance of Lz and the time, tx, taken by the recoater when moving from the position A to B in the horizontal direction which is equal to a distance Xrb, are related in the modelling the process. The sand particles come from a long distance through the recoating container by colliding with each other
23
or with the container wall but the distance they free fall is Lz. The relationship between these parameters is shown in Eqs. 2-6 and explained in the following paragraph. The obtained relationship between the recoater speed and the distance between its blade gap for various commercially available sand grain size are shown in the plots, Figs. 13-14.
Fig. 12: Schematic diagram of the printing process and the relationship between the Rs and recoater blade gap (Xrb) for optimum packing of sand particles. Note: the number of sand grains is not the same in each horizontal plane. The parameters required to obtain the relationship between Rs and Xrb for the optimum packing of sand particles are marked between the recoater positions A and B. The distance between these coordinates is equal to the recoater blade gap, Xrb.
24
From fundamental equation of motion (s=ut+1/2at^2, s-dispalcement, u-initial velocity, a-accelaration, t-time), by subtitution the following s=Lz, u=0, t-tz, and a=g, the acelaration due to gravity.
𝑡𝑧 = √( 2𝐿𝑧
𝑔 ) (2) Applying the same for the horizontal movement of the recoater,
𝑡𝑥 = ( 𝑋𝑟𝑏 𝑅𝑠) (3) (2) and (3) => 𝑅𝑠 = (√(𝑔 2𝐿𝑧)) 𝑋𝑟𝑏 (4) Modified (2) => 𝑡𝑧 = √( 3 2) √( 2𝐿𝑧 𝑔 ) (5) (3) and (5) => 𝑅𝑠 = √(2 3) (√( 𝑔 2𝐿𝑧)) 𝑋𝑟𝑏 (6)
The two different positions of the recoater, A and B (when the recoater moves from A to B the sand particles free fall to fill the gap in the job box, red color in Fig 12), are considered as in Fig. 12. The free fall time, tz, for a sand particle to reach the printing surface from the recoater and the time, tx, taken by the recoater blades§§§ to move a distance equal to the minimum gap between them must be equal in order to achieve excellent packing of sand particles. The relationship can be derived from Eqs.2-3 as in Eq. 4 to reach this best packing of sand particles scenario, and hence the relationship can be plotted, Fig.13, for any sand particle size; average sand grain diameter (note Lz=2Dg, see Fig.12). This plot can be used to identify a maximum recoater speed for a particular printing process. Fig.13 shows such plots for three different commercially available sand particle sizes; 140 µm, 190 µm, and 250 µm. Increasing the recoater blade gap may cause undesirable sand adhesion and hence poor dimensional tolerance of the printed mold or core. It is important to have a blade gap with an order of magnitude difference to the average sand particle size, e.g., 10-20 times of the sand particle size.
§§§ together, distance between them was measured by Vernier calliper as 2.9 mm (can be adjusted) and believed to be constant at all time. The sand particles were released through the gap between them.
25
Fig. 13: Maximum recoater speed for the corresponding minimum recoater blade gap (Xrb) to achieve optimum packing of sand during the printing process, calculated based on the free fall time of the sand particle (of size 140, 190 and 250 µm) and the Xrb. The recoater speed on the right is shown as a percentage of the maximum achievable speed of the ExOne™ S-print 3D printer. The actual measured recoater blade gap, 2.9mm**** and the effective blade gap, 1.6 mm††††, are marked on the x-axis.
An average sand particle size was considered in Fig. 13; if 2Dg >Lz then there is a chance for recoater to remove those larger particles, spreaded during a previous recoating process, because they are protruding above the recoater level. Hence, there might be few vacancies on the last sand layer. Therefore, the free fall time to reach a sand particle during the subsequent recoating
process also needs to be increased (√(3 2)
‡‡‡‡times of the previously calculated value, by
increasing free fall distance to 1.5 of the Lz, Eq.5 ) to fill these vacancies. The equation for tz can, now, be modified as in Eq.5 and hence the new relationship between Rs and Xrb can be obtained as in Eq.6. The modified model for this can be seen in Fig. 14. Cohesion between dry sand grains can be negligible, but the acid mixed sand particles should now experience cohesion
**** Initial manufacturer setting was 2.6 mm.
†††† Due to the sand adhesion with the wall of the recoater the effective blade gap is smaller than the actual value. ‡‡‡‡ Can be calculated by the equation 2 by applying Lz= 3/2 times the previous Lz value (3 layers of sand, instead of 2 layers).
26
between grains as well as with the wall of the recoater. The vibrating blades (within the recoater) assist in overcoming this cohesion between grains even though there might be a considerable effect on the effective Xrb (effective recoater blade gap, say, Xeff) due to the cohesion between grains and the wall. Therefore, in addition to the previous modification, it is now also important to consider the effective recoater blade gap (Xeff) when the acid mixed sand particles are used as this would cause the particles to stick on the wall of the recoater, and hence reduce the effective value of the recoater blade gap. Therefore, it is important to check the maximum recoater speed for a printing process with the corresponding Xeff (effective Xrb) value. This model fits with the experimental results to determine the maximum recoater speed for a printing process. Once the optimum recoater speed is identified for a printing process, the furan droplet size can be adjusted (by adjusting the print head voltage) to improve the strength further but with a severe loss of permeability. Furan liquid droplets are spread over the sand grains to bond them together even though the resolution equal to the sand particle size may not be sufficient to wet each sand grain by the sprayed furan droplets, due to the particle size distribution. Therefore, a value for Xr smaller than a value equal to the average sand grain size should be chosen for better homogeneous distribution of furan and to bond all of the sand grains.
Fig. 14: Maximum recoater speed for the corresponding minimum recoater blade gap(Xrb) to achieve optimum packing of sand during the printing process, calculated based on the free fall time of the sand particles (of size 140, 190 and 250 µm) and the Xrb. Dg is the diameter of sand
27
grain. Dot-dot lines indicate the modified model as in the Eq.6. The actual measured recoater blade gap, 2.9 mm and the effective blade gap, 1.6, are marked on the x-axis.
6. Discussion
There are only two major companies produce this sand mold printing machines, but both were licensed by MIT to manufacture this type of 3D sand mold printers. The 3D printing machines for furan sand molds have similar manufacturing processes. The dimensions of the job box can be different for various models, but the user can set most of the printing parameter to print a mold with the required properties. Identifying those printing process parameters is crucial and needs to be understood. One of these manufacturers also produce a machine model with inclined recoater even though the company, Voxeljet, produced only one type of machine model; most of the models follow the usual vertical design. Therefore, the current result could be used to identify a set of process parameters for any machine model with a horizontal job-box configuration. The current 3D sand mold printing system is based on a layer by layer manufacturing approach (one layer of furan droplets is printed onapproximately two layers of sand particles), rather than particle by particle. Fig. 12 shows a schematic of the printing process. At a slower speed, close to 0.130-0.208 m.s-1 (10-16 %§§§§), the dropped sand particles were uniformly spread by the recoater, and the furan deposition was droplet by droplet with the resolution set for each printing (in the XY plane and was ≤ average sand particle size) hence uniformly bonding them to produce specimens with high homogeneous strength throughout the job box coordinates. This was due to the rate of supply of sand particles by the recoater and the time spent by the recoater for a particular recoating iteration being enough to fill the space in the job-box when it had been lowered by 280 µm during each sand recoating process. At a higher recoater speed, > 0.208 m.s-1, due to the lack of time spent by the recoater for a particular iteration, the sand packing was not optimum or consistent with the job box coordinates. Even though the sand flow rate through the recoater blade gap was constant, there was a huge variation of properties of the 3D printed specimens at a different coordinate in the job box. This why the 3PB strength was not same with specimen printined high recoater speed at different coordinate. It is also important to understand the measurement of 3PB strength may vary depend
28
on the packing of sand particle in the mid region of the speciment where crack occurs during testing; due to missing connectivity of both sand particles and the furan resin.
The voltage applied to the printhead determines the volume of each furan droplet, and this was set to be constant at 78V, and therefore, the distribution of furan is uniform on each specimen, even though, the sand particle distribution varied with the speed of the recoater and hence the density of packing. The strength of this resin bonded particulate composite can be primarily determined by the weakest media which is the polymer chain. However, due to the speed of packing, any sand particle missed at any coordinate of the job box can be considered as a large pore which can cause high-local stress intensity, when a stress is applied, and consequently, show weaker strength than a well-packed specimen. In this case, a higher resolution of the printing parameter can then only alter the permeability rather than strength. The 2D X-ray image, Fig. 3(b), clearly showing the missing sand particles, due to the high speed of the recoater hence the supply of particles was not sufficient to fill the space correctly, at different job box coordinates. This may be due to the variation in the feed rate of a sand particle along the recoater blade length, with time, as the distance between the blades or the actual Xeff value may have been different due to the cohesiveness of the acid wetted sand particles themselves or with the recoater wall.
SEM images give 2D information, and therefore it is suggested that a 3D reconstruction of X-ray tomography images, e.g. a single slice of such images are shown in Fig. 3(b), of the sand mold, may be a better characterization method to further understand and compare the effect of packing mechanism at different recoater speed on the properties of sand molds. 3D reconstruction of the 3D printed sand mold with simulation for permeability will be incorporated in the follow-up study to understand the effect of low (≤ 0.208 m.s-1, is a function of the recoater blade gap and sand particle size) and high (>0.208 m.s-1) speeds of the recoater during the printing process.
Moisture content and void ratio primarily affect the strength of the compacted sand. Water is produced during the polymerization of furfuryl alcohol monomers (sprayed by the print-head on demand), in the presence of sulfonic acid catalyst (premixed with the sand particles before spreading by the recoater), and the amount of water vaporized during printing may be reduced with the speed of printing due to the time duration until the next layer to be coated, and this may also cause a reduction in strength.
29
Fig. 11 shows that the maximum density achieved on the 3DP specimen is around 1423 kg.m-3 which is very close to the theoretical packing density of spherical sand particles packed in a simple cubic manner with a maximum combustible substance in it. However, the SEM micrographs, Fig. 3(a) and Figs.8-9, show many missing particles due to the less ideal recoating process, especially evident during the recoater speed of 0.286 m.s-1 or due to the lower sphericity of the sand particles. Hence, an x-ray tomography study to analyze the three-dimensional structure of the sand particle arrangement in the 3D printed specimen is required and will be published at a later time. X-ray tomography images can be reconstructed to separate the void region within the 3D printed sand and hence understand the quality of packing of the sand particles as a function of the recoater speed. This will also be the subject of a future study.
7. Conclusions
At low recoater speed, 0.130-0.182 m.s-1 sand particles are well packed or well distributed by the recoater into the job box, regardless of its coordinates. A higher printing resolution, in this case, mainly reduces the permeability of the printed part rather than affecting its strength, if the distance between neighbouring furan droplet in x-drection (x-resolution) is greater than the average size of the sand particles.
At high recoater speeds (>0.182 m.s-1, depending on the Xeff), the number of sand particles per unit volume in the printed specimens are relatively lowered by packing them with large amount of vacancies as evidenced by the lower density values. This can be clearly seen in the X-ray tomographic images. Therefore the properties of the sand mold printed at different job-box coordinates are also affected and hence it can be concluded as better printing resolution contributes to the strength, in this case, by well connecting all of the sand particles and the void region.
A safe limit of the recoater speed can be calculated from the minimum gap between the recoater blades, and the sand layer thickness/average sand particle size by considering the free-fall time of the sand particles. It is important that the maximum particle size should be close to the mean value, and the sand layer thickness must be twice this value, to identify this safe limit.
Traditional three-point bending tests can only measure the strength within the particular region, and hence, another suitable technique should be identified to further characterize
30
and to understand the compaction mechanism of the sand particles; possibly a reconstructed 3D model from 2D X-ray tomography images.
It appears that a simple cubic packing arrangement of sand grains (centres of gravity) occurs when a sand mold specimen is 3D printed, by considering the density of the printed specimens. Hence, a maximum void region of 46% may contribute to better permeability of the sand mold. A further 3D X-ray tomography study should be undertaken to confirm this mechanism.
8. Acknowledgement
The assistance during 3D printing of sand specimens by Mr. Jérémie Bourgeois and the financial support provided by the rapid casting platform, at the MSMP laboratory, of the Low-Cast project is greatly acknowledged. The authors acknowledge the assistance by Dr. Mark N Mavrogordato, µ-VIS CT Imaging Centre, The University of Southampton, the United Kingdom for the X-ray tomography. The authors also acknowledge the feedback given by Dr John Andrew Taylor (The University of Queensland, Australia) on the final draft. The first authour carried out the experiemts and written the manuscript during his time at the MSMP laboratory and only the revised manuscript was written during his time at the University of Queensland.
9. Abbreviations
Rs - Recoater speed
g - Gravitational acceleration
Dg - average diameter of the sand grain
3DP - three-dimensional printing
3PB - three point bending
31
10. References
[1] Upadhyay M, Sivarupan T, El Mansori M. 3D printing for rapid sand casting: A review. vol. 29. 2017. doi:10.1016/j.jmapro.2017.07.017.
[2] ExOne. ExOne S-print 3D sand mold printer. ExOne 2015. https://www.exone.com/Systems/Prototyping-Printers/S-Print.
[3] Almaghariz ESES, Conner BPBP, Lenner L, Gullapalli R, Manogharan GPGP, Lamoncha B, et al. Quantifying the role of part design complexity in using 3d sand printing for molds and cores. Int J Met 2016;10:240–52. doi:10.1007/s40962-016-0027-5.
[4] Conner BP, Manogharan GP, Martof AN, Rodomsky LM, Rodomsky CM, Jordan DC, et al. Making sense of 3-D printing: Creating a map of additive manufacturing products and services. Addit Manuf 2014;1:64–76. doi:10.1016/j.addma.2014.08.005.
[5] Sama SR, Badamo T, Lynch P, Manogharan G. Novel sprue designs in metal casting via 3D sand-printing. Addit Manuf 2019. doi:10.1016/j.addma.2018.12.009.
[6] Snelling D, Li Q, Meisel N, Williams CB, Batra RC, Druschitz AP. Lightweight metal cellular structures fabricated via 3D printing of sand cast molds. Adv Eng Mater 2015;17:923–32. doi:10.1002/adem.201400524.
[7] Snelling D, Williams CB, Druschitz AP. A Comparison of Binder Burnout and Mechanical Characteristics of Printed and Chemically Bonded Sand Molds. SFF Symp 2014:197–209.
[8] Ramakrishnan R, Griebel B, Volk W, Günther D, Günther J, Günther D, et al. 3D printing of inorganic sand moulds for casting applications. Adv Mater Res 2014;1018:441–9. doi:10.4028/www.scientific.net/AMR.1018.441.
[9] Sivarupan T, Upadhyay M, Ali Y, El Mansori M, Dargusch MS. Reduced consumption of materials and hazardous chemicals for energy efficient production of metal parts through 3D printing of sand molds. J Clean Prod 2019;224:411–20. doi:10.1016/j.jclepro.2019.03.158.
[10] Deng C, Kang J, Shangguan H, Hu Y, Huang T, Liu Z. Effects of hollow structures in sand mold manufactured using 3D printing technology. J Mater Process Technol 2018. doi:10.1016/j.jmatprotec.2017.12.031.
[11] Shangguan H, Kang J, Deng C, Hu Y, Huang T. 3D-printed shell-truss sand mold for aluminum castings. J Mater Process Technol 2017;250:247–53. doi:10.1016/j.jmatprotec.2017.05.010.
[12] Frazier WE. Metal Additive Manufacturing: A Review. J Mater Eng Perform 2014;23:1917–28. doi:10.1007/s11665-014-0958-z.
[13] Khandelwal H, Ravi B. Effect of Binder Composition on the Shrinkage of Chemically Bonded Sand Cores. Mater Manuf Process 2015;30:1465–70. doi:10.1080/10426914.2014.994779.
32
[14] Nastac L, Jia S, Nastac MN, Wood R. Numerical modeling of the gas evolution in furan binder-silica sand mold castings. Int J Cast Met Res 2016;29:194–201. doi:10.1080/13640461.2015.1125983.
[15] Tiedje N, Crepaz R, Eggert T, Bey N. Emission of organic compounds from mould and core binders used for casting iron, aluminium and bronze in sand moulds. J Environ Sci Health A Tox Hazard Subst Environ Eng 2010;45:1866–76. doi:10.1080/10934529.2010.520595.
[16] Mitra S, Rodríguez de Castro A, El Mansori M. On the rapid manufacturing process of functional 3D printed sand molds. J Manuf Process 2019. doi:10.1016/j.jmapro.2019.04.034.
[17] Mitra S, Rodríguez de Castro A, El Mansori M. The effect of ageing process on three-point bending strength and permeability of 3D printed sand molds. Int J Adv Manuf Technol 2018:1–11. doi:10.1007/s00170-018-2024-8.
[18] Mitra S, El Mansori M, Costin M, Rodríguez de Castro A. On quality assessment of 3D printed sand mold using non-destructive X-ray µ-CT. Int. Symp. Digit. Ind. Radiol. Comput. Tomogr. – DIR2019, 2019.
[19] Sivarupan T, Elmansori M, Daly K, Mavrogordato MN, Pierron F. Characterisation of 3D printed sand moulds using micro-focus X-ray computed tomography. Rapid Prototyp J 2018:https://doi.org/10.1108/RPJ-04-2018-0091.
[20] T??th J, Svidr?? JT, Di??szegi A, Stevenson D. Heat absorption capacity and binder degradation characteristics of 3D printed cores investigated by inverse fourier thermal analysis. Int J Met 2016;10:276–88. doi:10.1007/s40962-016-0043-5.
[21] Renhe H, Hongmei G, Yaoji T, Qingyun L. Curing mechanism of furan resin modified with different agents and their thermal strength. China Foundry 2011;8:161–5.
[22] Chhabra M, Singh R. Obtaining desired surface roughness of castings produced using ZCast direct metal casting process through Taguchi's experimental approach. Rapid Prototyp J 2012;18:458–71. doi:10.1108/13552541211272009.
[23] Gill SS, Kaplas M. Efficacy of powder-based three-dimensional printing (3DP) technologies for rapid casting of light alloys. Int J Adv Manuf Technol 2011;52:53–64.
[24] Gill SS, Kaplas M. Comparative Study of 3D Printing Technologies for Rapid Casting of Aluminium Alloy. Mater Manuf Process 2009;24:1405–11. doi:10.1080/10426910902997571.
[25] Bassoli E, Gatto A, Iuliano L, Violante MG. 3D printing technique applied to rapid casting. Rapid Prototyp J 2007;13:148–55. doi:10.1108/13552540710750898.
[26] Hodder KJ, Chalaturnyk RJ. Bridging additive manufacturing and sand casting: Utilizing foundry sand. Addit Manuf 2019. doi:10.1016/j.addma.2019.06.008.
[27] Hussein NIS, Ayof MN, Sokri NIM, Engineering M. Mechanical Properties and Loss on Ignition of Phenolic and Furan Resin Bonded Sand Casting 2013;1:1–5.
[28] Stauder BJ, Kerber H, Schumacher P. Foundry sand core property assessment by 3-point bending test evaluation. J Mater Process Technol 2016;237:188–96.
33 doi:10.1016/j.jmatprotec.2016.06.010.
[29] Stevenson D. 3D Sand Printing – Cores & Moulds for the Foundry Industry Agenda 2015.