Science Arts & Métiers (SAM)
is an open access repository that collects the work of Arts et Métiers Institute of
Technology researchers and makes it freely available over the web where possible.
This is an author-deposited version published in: https://sam.ensam.eu Handle ID: .http://hdl.handle.net/10985/13418
To cite this version :
Daming ZHOU, Thu NGUYEN, Elena BREAZ, Dongdong ZHAO, Stéphane CLENET, Fei GAO -Global Parameters Sensitivity Analysis and Development of a Two-Dimensional Real-Time Model of Proton-Exchange-Membrane Fuel Cells - Energy Conversion and Management n°162, p.276-292 - 2018
Any correspondence concerning this service should be sent to the repository Administrator : archiveouverte@ensam.eu
Global Parameters Sensitivity Analysis and Development
of a Two-Dimensional Real-Time Model of
Proton-Exchange-Membrane Fuel Cells
Daming Zhou
a,b,*,
Thu Trang Nguyen
c,
Elena Breaz
a,b,e, Dongdong Zhao
f,
Stéphane Clénet
d, Fei Gao
a,ba FEMTO-ST (UMR CNRS 6174), Energy Department, Univ. Bourgogne Franche-Comte, UTBM Rue Thierry Mieg, F-90010 Belfort Cedex, France.
b FCLAB (FR CNRS 3539), Univ. Bourgogne Franche-Comte, UTBM, Rue Thierry Mieg, F-90010 Belfort Cedex, France
c Univ. Lille, Centrale Lille, Arts et Metiers ParisTech, HEI, EA 2697, L2EP – Laboratoire, d’Electrotechnique et d’Electronique de Puissance, F-59000 Lille, France
d Univ. Lille, Centrale Lille, Arts et Metiers ParisTech, HEI, HeSam, EA 2697, L2EP – Laboratoire, d’Electrotechnique et d’Electronique de Puissance, F-59000 Lille, France
e Department of Electrical Engineering, Technical University of Cluj-Napoca, Cluj-Napoca 400367, Romania
f School of Automation, Northwestern Polytechnical University, China
Abstract
This paper presents a 2-D real-time modeling approach for a proton-exchange-membrane fuel cell (PEMFC). The proposed model covers multi-physical domains for both fluidic and electrochemical features, which considers in particular the flow field geometric form of fuel cell. The characteristics of reactant gas convection in the serpentine gas pipeline and diffusion phenomenon through the gas diffusion layer (GDL) are thoroughly considered in fluidic domain model. In addition, a three levels iterative solver is developed in order to accurately calculate the implicit spatial physical quantities distribution in electrochemical domain. Moreover, the proposed 2-D real-time modeling approach uses a numerical method to achieve a fast execution time, and can thus be further easily applied to any real-time control implementation or online diagnostic system. After experimental validation under different fuel cell operating conditions, an iterative Least Angle Regression (LAR) method is used to efficiently and accurately perform the global parameters sensitivity analysis based on Sobol definition. The online analysis results give an insight into the influences of modeling parameters on fuel cell performance. The effect of interactions between parameters’ sensitivities is especially investigated, which can provide useful information for degradation understanding, parameters tuning, re-calibration of the parameters and online prognostic.
Keywords: Proton exchange membrane fuel cell, flow field geometric form, global parameters
sensitivity, effect of interactions. * Corresponding author
E-mail addresses:
daming.zhou@utbm.fr (Daming Zhou), thu-trang.nguyen@univ-lille1.fr (Thu Trang Nguyen), elena.breaz@utbm.fr (Elena Breaz), zhaodong@nwpu.edu.cn (Dongdong Zhao),
1. Introduction
During the last few decades, electric vehicles (EVs), and most recently hybrid electric vehicles powered by fuel cells (FCHEVs) have a fast growing interest due to environment pollution and energy crisis. Different from conventional energy device for example thermal machine, fuel cells have been commonly considered as a more suitable energy conversion device for long-range EVs, due to their advantages of compactness, fast fueling time and high conversion efficiency [1]-[3]. As one type of fuel cell technologies, proton-exchange-membrane fuel cell (PEMFC) has all the above mentioned advantages. In addition, compared to other fuel cell types, PEMFC can provide higher power density for transport and portable applications with relatively lower operation temperature and pressure [4] [5].
Nevertheless, before its mass commercialization, there is still much research to be done. One of the major challenges of PEMFC is the design of appropriate control strategies and auxiliaries to achieve its optimal working modes (cooling circuit, humidifier, air compressor, power converters, etc.) [6]. On the other hand, the fuel cell lifespan should be increased in order to meet the requirements of transportation applications. In addition, as a complicate energy conversion device, fuel cell directly converts electrochemical energy into electricity; it has different inter-coupled nonlinear behaviors in multiple physical domains. In practice, it is very difficult to observe the internal variables and state of fuel cell during its operation. A good understanding of how these parameters impact the fuel cell performance would be very useful for fuel cell system design and control development. Therefore, an accurate multi-physical PEMFC model could greatly help the system control strategy development and the parameters sensitivity analysis. Compared with 1-D models [7]-[9], a 2-D PEMFC model has the capability to provide two-dimensional behavior, which is very useful for spatial non-uniformity and control coupling analysis. This analysis can give detailed and valuable spatial physical quantities information under different fuel cell operating conditions by taking multiple spatial dimensions into consideration.
Many control-oriented PEMFC 2-D models have been previously proposed in the literature [10]-[17]. However, a common drawback of these works is that the presented fuel cell bipolar plate flow field (gas channels) models are over-simplified (or not even considered). Thus they cannot describe accurately the non-linear and non-uniform pressure distribution characteristics. For example, the gas pressure prediction results of a model without the consideration of channel geometric form, could lead to an inaccurate gas diffusion phenomenon in the serpentine pipeline, which would further impact the
accuracy of electrode current density analysis. In these models, the gas supply channel is assumed to be straight and single. In fact, the gas supply pipeline at the anode and cathode sides may have different geometric patterns. For example, the flow field form of Ballard NEXA 1.2kW fuel cell stack used in this paper includes a single serpentine pipeline in anode side and a parallel serpentine pipeline in cathode side. Therefore, a comprehensive representation of non-homogeneous gas phenomenon by fully taking the geometric form of the fuel cell pipeline into consideration is particularly useful to achieve more confident and reliable spatial distribution information for 2-D model of PEMFC. On the other hand, for the purpose of real-time control implementation and online prognostic, the computational efficiency of a control-oriented PEMFC fuel cell model is crucial for model based control process. The commonly used Computational Fluid Dynamics (CFD) modeling of fuel cell [16] [17], who uses complex partial differential equations to describe the gas flow in the flow field, are however not suitable for real-time model-based controller and online diagnostic system since the computational burdens are too heavy.
Under calculation efficiency premise, an accurate mathematical PEMFC model generally incorporates both semi-empirical and physical parameters in different physical domains. However, many semi-empirical parameters, such as electrode charge transfer coefficient or electrode porosity, are very difficult or even impossible to be theoretically determined. On the other hand, the physical parameters in membrane electrode assembly (MEA) (for example the thickness of GDL) are very difficult to determine by measurement due to the thickness in micrometer range. Moreover, it should also be noted that, all the parameters values may change during the fuel cell degradation, as well as their sensitivities. Therefore, as an important step during the fuel cell model development, performing a parameter sensitivity study can provide us useful information for parameters tuning, modeling assumptions and aging parameters recalibration. In the literature, Corrêa et al. [18] investigated the effects of ten parameters on the fuel cell performance, using multi-parametric sensitivity analysis (MPSA). Dalasm et al. [19] presented the fuel cell cathode catalyst layer parameters sensitivities study based on a mathematical model in a steady-state condition. The proposed model covers different physical domains. Zhou et al. [20] presented a parameters sensitivity study based on a lithium-ion battery model using MPSA method. However, most of these analyses are based on 1-D models, and their sensitivity analyses are investigated only on a single parameter.
In addition, these sensitivity analyses only evaluate the effect of a single parameter on the model performance. The main drawback of this local sensitivity analysis is that the evaluation of simultaneous effects of all parameters on the model is ignored. In reality, the fuel cell is an inter-coupled nonlinear multi-physical system, lots of model parameter variables are coupled, and the variation of one parameter may influence the others. Therefore, in addition to the single parameter sensitivity, the interactions between parameters have to be evaluated using a more systematic and comprehensive analysis method.
The global sensitivity analysis method is a satisfactory solution for this problem [21] [22]. In the global sensitivity analysis method, all the model parameters are varied simultaneously over a certain parameter range. By using this method, not only the local influence of each individual parameter, but also the interactions between different parameters on the fuel cell model performance can be effectively measured. However, such global parameters sensitivity study for fuel cell applications has not been reported so far in the literature.
A 2-D multi-physical real-time model of PEMFC is fully developed in this paper. The major contributions of this paper can be summarized as follows:
1) A novel non-uniform control volume mesh grid is defined in fluidic domain model based on channel geometric form, in order to thoroughly describe the under-rib convection between neighboring channels by fully considering the flow field geometric patterns of fuel cell;
2) An iterative solver has been developed to solve the implicit spatial physical quantities distribution in electrochemical domain. This original iterative solver algorithm is composed by three interactive computational loops and uses a robust convergence method for real-time computation;
3) An iterative Least Angle Regression (LAR) method is used to efficiently and accurately perform the global parameters sensitivity study based on Sobol definition. The analysis results provide an insight into the influence of each individual parameter on the fuel cell performance, and further analyze the significance of the interactions between each parameter of fuel cell in real-time. Such online analysis allows model-based controller or diagnostic system to take fast decisions and actions.
The paper is organized as follows: a 2-D PEMFC model, which covers two multi-physical domains: fluidic and electrochemical, is proposed in Section II. Section III gives the model implementation and
experimental validation. Section IV uses an iterative least angle regression method to provide online global parameters sensitivity analysis results. Section V presents final conclusions and future works.
2. Multi-physic 2-D PEM Fuel Cell Model
In this section, a full 2-D, multi-physical PEMFC model is presented. Different from the previously developed PEMFC models [23]-[25], the proposed model fully considers two-dimensional convection and diffusion phenomenon in fluidic domain, and spatial physical quantities in electrochemical domain. Moreover, the proposed model is oriented to the real-time calculation, in order to effectively perform the global parameters sensitivity analysis.
Fig. 1. Schematic diagram of a single cell in PEMFC stack.
Fig. 1 shows the basis of individual layers in a single cell of the proposed fuel cell stack. From Fig. 1, a single cell model consists of 7 individual layers: (1) cathode gas supply channel; (2) cathode gas diffusion layer (GDL); (3) cathode catalyst layer; (4) membrane; (5) anode catalyst layer; (6) anode gas diffusion layer (GDL); (7) anode gas supply channel. Moreover, the fuel cell operation temperature is considered as an input in each individual layer.
2.1. Electrochemical Domain Model
The total output voltage of a single-cell can be calculated by the following equation:
where is the single fuel cell thermodynamic voltage (V), is the Ohmic voltage drop (V), is voltage drop due to activation (V).
The following Nernst equation is used to calculate thermodynamic voltage [26]:
where is the catalyst layer temperature (K), is the Faraday constant (C/mol),
catalyst layer, is the hydrogen pressure (Pa) at the interface of anode catalyst layer (please refer
to the last paragraph of this section).
The cell Ohmic voltage drop (V) is calculated by [23]:
where is the section surface of membrane (m2), is the membrane thickness (m). is the
resistivity of membrane (Ω m) which can be calculated by the following equation [26]:
The electrochemical activation voltage drop of single cell can be calculated by Butler-Volmer
equation:
where is the stack current (A), is the charge transfer coefficient, is the electrons number. The exchange current density (A/m2) can be calculated by an empirical equation [27]:
where and are empirical parameters, is the oxygen activation energy on the electrode catalyst interface (J/mol). It should be noted that, the at anode side for fuel cells of PEMFC type can be
reasonably neglected, since the cathode activation voltage drop is significantly larger than the anode activation voltage drop [28].
It should also be noted that, since the and used in Eq. (2) are reactant gas pressures
at the catalyst layer interface instead of the gas supply channels, another fuel cell over-potential term due to pressures drop through the GDL, well known as “concentration losses”, has been implicitly considered in the fluidic model.
2.2. Fluidic Domain Model
To accurately model the reactant gas pressure distribution on the electrodes surface, a comprehensive model of gas convection-diffusion phenomenon in the gas supply channel and GDL is presented hereafter by precisely considering the fuel cell gas channel geometric form in this section.
Different from straight and single gas channels assumption in many PEMFC models from literature [7]-[15], the proposed 2-D model fully considers the geometric form of flow field both at the cathode and anode sides (i.e. the non-homogeneous gas convection phenomenon in the curved U-bends of parallel serpentine pipeline). Under the same fuel cell operating conditions, the gas channel geometric form greatly influences the gas transportation in the GDL. Therefore, a detailed fluidic model of non-linear and non-uniform gas diffusion phenomenon by considering precisely the channels geometric form is important to achieve highly accurate spatial results.
Fig. 2. The serpentine pattern pipelines of Ballard NEXA 1.2kW fuel cell stack.
As shown in Fig. 2, the overall geometric form of flow field considered in the proposed 2-D model is taken from a Ballard NEXA 1.2kW fuel cell stack. This symmetric geometry design consists of a three-parallel serpentine pattern pipeline at each half-plan on cathode side, and a single parallel serpentine pattern pipeline at each half-plan on anode side.
In the serpentine channels, the Darcy–Weisbach equation is used to calculate the gas pressure difference between the channel inlet and outlet due to the mechanical losses suffered in straight channel:
where is the flow density (kg/m3), is the total length of straight pipeline, is the mean gas
velocity, is the Reynolds number, is the hydraulic diameter of channel. More detailed
content about pressure drop due to the friction in the U-bends section can be found in [29] [30].
2) Gas Diffusion Layer
The modeling equations for reactant gas diffusion phenomenon in the GDL are described in this section.
Based on the gas supply channel geometry, the GDL, which is directly adjacent to the gas channels layer, can be divided into two sections denoted as “fluid adjacent volume” and “solid adjacent volume”, as illustrated in Fig. 3. From Fig. 3, the thin line GDL control volume is adjacent to the channel fluidic section, denoted as “fluid adjacent volume” of GDL. The gas flows to a “fluid adjacent volume” come from the gas channel pipeline and the adjacent volumes. In contrast, the bold line GDL control volumes in Fig. 3 are adjacent to the channel solid section, denoted as “solid adjacent volume” of GDL. The gas flows to a “solid adjacent volume” come only from the adjacent volumes in gas diffusion layer.
Fig. 3. Gas diffusion phenomenon in gas diffusion layer.
In the previous section, the gas convection phenomenon in the serpentine pipeline has been well developed (Eq. (7) [29] [30]). As shown in Fig. 3, the convective gas flow direction in the gas pipeline is marked by arrow (1) in the gas pipeline A, and by arrow (3) in the gas pipeline B. Then, the gas diffusion phenomenon in the GDL are divided into six categories, as clearly shown in Fig. 3: diffusion from gas pipeline to “fluid adjacent volume” (Z-axis, marked with arrows (2) and (4)); diffusion between two adjacent “fluid adjacent volume” (Y-axis, marked with arrows (5) and (6)); diffusion between adjacent “fluid adjacent volume” and “solid adjacent volume” (X-axis, marked with arrow (7)); diffusion between two adjacent “solid adjacent volume” (Y-axis, marked with arrow (8)); diffusion from “fluid adjacent volume” to catalyst layer (Z-axis, marked with arrows (9) and (10)); diffusion from “solid adjacent volume” to catalyst layer (Z-axis, marked with arrow (11)).
It should be noted that, the diffusion from gas pipeline to “fluid adjacent volume”, and the diffusion from volumes to catalyst layer become more important when the stack current increases. That is because the mass flow from gas channels to the catalyst layer is proportional to the fuel cell current.
All these diffusion phenomenon in the gas diffusion layer, except the above-mentioned current-driven ones, can be modeled by the modified Fick's diffusion equation:
where is gas pressure of specie in the GDL, is GDL thickness (m), is the reactant
gas molar flow rate of specie x (mol/s) (diffusion from GDL to catalyst layer in Fig. 3), is the
temperature of GDL (K), is the area of GDL (m2), the effective binary gas diffusion coefficient
between the species x and y (m2/s)
can be calculated by [7] [26]: where is the total pressure of species i and j (Pa), is the critical temperature (K), is the
critical pressure (Pa), is the molar mass of species (kg/mol), is the GDL porosity and is the GDL tortuosity. Coefficients and can be determined based on the gas types [26].
3) Catalyst Layers
As mentioned before, the reactant gas mass flow rate through the GDL to the catalyst layer is directly proportional to the PEMFC stack current. Thus, the oxygen mass flow (kg/s) at the cathode side can be expressed by:
the hydrogen mass flow (kg/s) at the anode side can be expressed by:
and the mass flow of produced water (kg/s) at the cathode side due to the electrochemical reaction can be calculated by:
4) Membrane Water Content
In the proposed 2-D PEMFC model, two water diffusion phenomena are considered in the proton exchange membrane layer:
a) the water mass flow (kg/mol) from the anode to the cathode due to the electro-osmotic drag
where the electro-osmotic drag coefficient ;
b) water mass flow (kg/mol) from the cathode to the anode due to the water back diffusion
phenomenon:
where the diffusion coefficient of water in membrane (m2/s) can be obtained from [26]. The
water content at cathode is calculated based on a function of the water activity [26]. Then, the net
water mass flow (kg/mol) in the membrane can be described using the following equation:
The membrane water content is defined as the relationship of the number of water molecules per charged site (sulphonate site) [26]:
where is the water activity factor, which can be obtained based on the local vapor partial pressure
(Pa):
where the local vapor saturation pressure (Pa) is calculated by:
3. Model Implementation and Experimental Validation 3.1. Control Volume Mesh Grid Definition
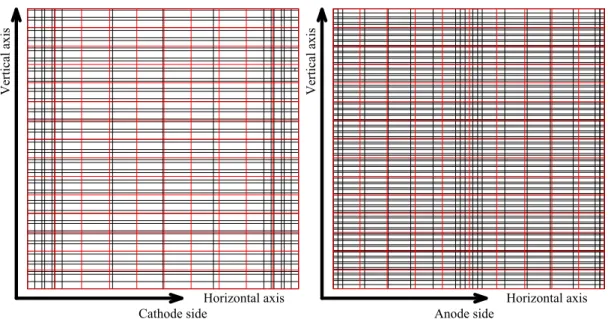
In the previous subsections, the control volume mesh grid definition of gas channels and GDLs, in the proposed 2-D PEMFC model, is considered in a non-uniform manner. It means that, the geometry form of each control volume follows the channel geometric patterns. The 2-D model of serpentine channels can be then properly implemented by defined control volume with the physical equations of fluidic domain model presented in the Section II. Fig. 4 depicts the control volume 2-D mesh grid at both sides, the black mesh denotes the geometric forms of both cathode three-parallel serpentine pipeline and anode single-parallel serpentine pipeline.
Horizontal axis V er ti ca l a xi s Horizontal axis V er ti ca l a xi s
Cathode side Anode side
Fig. 4. Control volume 2-D mesh grid at cathode/anode sides, and uniform segments.
In addition to the fluidic domain model, the spatial physical quantities distribution in electrochemical domain (e.g. the current density distribution) cannot be directly obtained using the non-uniform mesh grid. In order to unify the mesh segments distribution in homogenous material such as electrode and electrolyte, the non-uniform mesh grid of gas channels layer of each side is then linearly converted to uniform mesh grid for catalyst and membrane layers denoted by the red mesh in Fig. 4.
3.2. Control Volume Mesh Grid Definition
In the proposed 2-D real-time PEMFC model, the fluidic domain model is developed based on the non-uniform control volume (black mesh in Fig. 4), while the calculations of electrode/electrolyte related physical quantities in electrochemical domain are based on the unified control volume (the red mesh in Fig. 4).
It should be noted that, since the activation voltage drop appears in an implicit form in the
Butler-Volmer Eq. (5), an iterative solving method should be developed to calculate . In addition,
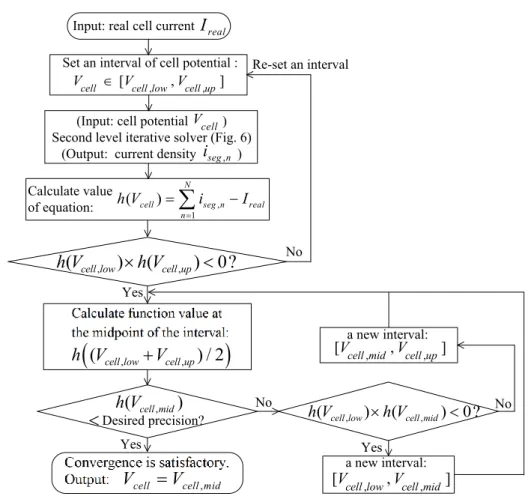
this iterative algorithm should also solve the current of each segment (current density distribution) and cell potential (fuel cell output voltage), which cannot also be calculated explicitly a priori. A detailed schematic diagram of the proposed three levels iterative solver is presented in the following Fig. 5- Fig. 7.
Yes
(
cell low, cell up,) / 2
h V
V
Desired precision?,(
cell mid)
h V
No Yes No Yes , ,(
cell low)
(
cell up) 0?
h V
h V
, ,
[
V
cell low,
V
cell mid]
a new interval: Calculate value of equation: No , , [ , ]
cell cell low cell up
V V V
, 1
( cell) N seg n real
n
h V i I
Input: real cell current
I
real, ,
(
cell low)
(
cell mid) 0?
h V
h V
Re-set an interval a new interval: cell V , seg ni
Set an interval of cell potential :
(Input: cell potential ) Second level iterative solver (Fig. 6)
(Output: current density )
, cell cell mid
V
V
, ,
[Vcell mid,Vcell up]
Fig. 5. Schematic diagram of the proposed iterative solver (the first level).
As shown in Fig. 5- Fig. 7, the proposed solver consists of three levels bisection algorithm. The first level solver is the top level algorithm, which is used to compute cell potential (fuel cell output
voltage), as shown in Fig. 5. In order to resolve current value of each segment (current density)
based on the output of first level solver, a second level solver is included in the algorithm, as shown in Fig. 6. Fig. 7 depicts the third level iterative solver, which is used to calculate activation losses in
, [ , , , ]
seg n seg low seg up
i i i
Calculate water flow of back diffusion based on Eq. (14) Calculate water flow
of electro-osmotic drag based on Eq. (13)
Re-set an interval
,
cell n
E
V
Ohmic n,Yes
(
seg n low, , seg n up, ,) / 2
g i
i
g i
(
seg n mid, ,)
No, , ,
seg n seg n mid
i
i
No
Yes
, , , ,
(
seg n low)
(
seg n up) 0?
g i
g i
, , , ,
[iseg n low,iseg n mid]
, , , ,
(seg n low) (seg n mid) 0?
g i g i
, , , ,
[iseg n mida new interval:,iseg n up]
a new interval: No Calculate equation:
g i
(
seg n,)
E
cell n,
V
Ohmic n,
V
act n,
V
cellInput: cell potential Vcell
Calculate total water mass flow through the membrane based on Eq. (15) Calculate local vapor
saturation pressure: Based on Eq. (18)
Calculate local water content based on Eq. (16) Calculate resistivity of the membrane based on Eq. (4) , ch n
P
Calculate gas pressure drop along the direction ( for each segment) of the air flow in the three-parallel serpentine channel at cathode side and the single-parallel serpentine channel at
anode side based on Eq. (7)
, seg n
i
, act n VOutput: Ohmic loss of each control volumes
Calculate O2 mass
flow through GDL based on Eq. (10)
Yes Calculate thermodynamic voltage
based on Eq. (2) Desired precision? Calculate H2 mass flow through GDL based on Eq. (11) Calculate H2O mass flow through GDL based on Eq. (11) Calculate water activity factor based on Eq. (17) Calculate cell Ohmic voltage drop
based on Eq. (3) Set an interval of current value of each control volumes:
Output: thermodynamic voltage of each control volumes
(Input: current value of each control volumes ) Third level iterative solver (Fig. 7)
(Output: activation loss of control volumes )
Fig. 6. Schematic diagram of the proposed iterative solver (the second level).
By knowing the total current value of fuel cell, and setting appropriate numerical ranges for activation voltage drop of segments , current value of segments , and cell potential , the
cell voltage and individual current in each control volume can be properly calculated by the proposed iterative algorithm.
It is worth to mention that, the proposed 2-D modeling approach is original for real-time PEMFC simulation model and completely independent of commercial platforms. It can be easily implemented to any real-time controller or online diagnostic system.
Yes
Desired precision? No Yes No Yes a new interval: NoInput: current value of each control volumes
Re-set an interval
a new interval: Set an interval of activation loss:
,
seg n
i
, ,
[ , ]
act act low act up
V V V (1 ) ( ) ( ) , ,
(
)
[
]
c c act act cata cata nFV nFV RT RTact seg es n exc
f V
i
i
e
e
Calculate value of equation:
, ,
(
act low)
(
act up) 0?
f V
f V
(
act low, act up,) / 2
f V
V
,
(
act mid)
f V
,
act act mid
V
V
[
v
act low,,
v
act mid,]
, ,
(
act low)
(
act mid) 0?
f V
f V
, ,
[
v
act mid,
v
act up]
Fig. 7. Schematic diagram of the proposed iterative solver (the third level).
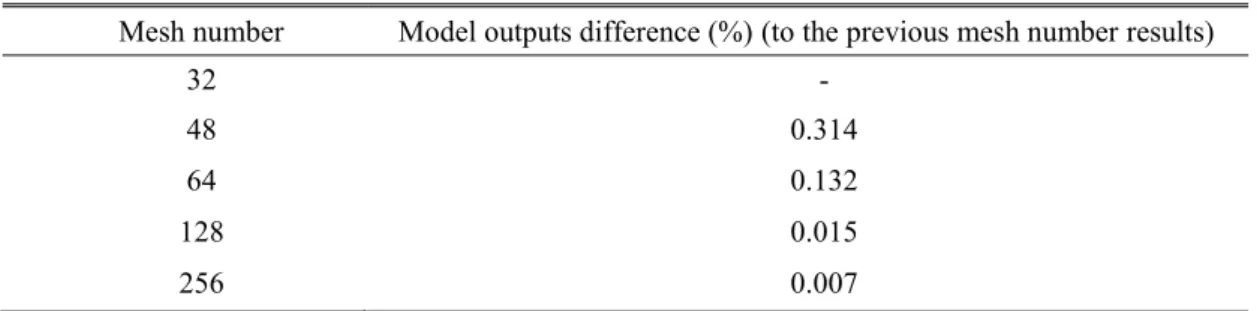
3.3. Mesh Grid Independence Analysis
The mesh grid independence analysis can determine the required minimum mesh grid number for multi-dimensional simulation accuracy. When the mesh number increases, if the changes of model output are less than a pre-defined acceptable error, this mesh number can be considered to meet the independence criteria.
Table 1. Mesh Grid Independence Check for 2-D Model Outputs
Mesh number Model outputs difference (%) (to the previous mesh number results)
32 -
48 0.314
64 0.132
128 0.015
256 0.007
It can be concluded from the Table 1 that, when the mesh number is larger than 256, the model output difference is less than 0.01%, thus it can be consider that the model output is no longer affected
by the increase of mesh number. In order to give an accurate distribution results, the mesh number 600 is chosen for the proposed 2-D model experimental validation.
3.4. Experimental Setup
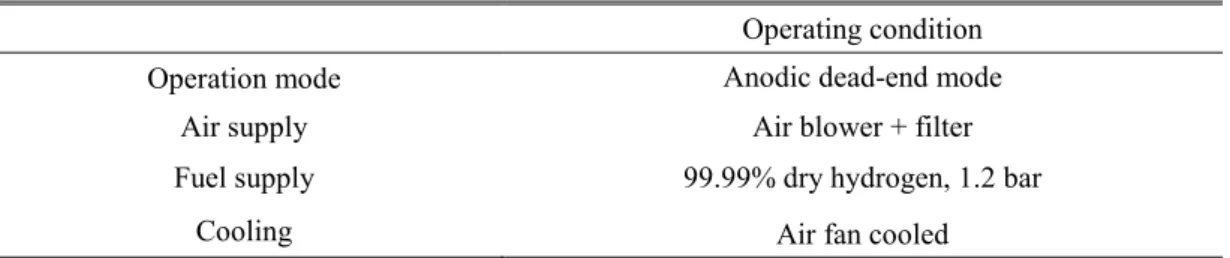
The experimental setup of PEMFC test platform is shown in Fig. 8. In addition, Table 2 lists operating conditions of Ballard NEXA PEMFC stack used in this paper. During the tests, the Ballard control system is used to measure most of the experimental data, such as the oxygen flow rate, gas temperature, fuel cell stack current and voltage, etc. The voltage of individual cell is measured by voltage acquisition module of National Instrument. An embedded thermal sensor is used to measure the fuel cell stack temperature.
Temperature sensor Ballard NEXA 1.2kW PEMFC 47-cells stack National Instrument: cell voltage
acquisition Ballard control system board Fig. 8. PEMFC test platform for experimental validation. Table 2. Operating Conditions of Ballard NEXA Fuel Cell Stack
Operating condition
Operation mode Anodic dead-end mode
Air supply Air blower + filter
Fuel supply 99.99% dry hydrogen, 1.2 bar
Cooling Air fan cooled
3.5. Experimental Validation and Discussions
The comparison of simulation and experimental results of single cell polarization curve is shown in Fig. 9. It can be seen that, the polarization curve obtained from the proposed model shows a high correlation with the real PEMFC.
Fig. 9. Experimental validation of polarization curve.
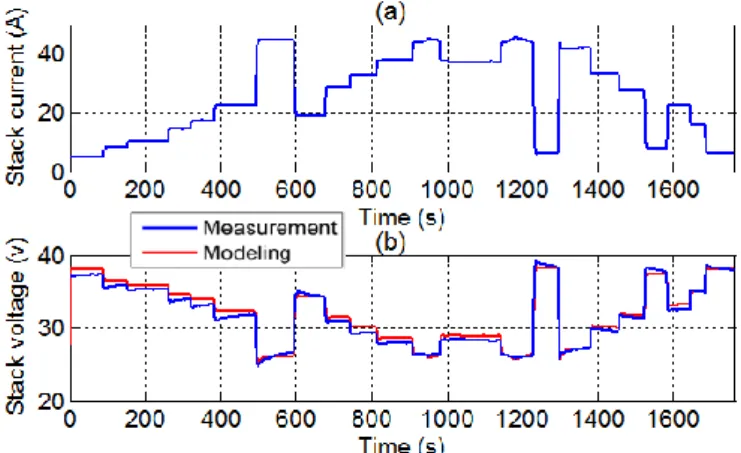
For additional experimental validation for of the proposed model, two types of current profiles (long and short current steps) are both applied to the real Ballard NEXA 1.2 kW PEMFC stack and to the proposed model. Fig. 10 and Fig. 11 show the comparison results of simulated fuel cell stack voltage and experimental voltage. The comparison results show again a well agreement between them.
Fig. 10. Experimental validation: fuel cell stack voltage with long current steps.
Fig. 11. Experimental validation: fuel cell stack voltage with short current steps.
In order to give clear and comprehensive simulation results, the simulated distribution results are illustrated under different oxygen stoichiometry ratio , where and is the
inlet oxygen molar flow rate.
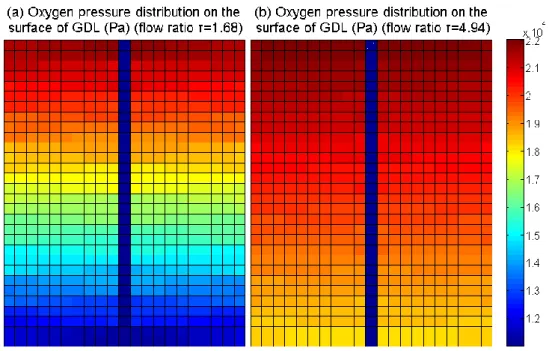
When the fuel cell stack current is equal to 27.5A, the oxygen pressure distribution at the catalyst layer interface (GDL) under different oxygen stoichiometry ratio are shown in Fig. 12. As previously mentioned, by fully considering the flow filed geometric form, the non-uniformity distribution results
can be obtained with certain degree of confidence, as shown in Fig. 12. The oxygen pressure decreases gradually along the direction of the air flow in the three-parallel serpentine channel. That is because the oxygen is consumed progressively along the channels.
Fig. 12. Oxygen pressure distribution under different oxygen stoichiometry .
From Fig. 12 (b), it can be clearly observed that under a higher condition , the oxygen pressure distribution has a less significant variation gradient compared to Fig. 12 (a). That is because the oxygen supply excess is higher, thus the oxygen consumption proportion ratio decreases, and further leads to a more uniform oxygen pressure distribution on GDL surface, as shown in Fig. 12 (b). Under the same conditions, the current density distribution on the electrodes is also shown in Fig. 13.
It can be seen from Fig .13 that, the current density distribution is similar to that of oxygen pressure. The oxygen pressure at catalyst layer is higher at channel inlet than outlet, which leads to a higher current density at air inlet. As shown in Fig. 13 (a), under the condition , the maximum difference of current density is about 45% between channel inlet and outlet. It can be also clearly observed from Fig. 13 (b) that, under a higher condition , the current density distribution has a less significant variation gradient compared to Fig. 13 (a). In this case, the maximum difference of current density is only about 15% between channel inlet and outlet.
3.6. Performance Comparison of Fuel Cell between Horizontal and Vertical Serpentine Channels
From the above discussion, higher current density can be observed on the upper part of electrode than the lower part (shown in Fig. 13), since the oxygen pressure at catalyst layer is higher at channel inlet than outlet (shown in Fig. 12). As mentioned in the introduction, an accurate reproduction of fuel cell channel geometry patterns is particularly useful to achieve more confident and reliable spatial quantities distribution for its 2-D model. In order to clearly show how the channel geometries affect its spatial performance, a performance comparison of fuel cell between horizontal and vertical serpentine channels is presented in this subsection.
The mesh grid definitions of horizontal and vertical serpentine channels used in the same size Ballard NEXA 1.2 kW fuel cell are respectively shown in Fig. 14 and Fig. 15. Their reactant pressure distribution results are shown in Fig. 16 and Fig. 17. When the fuel cell stack current is equal to 27.5A, their current density distribution on electrodes are respectively shown in Fig. 18 (a) and (b).
Outlet Inlet Cathode
Outlet
Inlet Anode
Inlet
Outlet Outlet Outlet Inlet Outlet
Cathode Anode
Fig. 15. Mesh grid definition of vertical serpentine channels used in the Ballard NEXA 1.2 kW fuel cell
Fig. 17. Reactant pressure distribution in the fuel cell vertical serpentine channels.
Fig. 18. Current density distribution on electrodes for different channel geometries.
It can be observed from Fig. 18 (a) that, the current density distribution on the upper part of electrode is higher than the lower part, while in Fig. 18 (b) the current density distribution on the electrode center is higher than both sides. Since the serpentine channel patterns determine the direction of reactant pressure gradient, and further the current density distribution.
From the above observation, it can be concluded that the channel geometric patterns significantly affect the fuel cell spatial physical performance, even though the previous two models with different channel forms could predict almost the same fuel cell output voltage. Thus, it is necessary to precisely reproduce the actual geometric patterns of reactant flow channel during the fuel cell multi-dimensional model development, in order to obtain more confident and reliable spatial distribution results.
4. Online Global Parameters Sensitivity Analysis
The global parameters sensitivity study is particularly important in a nonlinear model development, especially for the complex multivariable fuel cell modeling, which includes many theoretical and empirical parameters from different physical domains. This analysis indicates the least and the most influences of specified parameters, which gives an insight into interactions between the physical quantities inside the model and outputs. In this case, not only the single parameter effect, but also the interactions between the model physical quantities and outputs have to be evaluated. In addition, the calculation efficiency of sensitivity analysis should be considered, in order to allow model-based controller or diagnostic system to take fast decisions and actions.
The importance of online global parameters sensitivity and coupling effects analysis is reflected in the following three aspects:
1) In terms of model-based control strategy development, the PEMFC system can be reasonably considered to be a multiple-input and multiple-output (MIMO) system, which incorporates different inter-coupled parameter variables from different physical domains. Thus, the online analyses of parameters interaction effects are particularly useful for design and optimization of the control strategy for such multivariable system in real-time. For example, based on the coupling analysis results, a decoupling control or a decentralized control could be effectively developed [23];
2) The prognostic and health management is an advanced tool to enhance effective reliability and reduce maintenance cost of the fuel cell system. During the fuel cell degradation, its performance is suffered from multiple irreversible failure mechanisms, which are caused by uncertain circumstances and thus cannot be fully understood [31], such as apparent catalytic activity degradation (leads to variation of current density distribution) or reactants mass transfer degradation (leads to variation of reactants pressure distribution). Thus, such online analysis of parameters interaction effects can provide rich and useful information to understand the degradation mechanism, take fast decisions of diagnostic system, perform appropriate maintenance, and further extend the remaining useful life of fuel cell;
3) Thirdly, there are many parameters inside a fuel cell model from different model equations in different physical domains. Such global parameters sensitivity analysis provides an important tool to understand the complex interaction effects inside the fuel cell, thus helps to further
simplify the fuel cell model by reducing the model complexity of non-significant phenomena on the desired model outputs, or to develop an optimal empirical parameter tuning method; As one of the most robust quantitative approach, Sobol sensitivity analysis [21] gives the sensitivity indices, which provide a quantitative analysis of influence of each single parameter, and interaction effects between different parameters on the model outputs, which variations are supposed to be independent from one another. In order to efficiently and accurately perform the Sobol method in real-time, an iterative Least Angle Regression (LAR) method developed in [22] is used in this paper.
In this section, the Sobol definition is briefly introduced at first, based on which the parameters sensitivity in multiple physical domains is further analyzed.
4.1. Sobol Sensitivity Analysis
Sobol analysis definition, the metrics of the system response variables are determined by the variation of system parameters . This metric function can be decomposed into the sum of functions of individual parameters and their combinations:
Sobol has demonstrated that the decomposition of Eq. (19) is unique under several conditions detailed in [21], thus the total variance can be also expressed as decomposition form:
where is the partial variances of function ,
which corresponds to the subset of parameters . The global sensitivity indices are thus defined as the ratio of the partial variance to the total variance:
where the is the first-order sensitivity index corresponding to the parameter , which measures the effect of on the variability of the model output. Similarly, the is the second-order
sensitivity index, which measures the effects of interactions between two parameters and . The total-order sensitivity index measures the effect of and its interactions with all other parameters. Sobol also presents a useful property that all the previously defined sensitivity indices are non-negative [21]. Based on which the total-order sensitivity index can be calculated efficiently in another form:
where the is the amount of variance from all the parameters except for .
To estimate the Sobol indices, the objective function is decomposed firstly upon a multi-dimensional orthogonal polynomial basis. The coefficients of this projection are calculated by using a modified Least Angle Regression method, thus the Sobol indices are deduced directly from this approximation. More detailed explanation of the modified LAR method can be found in [22].
4.2. Parameters Selection and Numeric Ranges
The developed fuel cell model includes many parameters in different physical domains. Three parameters in electrochemical domain, three parameters in fluidic domain and temperature in thermal domain have been selected for the global sensitivity analysis. The numeric variation ranges for each parameter are determined based on the reliable experimental calibrations and physical range, as summarized in the Table 3.
Table 3. Selected Parameters and Their Variation Range in Sensitivity Analysis
Physical domains No. Parameters Lower bound Upper bound
Electrical domain
1 Charge transfer coefficient 0.245 0.300
2 Empirical parameter 2.178 2.662
3 Empirical parameter 2.300 2.800
Fluidic domain
4 Tortuosity 0.30 0.40
5 Porosity 2.5 3.2
6 GDL thickness (m) 3.4e-04 4.15e-04
Thermal domain 7 Fuel cell catalyst layer temperature
(K) 300 365
From basic physical understanding, it is expected that, the charge transfer coefficient and two empirical parameters , have influences on fuel cell , as expressed in Eq. (5) and (6). Fluidic
parameters , , have different influences on the characteristics of gas diffusion phenomenon. Fuel
cell catalyst layer (where the electrochemical reaction occurs) temperature has influences on the
physical phenomena in both electrochemical and fluidic domains.
4.3. First-Order and Total-Order Sensitivity Indices
In order to give a comprehensive sensitivity analysis, the Sobol global sensitivity analysis described previously is firstly applied to the proposed model for full operating range of Ballard NEXA 1.2 kW fuel cell (load current from 1A to 47A).
When the value of total-order index is larger than 0.1, the parameter is considered as sensitive parameter. The first-order and total-order sensitivity indices results of above-mentioned 7 parameters are then shown in Fig. 19 for different fuel cell current values.
Fig. 19. First-order and total-order indices of selected parameters.
It can be seen from the indices of selected parameters in Fig. 19 that, is a sensitive parameter in the whole current range. In the current range of 1.4A to 41.5A, the empirical parameter can be considered as sensitive parameter. In contrast, the empirical parameter has little effects on the model output. The and can be considered as sensitive parameters when the operating current is higher than 26A. That is because at high current the electrochemical reaction rate is increased and more reactant gas is consumed at catalyst layer, therefore, and becomes dominant factors to the effective diffusivity of gaseous species (also known as “concentration loss” near limiting current), and further influence the fuel cell performance. is however an insensitive parameter, which have relatively
small effects on the model outputs. At last, the fuel cell catalyst layer temperature is a sensitive
parameter for the whole current range.
In addition, from all the 7 analyzed parameters, the have the most significant impact on model output voltage when the operating current is less than 20A.
It should be noted that, the difference between the indices value of first-order and total-order allow us to measure the total interactions of one parameter with all the other parameters. It can be seen from Fig. 19 that, at high operating current, many parameters show different values of their first-order and total-order sensitivity indices, which indicate significant interaction between the studied parameter with others. In order to better understand these interaction effects, the analysis of second-order indices need to be further performed at high operating current range.
4.4. Second-Order Sensitivity Indices
The second-order sensitivity indices are calculated at fuel cell rated power point (46A) in real-time, as shown in Fig. 20. In Fig. 20, the X-axis represents the number of parameters (2-7), Y-axis represents the number of parameters (1-6), Z-axis represents the second-order Sobol indices value. Similar to the previous definition of total-order indices, when the value of second-order index is larger than 0.01, the corresponding parameter interaction is considered sensitive.
Fig. 20. Second-order indices measure the interactions between parameters.
It can be seen from Fig. 20 that, both the parameters and have the strongest interaction effect. Another important interaction is between and ( ). It can be also seen that, there is no interaction
between electrochemical parameters and fluidic parameters. It has to be noted that, although the
is not the most important parameter affecting the model outputs (indicated by total-order indices), it has sensitive interactions with several parameters including the , , and , respectively. This
It is thus necessary to further analyze in detail the causes of these interactions and their influences on the fuel cell performance.
4.5. Further Analysis of Significant Interactions 1) Interaction between and
From the analysis results of Fig. 20, the most important interaction is between porosity and tortuosity , which have an exponential relation. By varying the value of porosity and tortuosity , their effects on the oxygen pressure distribution on the GDL surface are shown in Fig. 21.
Fig. 21. For different values of , different variations of oxygen pressure distribution due to changing of . It can be seen from Fig. 21 that, when the value of parameter is set to 2.5, the maximum difference of oxygen pressure distribution on the GDL surface is about 7% as the decrease from 0.40 to 0.30.
However, when the value of is set to 3.2, the maximum difference of oxygen pressure distribution on the surface of GDL is about 27% with same variation. The reason of this interaction effect is obvious, as shown in the Eq. (9), the is the exponent and the is the base, the variation of one has a significant impact on the other one. Thus, in order to improve the accuracy of local phenomena prediction in PEMFC model (e.g. gas pressure and current density distribution on electrodes), both the fluidic parameters and should be carefully determined.
2) Interaction between and
For different combination of parameters and , their effects on the gas diffusion phenomena are
shown in Fig. 22.
It can be seen from Fig. 22 that, when , the maximum difference of oxygen pressure
distribution on electrode is about 12% as the decrease from 0.40 to 0.30. When , the
maximum difference of oxygen pressure distribution on the surface of GDL is about 25% for the same variation. The reason of this interaction can be indicated by Eq. (8) and (9). As the Eq. (8) and (9) expressed, both the and have influences on the characteristics of gas diffusion phenomena in the
gas diffusion layer. A larger GDL thickness leads to more significant effects of tortuosity on the
gas diffusion phenomenon (more pressures drop through the gas diffusion layer).
From this analysis results, it should be noted that although the is an insensitive parameter, it
has a highly sensitive interaction effect on the . Thus, the value of should be also carefully
chosen. On the other hand, for the interaction between and , the similar conclusion can be
obtained.
In addition, another important fact should also be mentioned: the fluidic parameters and are affected significantly by fuel cell degradation. It means that, during the fuel cell aging process, the
varies due to mechanical stresses and surface carbon corrosion, as well as and . Thus, in order
to ensure the model accuracy, the parameters value of and need to be both carefully re-calibrated during long-term fuel cell operation.
3) Interaction between and
Under different , varying tortuosity also have different effects on the gas diffusion
Fig. 23. Under different , different variations of oxygen pressure distribution due to changing of .
From Fig. 23, when , the maximum difference of oxygen pressure distribution on the
GDL surface is about 24.2% as decrease from 0.40 to 0.30. When , the maximum
difference of oxygen pressure distribution on the surface of GDL is only about 13.5% for the same variation. That is because higher temperature causes lower effective diffusivity as shown
in the Eq. (9) [26]. Therefore, the parameter have less impact on gas diffusion phenomenon at higher temperature (similar to the porosity ), which results in a more uniform distribution of oxygen pressure on the surface of electrode and further improve the fuel cell performance. It can thus be concluded that, a higher temperature makes the tortuosity (porosity )less sensitive for fuel cell performance.
4) Interaction between and
As mentioned previously, the variations of have influences on the . Under different ,
these influences are however different as shown in Fig. 24. It can be seen that, when catalyst layer temperature , the maximum difference of distribution is around 0.14V as the
increase from 0.26 to 0.30. When , the maximum difference of activation loss
distribution is around 0.1V for the same variation of . Thus, a lower temperature would make the more sensitive for local current density prediction. It means that, a lower operating temperature can effectively prevent local “hotspot” on the electrodes due to non-homogeneous distribution of reactants.
Fig. 24. Under different , different variations of distribution due to changing of . 5. Conclusions
This paper proposes a 2-D multi-physical real-time model of proton exchange membrane fuel cell. By fully taking the fuel cell channel geometric form into consideration, the characteristics of reactant gas under-rib convection between neighboring channels and diffusion phenomenon in the gas diffusion layers can be well described in the developed fluidic model. In addition, an implicit iterative solver has been developed to solve spatial physical quantities distribution in electrochemical domain. This original iterative solver algorithm is composed by three interactive computational loops and uses a robust convergence method for real-time computation. The proposed 2-D real-time modeling approach can be easily applied to any real-time control implementation or online diagnostic system.
The experimental validation of the proposed 2-D model is then performed with a commercial Ballard NEXA 1.2 kW PEMFC stack. The spatial physical quantities information, such as gas pressure, current density on the electrode surface, can be accurately observed and analysed in real-time by taking the multiple spatial dimensions into consideration using the 2-D developed model.
Although the parameters sensitivity analysis plays a key role during the fuel cell model development, such study has not been reported so far in the literature. In the second part of this paper, based on the developed real-time model, an iterative Least Angle Regression (LAR) method is used to efficiently and accurately perform the global parameters sensitivity analysis. Specifically, the interaction effects between parameters from different physical domains are fully analyzed. Such online sensitivity analysis results are very useful to help to design the fuel cell model-based real-time controller, or online prognostic and health management system.
In the future work, we would like to apply the same analysis for full-scale fuel cell system used in the fuel cell hybrid electric vehicles, in order to further investigate the scale effects.
Acknowledgement
This work is supported by European Commission H2020 grant ESPESA (H2020-TWINN-2015) EU Grant agreement No: 692224.
References
[1] D. Zhou, A. Ravey, A. Al-Durra, F. Gao, A comparative study of extremum seeking methods applied to online energy management strategy of fuel cell hybrid electric vehicles, Energy Convers Manage 151 (2017) 778-790.
[2] Z. Hu, J. Li, L. Xu, et al, Multi-objective energy management optimization and parameter sizing for proton exchange membrane hybrid fuel cell vehicles, Energy Convers Manage 129 (2016) 108-121.
[3] B. Duan, Q. Wang, X. Zeng, Y. Gong, D. Song, J. Wang, Calibration methodology for energy management system of a plug-in hybrid electric vehicle, Energy Convers Manage 136 (2017) 240-248.
[4] S. Nojavan, M. Majidi, K. Zare, Performance improvement of a battery/PV/fuel cell/grid hybrid energy system considering load uncertainty modeling using IGDT, Energy Convers Manage 147 (2017) 29-39. [5] Y. Jia, H. Wang, M Ouyang, Electric power system for a Chinese fuel cell city bus, J. Power Sources 155
(2006) 319-324.
[6] C. Kunusch, P. F. Puleston, M. A. Mayosky, A. P. Husar, Control-Oriented Modeling and Experimental Validation of a PEMFC Generation System, IEEE Trans. Energy Convers 26 (2011) 851-861.
[7] F. Gao, B. Blunier, A. Miraoui, A. El-Moudni, A multiphysic dynamic 1-d model of a PEM fuel-cell stack for real-time simulation, IEEE Trans. Ind. Electron. 57 (2010) 1853-1864.
[8] M. Solsona, C. Kunusch, C. O. Martinez, Control-oriented model of a membrane humidifier for fuel cell applications, Energy Convers Manage 137 (2017) 121-129.
[9] F. Gao, B. Blunier, A. Miraoui, A. El-Moudni, Proton exchange membrane fuel cell multi-physical dynamics and stack spatial non-homogeneity analyses, J. Power Sources 195 (2010) 7609-7626.
[10] A. Raj, T. Shamim, Investigation of the effect of multidimensionality in PEM fuel cells, Energy Convers Manage 137 (2014) 443-452
[11] P. Massonnat, F. Gao, R. Roche, D. Paire, D. Bouquain, A. Miraoui, Multiphysical, multidimensional real-time PEM fuel cell modeling for embedded applications, Energy Convers Manage 88 (2014) 554-564. [12] M. Mangold, A. Bück and R. Hanke-Rauschenbach, Passivity based control of a distributed pem fuel cell
model, J. Process Control 20 (2010) 292–313.
[13] H. Park, Numerical simulations of a full-scale polymer electrolyte fuel cell with analysing systematic performance in an automotive application, Energy Convers Manage 103 (2015) 623-638.
[14] M. Hafttananian, A. Ramiar, A.A. Ranjbar, Novel techniques of oxygen bleeding for polymer electrolyte fuel cells under impure anode feeding and poisoning condition: A computational study using OpenFOAM®, Energy Convers Manage 122 (2016) 564-579.
[15] A. Weber and J. Newman, Modeling Transport in Polymer-Electrolyte Fuel Cells, Chem. Rev 104 (2004) 4679–4726.
[16] A. Raj, T. Shamim, A. Raj, T. Shamim, CFD analysis of bubble hydrodynamics in a fuel reactor for a hydrogen-fueled chemical looping combustion system, Energy Convers Manage 86 (2014) 443-452
[17] B. R. Sivertsen and N. Djilali, CFD-based modelling of proton exchange membrane fuel cells, J. Power Sources 141 (2005) 65-78.
[18] J. Correa, F. Farret, V. Popov, and M. Simoes, Sensitivity analysis of the modeling parameters used in simulation of PEM fuel cells, IEEE Trans. Energy Convers 20 (2005) 211–218.
[19] N. Dalasm, M. Kermani, D. Moghaddam, J. Stockie, A parametric study of cathode catalyst layer structural parameters on the performance of a pem fuel cell, Int. J. Hydrogen Energy 35 (2010) 2417–2427.
[20] D. Zhou, K. Zhang, A. Ravey, F. Gao, A. Miraoui, Parameter Sensitivity Analysis for Fractional-Order Modeling of Lithium-Ion Batteries, Energies 9 (2016) no. 123.
[21] I.M. Sobol, Global sensitivity indices for nonlinear mathematical models and their Monte Carlo estimates, Mathematics and Computers in Simulation 55 (2001) 1-3.
[22] T. Nguyen, H. Mac, S. Clénet, Uncertainty Quantification Using Sparse Approximation for Models With a High Number of Parameters: Application to a Magnetoelectric Sensor, IEEE Trans. Magnetics 52 (2016) art. 7206404.
[23] D. Zhou, F. Gao, E. Breaz, A. Ravey, A. Miraoui, K. Zhang, Dynamic phenomena coupling analysis and modeling of PEMFCs, IEEE Trans. Energy Convers. 31 (2016) 1399–1412.
[24] D. Zhou, F. Gao, E. Breaz, A. Ravey, A. Miraoui, Development of a Multiphysical Multidimensional Modeling of Proton Exchange Membrane Fuel Cell, in Proc. IEEE ITEC, Jun. 27-29, 2016.
[25] D. Zhou, E. Breaz, A. Ravey, F. Gao, A. Miraoui, K. Zhang, Dynamic variable coupling analysis and modeling of proton exchange membrane fuel cells for water and thermal management, in Proc. IEEE APEC, Mar. 20-24, 2016.
[26] F. Gao, B. Blunier, A. Miraoui, A. El-Moudni, Cell layer level generalized dynamic modeling of a PEMFC stack using VHDL-AMS language, Int. J. Hydrogen Energy 34 (2009) 5498-5521.
[27] D. Zhao, M. Dou, D. Zhou, F. Gao, Study of the modeling parameter effects on the polarization characteristics of the PEM fuel cell, Int. J. Hydrogen Energy 41 (2016) 22316-22327.
[28] J. Larminie, A. Dicks, Fuel Cell Systems Explained. Hoboken, NJ, USA: Wiley, 2000
[29] S. Maharudrayya, S. Jayanti, A.P. Deshpande, Pressure losses in laminar flow through serpentine channels in fuel cell stacks, J. Power Sources 138 (2004) 1-13.
[30] S. Maharudrayya, S. Jayanti, A. P. Deshpande, Pressure drop and flow distribution in multiple parallel-channel configurations used in proton-exchange membrane fuel cell stacks, J. Power Sources 157 (2006) 358-367.
[31] M. Bressel, M. Hilairet, D. Hissel, B. Ould-Bouamama, Extended Kalman filter for prognostic of proton exchange membrane fuel cell. Appl. Energy 164 (2015) 220-227.