Science Arts & Métiers (SAM)
is an open access repository that collects the work of Arts et Métiers Institute of
Technology researchers and makes it freely available over the web where possible.
This is an author-deposited version published in:
https://sam.ensam.eu
Handle ID: .
http://hdl.handle.net/10985/13094
To cite this version :
Adrien DONNARD, Sandra GUERARD, Laurent MAHEO, Philippe VIOT, Gérard RIO - Multiaxial
experiments with radial loading paths on a polymeric foam - Polymer Testing - Vol. 67, p.441-449
- 2018
Any correspondence concerning this service should be sent to the repository
Contents lists available atScienceDirect
Polymer Testing
journal homepage:www.elsevier.com/locate/polytest
Multiaxial experiments with radial loading paths on a polymeric foam
Adrien Donnard
a, Sandra Guérard
a, Laurent Maheo
b,c,∗, Philippe Viot
a, Gérard Rio
baArts et Metiers ParisTech, I2M, CNRS UMR 5295, F-33405 Talence, France bUniv Bretagne Sud, IRDL, CNRS UMR 6027, F-56321 Lorient, France cSt-Cyr Military Academy, CREC, F-56381 Guer, France
A R T I C L E I N F O
Keywords:
Cellular materials Multiaxial experiments
Analyzing shape and volume changes
A B S T R A C T
Cellular materials such as polymeric foams in particular have been widely studied under uniaxial loading conditions. Many experimental studies have been focusing recently, however, on the responses of these foams to multiaxial loads. In the present study, a novel experimental hexapod device was used to perform combined uniaxial compression and simple shear tests. Using a post-processing method of analysis which can be used to study elementary mechanical behavior, the authors show the occurrence of non-proportional stress paths in the material under investigation although proportional kinematic paths were imposed. A failure limit criterion is presented for use with the foam of interest. The results of the present analysis yield useful information for meeting our future objective, namely to develop a numerical model for simulating multiaxial loading conditions.
1. Introduction
Cellular materials have been widely used for many years for man-ufacturing safety equipment and protective applications. Because of their considerable dissipative capacity and their weak force transmis-sion properties, they are good candidates for protecting both goods and persons. The choice of cellular materials, which range from soft polymer foam to rigid aluminum foam, depends on the damping power required. Mills et al. [1], for instance, have studied the use of polymer foams for producing several types of personal protection, such as cushions, shoes and helmets. Fernandes and Alves de Sousa [2] recently published a review focusing on motorcycle helmets and showed the importance of including polymeric foam liners in the helmet design. The authors of the previous study [2] have also briefly addressed the topic of Finite Element models, citing several studies in which impact tests were simulated with a view to optimizing helmet design. In the present context of engineering applications, Yang and Shim [3] have recommended using a macroscopic description of the responses ob-served, taking elastomer foams to constitute a homogeneous con-tinuum. Foam behavior can therefore be decomposed into elementary behavior such as hyperelasticity, viscosity and irreversible transfor-mations.
When drawing up numerical models simulating foams subjected to mechanical loads, it is necessary to characterize the material. In most previous studies, foams have been characterized experimentally by performing uniaxial compression tests, which are easy to apply. The influence of the strain rate or the impact speed has often been studied to
account for the normal conditions of use, as in Refs. [4–7]. However, the validity of these characterizations and models is questionable when the mechanical loads are no longer uniaxial loads. Some models such as Ogden's model [8] have taken several loading conditions into account. This model, which was developed for rubber-like materials, has been extended to compressible materials by including the changes of volume in addition to the shape change behavior. This distinction is a natural way of describing the hyperelastic behavior of rubber-like and cellular materials, and has been adopted in several models such as the Mooney-Rivlin [9,10] model, which is based on tensor invariants, and the Ogden model, which is based on principal stretches.
Several authors have naturally performed multiaxial experiments to provide numerical models with data. Volume change behavior has been studied by performing hydrostatic tests [4,11–14] and shape change behavior, by performing simple shear tests [4,15,16]. In both cases, the question of finding suitable methods for the post-processing analysis multiaxial data arises. In the case of large transformations, Criscione et al. [17] used an invariant basis for natural strains consisting of the amount-of-dilatation, the magnitude-of-distortion and the mode-of-distor-tion. These authors recommended using natural or Hencky strain and Cauchy stress tensors to study and compare the results of multiaxial loading tests. Combaz et al. [18,19] recently used these post-processing tools to analyze the results of tests on aluminum and polymeric foams subjected to multiaxial loads.
In the present study, quasi-static multiaxial experiments were per-formed with radial loading paths on a polymeric foam. This Polypropylene foam has been studied in detail by Viot et al. [5,7,12] by
https://doi.org/10.1016/j.polymertesting.2018.03.003
Received 30 October 2017; Received in revised form 1 February 2018; Accepted 3 March 2018
∗Corresponding author. Univ Bretagne Sud, IRDL, CNRS UMR 6027, F-56321 Lorient, France.
E-mail address:[email protected](L. Maheo).
Available online 16 March 2018
0142-9418/ © 2018 Elsevier Ltd. All rights reserved.
performing uniaxial and hydrostatic compression tests at several strain rates. In the present study, simple shear tests and tests involving simple shear combined with uniaxial compression were conducted using a novel hexapod device [20] with which controlled shape changes and volume changes can be imposed. Using the method of analysis pre-sented in Refs. [18,19], shape change and volume change processes were analyzed and compared between various imposed radial loading paths.
In the first part of this study (Section2), the mechanical behavior of the Expanded Polypropylene foam under investigation is briefly de-scribed and the size of the specimens used is explained. The hexapod device and the post-processing method of analysis used are also pre-sented. In the second part (Section3), the results of basic experiments such as uniaxial compression and tension and simple shear tests are presented. The multiaxial loading experiments performed are described and the results are presented and discussed in Section 4. Lastly, the main results obtained are summarized in section5.
2. Material and methods 2.1. Material
2.1.1. Polypropylene foam
This study was performed on a closed-cell expanded polypropylene (EPP) foam called Arpro supplied by the company JSP. This foam has been widely studied by the present authors, who have established that the strain rate and the density both affect the mechanical behavior of the material under uniaxial compression [5] and hydrostatic compres-sion [12] loading conditions. To extend this database, a new specimen of the same material with a mean density of 85.3 kg m−3 (standard deviation 4.3 kg m−3) was prepared.
2.1.2. Description of the samples
Two main characteristics have to be taken into consideration when performing mechanical tests. First, the specimen size has to be suitable for obtaining representative, fairly homogeneous elementary mechan-ical responses. Secondly, the shape of the specimen must correspond to the types of loading applied in the tests.
In the case of the present uniaxial tension tests, a dogbone specimen designed in line with standard NF EN ISO 1798 [21] was used in order to concentrate the strain in the thinnest part of the specimen.
In the case of simple shear tests, the shape of the specimen greatly affects the results [22,23]. Simple shear tests induce a tangential force and a normal force on the loaded faces. These two forces combined induce a compression load and a tensile load near the free edges [24,25], which could be regarded as a bending load. This process can be reduced by increasing the elongation ratio hl of the specimen, where l and h are the length and the height of the specimen, respectively.
Bouvier et al. [25], for instance, used an elongation ratio of 10 on a metal sheet sample, G'Sell et al. [24] recommended a ratio of more than 15 in the case of polymers, and Mostafa et al. [26] used a ratio of 13 in that of a foam sample. Specimens measuring 300 mm long, 20 mm high and 20 mm wide, having an aspect ratio l
hof 15 were chosen here for performing both simple shear and uniaxial compression tests. 2.2. Methods
2.2.1. Experimental devices
A classical electromechanical Zwick Z250 Roell device was used to perform quasi-static uniaxial tensile tests in line with the procedure defined in the French standard NF EN ISO 1798 [21]. A crosshead speed of 41.25 mm min−1was imposed in order to obtain a strain rate of 0.0125 s−1. Uniaxial stress was obtained using a 10 kN sensor and strain field with Digital Image Correlation (D.I.C.) VIC2D software from pictures recorded by a camera (CANON EOS 50D) at a frequency of 1 Hz.
Multiaxial experiments tests were performed using a hexapod fa-cility.Fig. 1shows the hexapod, which is a modified Gough-Stewart platform, a type of parallel robot constituted of a fixed and a moving platform. Thanks to 6 electromechanical jacks, the top plate can be moved independently in the six degrees of freedom, corresponding to three translation axes and three rotation axes. Its horizontal velocity can reach 1.4 m/s and the maximal vertical velocity is 1 m/s. For the multiaxial tests, a rigid arm is mounted perpendicular to the moving top platform. Specimens were glued between 2 steel plates, one of which was screwed onto a rigid arm and the other, onto a base frame. This arrangement made it possible to apply loads of all kinds to the sample, including even complex loads such as combinations of movements. The hexapod was able to reach speeds of up to 1 m/s in all directions. However, the present study focused simply on quasi-static loading performed at a speed of 0.25 mm/s. Strain rates of ε˙zz= 0.0125 s−1and
γ˙yz= 0.0125 s−1were imposed at each test so as to be able to compare the results obtained without any involvement of the viscous contribu-tion.
Forces were obtained using a piezoelectric 3D sensor (Kistler 9377C) mounted between the rigid arm and the sample. The local basis (X,Y,Z) of the sensor was defined as shown inFig. 1b. The sensor was set at 2, 10, and 10 kN in the X, Y and Z directions, respectively. Electrical signals were then amplified and recorded at a frequency of 100 Hz, as can be seen inFig. 2in the particular case of a uniaxial compression applied on the Z-axis and a simple shear applied si-multaneously on the YZ-plane.
As in the tensile tests, the displacements and strain fields were calculated using the D.I.C. technique. The region of interest in the D.I.C. was chosen so as to rule out the occurrence of boundary effects by excluding the areas on both sides of the specimen and those near the steel plates (seeFig. 3). A second camera was placed perpendicularly to
Fig. 1. The hexapod device. A black 300 × 20 × 20 mm sample of EPP foam was glued between two steel plates.
A. Donnard et al. Polymer Testing 67 (2018) 441–449
the first one in order to detect any transversal strains occurring during the application of uniaxial compression and simple shear loads.
2.2.2. Post-processing of the multiaxial test data
In the case of a simple shear load or a uniaxial compression load or both loads applied simultaneously, the components of the symmetric Cauchy stress tensor expressed in the hexapod coordinate system can be written as in equation(1). =⎡ ⎣ ⎢ ⎢ ⎤ ⎦ ⎥ ⎥ = = σ σ σ σ σ F S σ F S [ ] 0 0 0 0 0 0 with and ij yz yz zz zz z yz y (1) whereFiis the force recorded in the i-direction, andSis the current z-normal section. It is important to note that in both experiments, al-though the shear components σxy and σxz were not measured, they were assumed to be null because EPP foam is generally reputed to be macroscopically homogeneous. The Fx force component recorded by the sensor was almost equal to 0. Even if it means that the average global value ofσxxis vanishingly small, the local component ofσxxmay have non-zero value, because edge effects have not been taken into account. The same explanation can be given for theσyystress compo-nent. Even if the average value ofσyycan be considered as negligible, its local value is non-zero as specimen with large transversal dimensions under uniaxial compressive loadings involves local transversal stresses, except for null effective Poisson ratio materials. Because the present experiments do not allow obtaining these local variables, the assump-tion of zero value forσxxandσyyhas been made.
The logarithmic strain tensor obtained using the D.I.C. technique, which is presented in equation(2), involves only two dimensions. As-suming that we were dealing here with macroscopically homogeneous material, εxy andεxzcould be taken to be equal to 0 under both loading conditions. =⎡ ⎣ ⎢ ⎢ ⎤ ⎦ ⎥ ⎥ ε ε ε ε ε ε [ ] 0 0 0 0 ij xx yy yz yz zz (2)
A second camera was placed perpendicularly to the first one in order to measure the transversal strain. The transversal strainεxxdid not exceed 0.6% in any of the simple shear tests, and was therefore not significant. For the sake of simplicity, theεxx strain component was therefore set at 0 in the simple shear and uniaxial compression tests. Section3.1gives further information about the effective Poisson ratio in the case of tensile tests. Other components of the strain tensor (see equation(2)) were calculated from the results obtained using the D.I.C. technique.
2.2.3. Choice of the post-processing framework
Multiaxial experiments are complex tests from which it can be dif-ficult to extract useful data. The classical stress-strain curve inFig. 4is not appropriate for comparing various loads or determining the re-sponses of the material to multiaxial loads. One way of simplifying the analysis consists in studying the elementary mechanical behavior by separating the volume change responses from the shape change re-sponses, in line with Combaz et al. [18,19]. These two contributions have been classically defined as the spherical and deviatoric parts of the stress and strain tensors, as long as suitable tensors are chosen. Due to the large transformations occurring in EPP foam, Criscione et al. [17] have recommended using the Cauchy stress tensor associated with the Hencky logarithmic strain tensor.
The volume and shape changes can be separated by performing a spherical/deviatoric decomposition: σ͠ =σ͠s+σ͠d and ε͠ =ε͠s+ε ,͠d where the superscripts .s and.d denote the spherical and deviatoric contributions, respectively. The invariants of the tensor a͠ used in the present study were:
Fig. 2. Forces recorded under simultaneous uniaxial compression and simple shear loads.
Fig. 3. Normalized strain field εyzobtained by D.I.C. analysis. The region of interest was chosen with a view to ruling out the occurrence of any boundary effects. Fig. 4. Uniaxially loaded EPP foam at a strain rate of 0.0125 s−1.
⎧ ⎨ ⎪ ⎩ ⎪ = = − = I tr a II I tr a III det a ( ) (( ) ( )) ( ) ͠ ͠ ͠ a a a a 1 2 2 2 ͠ ͠ ͠ ͠ (3)
The volume change contribution was assessed from the pressure p versus the relative volume V . Relations between these two variables can be expressed as follows, taking the first invariant of the stress tensor,Iσ͠, or the strain tensor,Iε͠:
= − = =
( )
p I V v v I 3 ; exp σ ε 0 ͠ ͠ (4) where v andv0are the current and initial volume, respectively.The shape change contribution, which is complementary to the volume change contribution, can be described by:
— the intensities of the deviatoric tensors, the deviatoric stress in-tensity Qσ and the deviatoric strain inin-tensity Qε, based on the second invariant of their deviatoric tensors, IIσ͠d and IIε͠d,
respec-tively.
= = − = = −
Qσ σ͠d:σ͠d 2IIσ͠d ; Qε ε͠d:ε͠d 2IIε͠d (5)
— the directions in the deviatoric planes, which are given by the Lode anglesφσandφεdefined in terms of the third and second invariants of the stress and strain deviatoric tensors, respectively.
= ⎛ ⎝ ⎜ − ⎞ ⎠ ⎟ = ⎛ ⎝ ⎜ − ⎞ ⎠ ⎟ φ III II φ III II 1 3arccos 3 6( 2 ) ; 1 3arccos 3 6( 2 ) σ σ σ ε ε ε 3 2 3 2 ͠ ͠ ͠ ͠ d d d d (6) One of the advantages of using mathematical tensor invariants is that this makes it possible to compare mechanically relevant variables which do not depend on the coordinate system used. In the case of the experiments presented in section 2.2.1, it was therefore possible to calculate the volume change and shape change variables from the ex-perimental data as follows:
⎧ ⎨ ⎪ ⎪ ⎪ ⎩ ⎪ ⎪ ⎪ = − = + = ⎛ ⎝ ⎜ ⎜ ⎞ ⎠ ⎟ ⎟ ⎛ ⎝ + ⎞⎠ +
(
)
p Q σ σ φ 2 arccos σ σ zz yz σ σ σ σ σ 3 2 3 2 2 1 3 6 2 zz zz zz yz zz yz 2 3 2 3 3 2 2 3 2 2 3 2 (7) ⎧ ⎨ ⎪ ⎪⎪ ⎩ ⎪ ⎪ ⎪ = + + = − + − + − + = ⎛ ⎝ ⎜ ⎜ ⎞ ⎠ ⎟ ⎟ − + − + − + − + + − + − + − +(
)
V ε ε ε Q ε ε ε ε ε ε ε φ exp( ) [( ) ( ) ( ) ] 2 arccos xx yy zz ε xx yy yy zz zz xx yz ε ε ε ε ε ε ε ε ε ε ε ε ε ε ε ε ε ε 2 3 2 2 2 2 1 3 [( ) ( ) ( ) ] 6 ( 2 ) [( ) ( ) ( ) ] 2 xx yy yy zz zz xx yz xx yy zz xx yy yy zz zz xx yz 6 9 3 3 3 2 2 3 2 2 2 2 32 (8) It is also worth defining two other geometric variables to make easier the understanding of strain and stress paths. The kinematic angle θε can be defined as the elevation of the volume related to the devia-toric strain plane. With the same manner, the stress angleθσ can be defined as the elevation of the pressure related to the deviatoric stress plane, and corresponds to the triaxiality value. These two variables give meaningful information on the volume change compared to the shape change and will be defined in the following sections.3. Basic experiments 3.1. Effective Poisson ratio
Mechanical characterization of cellular materials is usually con-ducted by performing uniaxial compression tests. To obtain failure data,
uniaxial tensile tests can also be performed. The stress vs. strain graph obtained with the present EPP material is given by the full colored curves inFig. 4. The compression response of the EPP material shows the presence of a large reversible contribution and a large hysteresis loop when loading - unloading was performed.
Another parameter often used to characterize cellular materials' behavior is the transversal changes occurring during uniaxial loading, which have been assimilated to an effective Poisson ratio. This para-meter is known to be non-constant and often amounts to almost zero under uniaxial compression loading conditions [27,28], which can be explained by micro-structural features of the material with the works of Gibson and Ashby [29] or more recently with the numerical works of Mihai and Goriely [30]. Indeed, under compressive loadings, the foam cells collapse, by a buckling process of the cell walls, in the free space of the cell and this involves a low effective Poisson ratio. Under tensile loading, the process is different. The foam cells are stretched and this involves a contraction of the cell in the transversal direction and a non-null Poisson ratio. Under simple shear loading, foam cells are subjected to both compression and tension. Equilibrium of the foam under simple shear loading involves a competition between tension and compression processes in terms of transversal strain.
Based on the images recorded during the tests, transversal strains have been measured in order to obtain the effective Poisson ratio. As was to be expected and explained above, in line with findings made by Widdle et al. [28], the effective Poisson ratio of the present EPP ma-terial varies during uniaxial loading (see the dotted colored curves in
Fig. 4). It amounts to approximately 0.27 during uniaxial tension and
ranges from 0.27 to 0.03 during uniaxial compression. When a spe-cimen for hexapod device is used, the effective Poisson ratio is very different from a specimen for classical electromechanical device (see dotted green curve inFig. 4). Indeed, the effective Poisson ratio is al-most equal to 0.02 since the beginning of the compressive test. This is due to the size of the specimen that limits transversal displacements and also involves a stress increase (see full green curve inFig. 4).
As explained in section2.2.2, the assumption thatεxx = 0 in the case of uniaxial compression and simple shear was adopted here for the sake of simplicity. However, this assumption cannot be made in the case of uniaxial tensile tests. The strain components εxx and εyy were therefore calculated using an effective Poisson ratio of 0.27 to be in line with the experimental values. All the strain invariants in equation(8)
were therefore calculated on the basis of these assumptions. 3.2. Comparisons between basic experiments
The results of uniaxial compression, simple shear and uniaxial tension tests were expressed in the post-processing framework pre-sented in section2.2.3in terms of the volume change and shape change contributions. Uniaxial compression and simple shear tests were per-formed using the hexapod device and the specimen described in section
2.1.2. Uniaxial tension tests were performed using a conventional
electromechanical device and a specimen corresponding to French standard NF EN ISO 1798 [21]. All these experiments were performed with a strain rateε˙ = 0.0125 s−1.
The repeatability of all the tests was checked. Three specimens at least were tested in each case. As shown inFig. 5, the results obtained in the experiments of each kind showed good repeatability. The slight variations observed were due to the density of the specimens, which affects the mechanical behavior of foam [29] but did not invalidate the results of the analysis. The onset of rupture of the specimen is indicated by pink stars on all the graphs presented in this paper.
The contribution of volume changes is presented inFig. 5a in all the basic tests. Uniaxial compression resulted in a decrease in the volume of the specimen and an increase in the pressure (red curves inFig. 5a). A pressure threshold can be clearly observed at a pressure p = 0.2 MPa and a volume ratio V = 0.98. This threshold matches the behavioral change observed on the microscopic scale between the elastic porosity
A. Donnard et al. Polymer Testing 67 (2018) 441–449
stage and the stress plateau stage [29]. Uniaxial tension resulted in an increase in the volume and a decrease in the pressure until failure oc-curred at a pressure p = −0.32 MPa (see pink stars on blue curves in
Fig. 5a). Simple shear resulted in a drop of 0.08 MPa in the pressure, as
shown by the green curves inFig. 5a. This drop was due to the nature of the simple shear load, which was not a pure shear load. A slight de-crease in the volume was also observed in the simple shear test, due to issues concerning the rigidity of the device. The effects of the rigidity of the device were corrected and reduced in all the shear tests by adjusting the movements of the hexapod platform. An arbitrary criterion defining valid tests was set at 2% of the maximum volume change.
The contribution of the shape changes is presented inFig. 5b. In the case of uniaxial compression, a shear threshold was observed at a shear intensity Qσ = 0.5 MPa and a distortion intensity Qε = 0.02, which matches the pressure threshold observed in the case of the volume change behavior. The shape change behavior corresponding to a simple shear load was nearly the same as under uniaxial tension, but at a higher shear intensity. This difference can originate in the mechanical behavior of polymers that may be different in tension and in com-pression. But it mainly originates in specimen geometries that involve non-null local transversal stressσyy, especially near the grip, for hex-apod device specimens and higher stiffness. Failure occurred at higher stress and strain intensities in the simple shear tests, Qσ = 1.1 MPa as compared to 0.8 MPa and Qε = 0.15 as compared to 0.07 under uni-axial tension, respectively.
4. Multiaxial experiments 4.1. Experimental procedure
We then focused on the influence of the volume change behavior on the shape change behavior, and vice-versa. Several multiaxial tests were performed in which radial loading paths were applied. In each of these tests, the kinematics imposed on the specimen using the hexapod fol-lowed a radial path, which can be defined as the kinematic angle θε between the ordinate axis Qε and the radial path (see equation(9)).
⎜ ⎟ ⎜ ⎟ = ⎛ ⎝ ⎞ ⎠= ⎛ ⎝ ⎞ ⎠ θ V Q I Q arctan ln arctan ε ε ε ε (9)
For instance, the kinematic angle was equal to 0° in the simple shear tests and −90° or +90° in the triaxial compression and tension tests, respectively. Using equation(8), the volume ratioIεand the distortion intensity Qε can be expressed as a function of the stretch valueλand the effective Poisson ratioα, giving θε under uniaxial loading conditions (see equation(10)). = ⎛ ⎝ ⎜ ⎜ − + ⎞ ⎠ ⎟ ⎟ θ α λ α λ arctan (1 2 )ln (1 ) ln ε 2 3 (10)
Two new radial paths in which simultaneous uniaxial compression and simple shear are combined can be arbitrary defined. The combined tests #1 and #2 followed radial loading paths. Their specific kinematic angles are defined between uniaxial compression and simple shear, and are equal to −42° and −31°, respectively. The characteristics of each test are summarized inTable 1.
4.2. Results
4.2.1. Kinematic behavior observed
The radial paths obtained in the D.I.C. analysis were presented in a diagram giving the distortion intensity vs. one of the volume variables, as shown inFig. 6.
When the results were presented in aQε − V diagram (seeFig. 6a), the curves obtained were not completely straight because of the choice of variableV =exp( ). However, when the results of the tests wereIε presented as in theQε − Iε diagram inFig. 6b, they exactly matched the radial paths applied although the Combined 1 test did not give a completely straight line. This was probably due to the large transfor-mations imposed on the hexapod device, which had some difficulty in following the imposed loading path.
Failure of the specimens (pink stars on the graphs) occurred in all the tests except the uniaxial compression test. In tests with a low ki-nematic angle, failure in terms of the distortion intensity was delayed. These diagrams are useful means of defining failure limit curves be-cause the failure process evolves very regularly with the kinematic angle. Linear and quadratic polynomial functions can therefore be used to fit the failure limit curve in both cases. Results of fitting procedure are presented inTable 2. It is worth noting that the use of a linear function gives an accurate approximation with a coefficient of de-termination R2greater than 0.99.
Fig. 5. Results of basic experiments. Pink stars indicate failure of the specimen. (For interpretation of the references to color in this figure legend, the reader is referred to the Web version of this article.)
Table 1
Controlled radial path experiments.
Loading Kinematic angle θε
Uniaxial compression ( =α 0) −51°
Combined 1 −42°
Combined 2 −31°
Simple shear 0°
4.2.2. Volume change and shape change behavior
Three multiaxial experiments of each kind were performed to check the repeatability. Results are presented in terms of volume and shape changes inFig. 7a and b, respectively. The scattering of the data was moderate and the main differences between results were due to dif-ferences between the density of the specimens.
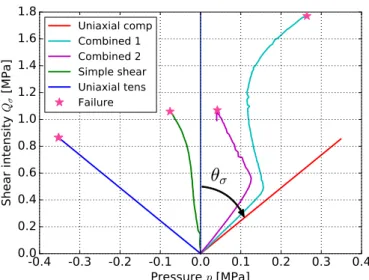
Since it is proposed in the future to model the mechanical behavior of foams by separating the volume changes from the shape changes, it is worthwhile having some parameters which describe each of these contributions. In the above two figures, the curves look alike, and most of them are composed of two different slopes, corresponding to a threshold and a failure limit. To facilitate the observation and analysis of these curves, several parameters have been defined inTable 3.
In terms of the volume changes, the first slopeK1was nearly the same in all the tests in which uniaxial loading was applied. This slope differed in the case of the simple shear tests, however, because of issues concerning the rigidity of the experimental device, as mentioned in section 3.2. The kinematic angle was found to affect the pressure threshold Pσ0 and the second slope K 2, and hence the volume change behavior. When θεincreased, the pressure threshold Pσ0 decreased and
the second slope K 2 also decreased relatively. Except for the uniaxial compression tests, in which no failure occurred, the pressure at failure Pσf decreased when θε increased. All the results showing the effects of the kinematic angle on the volume change behavior are presented in
Table 4.
In terms of the shape changes, the first slope µ1was practically nearly the same in all the basic and multiaxial tests, except for the uniaxial tensile test. This difference in stiffness can be explained, firstly, by the different mechanical behaviors in tension and compression of
Fig. 6. Radial paths obtained with the D.I.C. correlation method. Pink stars indicate failure of the specimens. The dotted line gives the failure limit. (For interpretation of the references to color in this figure legend, the reader is referred to the Web version of this article.)
Table 2
Failure limit functions.
Polynomial functions Equation Coefficient of determination R2 Linear Qε= −1.702V+1.808 0.9929 = − + Qε 1.004Iε 0.131 0.9991 Quadratic Qε=0.870V2−2.851V+2.103 0.9999 = − − + Qε 0.146Iε2 1.178Iε 0.123 1.0000
Fig. 7. Comparison between multiaxial and basic experiments. Pink stars indicate failure of the specimens. (For interpretation of the references to color in this figure legend, the reader is referred to the Web version of this article.)
Table 3
Definition of parameters.
Description Parameters Volume change Parameters Shape change
First slope K1 µ1 Threshold Pσ0 Qσ0 Second slope K2 µ2 Failure Vf and P σf Qεfand Qσf Table 4
Effects of the kinematic angle on the volume change behavior.
Loading (θε) K1 [MPa] Pσ0[MPa] K 2 [MPa] Vf[−] Pσf[MPa]
Uniaxial compression (−51°) −11.5 0.21 −0.28 – – Combined 1 (−42°) −11.7 0.15 +0.12 0.28 0.26 Combined 2 (−21°) −11.8 0.13 +0.59 0.77 0.03 Simple shear (0°) – – – 0.99 −0.08 Uniaxial tension (24°) – – – 1.04 −0.35
A. Donnard et al. Polymer Testing 67 (2018) 441–449
some polymers and, secondly, by the different specimen geometry used for these two loadings, as mentioned in section3.2.
As regards the threshold and the second slope, it is worth noting that in all the tests including a uniaxial compression loading con-tribution, i.e., the uniaxial compression test, the combined #1 and the combined #2 tests, the threshold was approximately the same at about
Qσ0
= 0.5 MPa. In these three tests, the second slope subsequently in-creased when the kinematic angle inin-creased. In a future objective of developing a new numerical model to describe EPP mechanical beha-vior or more generally foam mechanical behabeha-vior, a first process step is to define mathematical functions that can describe both volume change and shape change contributions. If the mathematical functions are the same whatever the kind of loadings (tension, compression, shear), the second process step which consisting in defining a hyperelastic poten-tial with separation of spherical and deviatoric contributions will be-come easier. If we take this point further by increasing the kinematic angle, assuming the existence of a shear threshold of 0.5 MPa in all the tests, including the simple shear and tensile tests, the second slope will therefore increase reaching a maximum in the simple shear tests. This assumption might help to explain the shape of these two curves.
Lastly, decreasing the kinematic angle delayed the failure in terms of the distortion intensity and the shear intensity. All the results showing the effects of the kinematic angle on the shape change beha-vior are presented inTable 5.
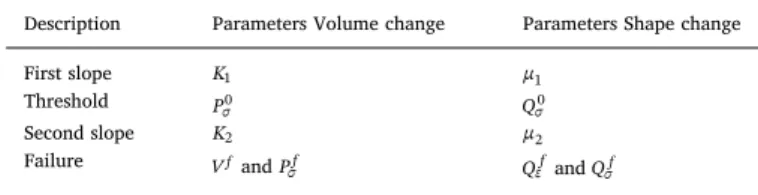
4.2.3. Stress response of the material
Just as the kinematic angle θε defines the kinematics imposed on the specimen, the stress angle θσ defined in equation (11) reflects the evolution of the loading in terms of the shear rate and the pressure, and corresponds almost to the triaxiality value.
⎜ ⎟ = ⎛ ⎝ ⎞ ⎠ θ p Q arctan σ σ (11)
For instance, in the case of a simple shear load, θσ= 0° under uniaxial loading, the stress angle can be calculated as in equation(12).
= ⎛ ⎝ ⎜ ⎜ − ⎞ ⎠ ⎟ ⎟≃ ± ° θ σ arctan 22 σ σ 3 2 3 (12)
It is worth presenting the evolution of the specimen under different loads in a ‘Shear intensity Qσ - Pressure p’ diagram such as that shown
inFig. 8.
It is worth noting that the uniaxial tension and compression loads gave straight paths. In the simple shear tests, the stress angle was not exactly null because the load applied was not a pure shear load (see section3.2). In the combined tests #1 and #2, the initial slopes were equal to 18° and 13°, respectively. A sharp change then occurred at Qσ#1 = 0.49 MPa and Qσ#2 = 0.55 MPa at the same shear and pressure thresholds. From then on, the loading path made a change of direction, resembling that obtained with uniaxial tension or simple shear loads with stress angles of θσ#1 = −4° andθ
σ#2 = −10°. Only the combined test #2 gradually resulted in another change of direction, resembling that observed under uniaxial compression loading just before failure of the specimen occurred. One important point worth noting is that with
straight imposed kinematic paths (seeFig. 6), the loading paths ob-tained were not all straight. The great differences in behavior observed between the uniaxial compression and simple shear tests (see section3) resulted in changes in the loading paths when both types of loading were combined. This key point will be confirmed in the following subsection entitled ‘Strain and stress Lode angles’. Defining a failure criterion seems to be more difficult with the stress variables p and Qσ in
Fig. 8than with the strain variables V orIεand Qε inFig. 6.
4.2.4. Stress and strain Lode angles
The loading paths in the stress or strain deviatoric planes can be approached using the strain and stress Lode angles as defined in section
2.2.3and shown inFig. 9.
All the changes in the strain Lode angles shown inFig. 9a corre-sponded to straight paths. Under uniaxial tension and compression, the Lode anglesφε= 0° andφε = 60°, respectively, which is in agreement with the theoretical values. In the case of simple shear loads, the Lode angle calculated using the Digital Image Correlation method amounted to the expected value of 30°. In the combined tests #1 and #2, the strain Lode angles obtained were approximately equal to 45° and 50°, respectively.
For the same reasons as those mentioned in section4.2.3, none of the stress Lode angles gave completely straight paths, except for those obtained with uniaxial tensile and compression loads. The stress Lode angle obtained in the simple shear test gradually departed from the shear angle, mainly because pure shear loads were not applied. In the combined tests, since the simple shear and uniaxial compressive con-tributions were very different, the stress Lode angle suddenly changed when the shear threshold was reached. This change of behavior was confirmed by the elevation related to the deviatoric stress plane (Fig. 8) and the Lode angle on the deviatoric stress plane (Fig. 9b). Failure, which may depend on either the stress or strain Lode angles, occurred earlier in the case of low Lode angles.
5. Conclusions
In this study, original multiaxial experiments were performed using a novel hexapod device, with which uniaxial compression and simple shear loads can be applied simultaneously to a polymeric foam to test its mechanical behavior with radial loading paths. The Cauchy stress tensor was obtained using a 3-D sensor and the logarithmic strain tensor using the Digital Image Correlation method. The evolution of the ef-fective Poisson ratio was determined and the assumptions adopted in
Table 5
Effects of the kinematic angle on the shape change behavior.
Loading (θε) µ1 [MPa] Qσ0[MPa] µ2 [MPa] Qεf[−] Qσf[MPa]
Uniaxial compression (−51°) 34.1 0.51 0.66 – – Combined 1 (−42°) 31.0 0.46 1.17 1.43 1.81 Combined 2 (−21°) 30.0 0.55 1.83 0.43 1.11 Simple shear (0°) 32.7 (0.47) (11.15) 0.14 1.08 Uniaxial tension (24°) 22.3 (0.55) (7.33) 0.08 0.86
Fig. 8. Loading paths obtained with the 3D sensor. Pink stars stand for failure of the specimen. (For interpretation of the references to color in this figure legend, the reader is referred to the Web version of this article.)
order to obtain inaccessible strain components are discussed.
The post-processing framework based on tensor invariants used by Combaz et al. [18,19] was adopted for comparing the results of basic and multiaxial experiments.
The results obtained in this study can be summarized as follows: 1. The mechanical behavior depends on the kinematic angle, and
hence on the contribution of the simple shear to combined loads. The results of a detailed study show the effects of this parameter on the various steps in the mechanical response of the material, de-composed into the volume and shape change contributions. In short, — the elasticity of microscopic cell walls, as defined by Gibson and Ashby [29], is not subject to any variations depending on the kinematic angle;
— the pressure threshold decreases with the kinematic angle, whereas the shear threshold does not show any changes; — the pressure resistance observed during the stress plateau evolves
in the opposite way from the shear resistance.
2. Failure occurred later in the case of combined loads involving re-lative small simple shear contributions. The failure limit can be easily determined in terms of the strain path using a distortion in-tensity-to-volume ratio diagram.
3. The radial strain paths imposed did not systematically result in straight stress paths. Since the mechanical behavior of the material differed considerably between uniaxial compression and simple shear tests, the stress paths observed in the combined tests were not radial in terms of either the pressure-to-shear intensity ratio or the stress Lode angle.
In conclusion, the results obtained in this study increase the data-base available on this widely used foam, which will also be extremely useful in our future project, in which it is proposed to model these experiments. In particular, the possibility to get the loading path in the stress space related to the strain space brings useful information. Since the novel hexapod device can be used to perform multiaxial tests, it is also intended to perform tests of this kind with various loading paths in order to determine how they affect the mechanical behavior of the material of interest.
Acknowledgments
The French Fonds Unique Interministériel (FUI number F 14 10 009 M) is gratefully acknowledged for funding the New Generation of Airliner Seats (Genosia) project.
References
[1] N.J. Mills, C. Fitzgerald, A. Gilchrist, R. Verdejo, Polymer foams for personal
protection: cushions, shoes and helmets, Compos. Sci. Technol. 63 (16) (2003) 2389–2400.
[2] F.A.O. Fernandes, R.J. Alves de Sousa, Motorcycle helmets—a state of the art re-view, Accid. Anal. Prev. 56 (2013) 1–21.
[3] L.M. Yang, V.P.W. Shim, A visco-hyperelastic constitutive description of elastomeric foam, Int. J. Impact Eng. 30 (8) (2004) 1099–1110 Eighth International Symposium on Plasticity and Impact Mechanics (IMPLAST 2003).
[4] J. Zhang, N. Kikuchi, V. Li, A. Yee, G. Nusholtz, Constitutive modeling of polymeric foam material subjected to dynamic crash loading, Int. J. Impact Eng. 21 (5) (1998) 369–386.
[5] P. Viot, F. Beani, J.-L. Lataillade, Polymeric foam behavior under dynamic com-pressive loading, J. Mater. Sci. 40 (2005) 5829–5837.
[6] S. Ouellet, D. Cronin, M. Worswick, Compressive response of polymeric foams under quasi- static, medium and high strain rate conditions, Polym. Test. 25 (6) (2006) 731–743.
[7] R. Bouix, P. Viot, J.-L. Lataillade, Polypropylene foam under dynamic loadings : strain rate, density and microstructure effects, Int. J. Impact Eng. 36 (2) (2009) 329–342.
[8] R.W. Ogden, G. Saccomandi, I. Sgura, Fitting hyperelastic models to experimental data, Comput. Mech. 34 (6) (Nov 2004) 484–502.
[9] M. Mooney, A theory of large elastic deformation, J. Appl. Phys. 11 (1940) 582. [10] R.S. Rivlin, Large elastic deformations of isotropic materials iv. further develop-ments of thegeneral theory, Phil. Trans. Roy. Soc. 241 (835) (1948) 379–397. [11] Y. Masso Moreu, N.J. Mills, Rapid hydrostatic compression of low-density
poly-meric foams, Polym. Test. 23 (3) (2004) 313–322.
[12] P. Viot, Hydrostatic compression on polypropylene foam, Int. J. Impact Eng. 36 (7) (2009) 975–989.
[13] U.E. Ozturk, G. Anlas, Hydrostatic compression of anisotropic low density poly-meric foamsunder multiple loadings and unloadings, Polym. Test. 30 (2011) 737–742.
[14] A. Krundaeva, D. De Bruyne, F. Gagliardi, W. Van Paepegem, Dynamic compressive strength and crushing properties of expanded polystyrene foam for different strain rates and different temperatures, Polym. Test. 55 (2016) 61–68.
[15] M. Kintscher, L. Kärger, A. Wetzel, D. Hartung, Stiffness and failure behaviour of folded sandwich cores under combined transverse shear and compression, Compos. Appl. Sci. Manuf. 38 (5) (2007) 1288–1295.
[16] Y. Mosleh, J. Vander Sloten, B. Depreitere, J. Ivens, Novel composite foam concept for head protection in oblique impacts, Adv. Eng. Mater. (2017) 1700059. [17] J.C. Criscione, J.D. Humphrey, A.S. Douglas, W.C. Hunter, An invariant basis for
natural strain which yields orthogonal stress response terms in isotropic hyper-elasticity, J. Mech. Phys. Solid. 48 (2000) 2445–2465.
[18] E. Combaz, C. Bacciarini, R. Charvet, W. Dufour, F. Dauphin, A. Mortensen, Yield surface of polyurethane and aluminium replicated foam, Acta Mater. 58 (15) (2010) 5168–5183.
[19] E. Combaz, C. Bacciarini, R. Charvet, W. Dufour, A. Mortensen, Multiaxial yield behaviour of al replicated foam, J. Mech. Phys. Solid. 59 (9) (2011) 1777–1793. [20] L. Maheo, S. Guérard, G. Rio, A. Donnard, P. Viot, Multiaxial behavior of foams
-experiments and modeling, 11th Int DYMAT Conference. EPJ Web Of Conferences 94 (2015), p. 04035.
[21] AFNOR. NF EN ISO 1798, Matériaux polymères alvéolaires souples - Détermination de la résistance à la traction et de l’allongement à la rupture, (April 2008). [22] A. Wada, T. Kawasaki, Y. Minoda, A. Kataoka, S. Tashiro, H. Fukuda, A method to
measure shearing modulus of the foamed core for sandwich plates, Compos. Struct. 60 (2003) 385–390.
[23] E.W. Andrews, G. Gioux, P. Onck, L.J. Gibson, Size effects in ductile cellular solids. Part II : experimental results, Int. J. Mech. Sci. 43 (2001) 701–713.
[24] C. G'Sell, S. Boni, S. Shrivastava, Application of the plane simple shear test for determination of the plastic behaviour of solid polymers at large strains, J. Mater. Sci. 18 (1983) 903–918.
[25] S. Bouvier, H. Haddadi, P. Levée, C. Teodosiu, Simple shear tests : experimental techniques and characterization of the plastic anisotropy of rolled sheets at large strains, J. Mater. Process. Technol. 172 (2006) 96–103.
Fig. 9. Strain and stress Lode angles. Pink stars stand for failure of specimen. (For interpretation of the references to color in this figure legend, the reader is referred to the Web version of this article.)
A. Donnard et al. Polymer Testing 67 (2018) 441–449
[26] A. Mostafa, K. Shankar, E.V. Morozov, Effect of shear keys diameter on the shear perfor-mance of composite sandwich panel with PVC and PU foam core : FE study, Compos. Struct. 102 (2013) 90–100.
[27] J.B. Choi, R.S. Lakes, Nonlinear properties of polymer cellular materials with a negative Poisson's ratio, J. Mater. Sci. 27 (1992) 4678–4684.
[28] R.D. Widdle, A.K. Bajaj, P. Davies, Measurement of the Poisson's ratio of flexible
polyurethane foam and its influence on a uniaxial compression model, Int. J. Eng. Sci. 46 (2008) 31–49.
[29] L.J. Gibson, M.F. Ashby, Cellular Solids. Structure and Properties. Cambridge Solid State Science Series, second ed., Cambridge University Press, 1997.
[30] L.A. Mihai, A. Goriely, Finite deformation effects in cellular structures with hy-perelastic cell walls, Int. J. Solid Struct. 53 (2015) 107–128.