Science Arts & Métiers (SAM)
is an open access repository that collects the work of Arts et Métiers Institute of
Technology researchers and makes it freely available over the web where possible.
This is an author-deposited version published in:
https://sam.ensam.eu
Handle ID: .
http://hdl.handle.net/10985/19945
This document is available under CC BY-NC-ND license
To cite this version :
Alexandre MUSSI, Julien GALLET, Olivier CASTELNAU, Patrick CORDIER - Application of
electron tomography of dislocations in beam-sensitive quartz to the determination of strain
components - Tectonophysics - Vol. 803, p.1-9 - 2021
Any correspondence concerning this service should be sent to the repository
Administrator :
archiveouverte@ensam.eu
Application of electron tomography of dislocations in beam-sensitive quartz
to the determination of strain components
Alexandre Mussi
a, Julien Gallet
a,1, Olivier Castelnau
b, Patrick Cordier
a,c,* aUniv. Lille, CNRS, INRAE, Centrale Lille, UMR 8207 - UMET – Unit´e Mat´eriaux et Transformations, F-59000 Lille, FrancebLaboratoire PIMM, Arts et Metiers Institute of Technology, CNRS, CNAM, HESAM University, 151 boulevard de l’Hˆopital, 75013 Paris, France cInstitut Universitaire de France, 1 rue Descartes, F-75005 Paris, France
Keywords:
TEM Plasticity Dislocation Tomography
Electron-beam sensitive material Quartz
Climb
von Mises criterion
A B S T R A C T
In this study we apply electron tomography of dislocations to quartz with a view to assess whether the von Mises- Taylor criterion is satisfied or violated in a deformed crystal of quartz. We propose a method to perform electron tomography with few projected images which allows extension of this technique to beam-sensitive materials such as quartz. The 3D characterization of the dislocation microstructure allows the evaluation of contributions to dislocation mobility with no ambiguity. From the geometrical characteristics of the dislocations and their Bur-gers vectors, we show how to identify the non-zero components of the strain tensor. We show that in the quartz grain investigated, the von-Mises-Taylor criterion is satisfied thanks to the climb of 〈c + a〉 dislocations.
1. Introduction
The book of Nicolas and Poirier (1976) “Crystalline Plasticity and Solid State Flow in Metamorphic Rocks” has represented a milestone in transferring metallurgical knowledge to structural geology. Despite the complexities of crystal structure of minerals and compositional variation of minerals and rocks, their plastic deformation, like metals, involves the motion of crystal defects. In naturally deformed samples, microstruc-tures are often the only record left by past tectonic events and their detailed study is essential to decipher the thermomechanical history experienced by the rocks. Compared to metals, often of cubic symmetry, most minerals exhibit low crystallographic symmetry, which in turn allows only a limited number of slip systems to be activated (Barber et al. 2010). According to the Von Mises-Taylor criterion (von Mises 1928; Taylor 1938), at least five independent slip systems must operate to satisfy the conditions of continuity of displacement at crystal boundaries and accommodate an arbitrary imposed deformation. This criterion can be relaxed to four slip systems if strain is inhomogeneous and only local accommodation is required (Hutchinson 1977; Nebozhyn et al., 2000; Detrez et al. 2015; Castelnau et al. 2020). Nevertheless the Von Mises- Taylor criterion is not satisfied in many minerals and other deforma-tion mechanisms such as crack opening, fricdeforma-tional sliding, kinking,
twinning, dislocation climb, high-temperature grain boundary sliding, or diffusion creep may be necessary to deform polycrystalline rocks (Groves and Kelly 1969). Here, we propose a novel approach based on a detailed characterization of a dislocation microstructure by tomography in transmission electron microscopy (TEM) to assess its capability of achieving an arbitrary imposed deformation. In this study, quartz will be used as a case study to illustrate the methodology that we introduce.
In quartz, dislocations were first evidenced by Willis (1952) from growth spirals on a surface. Evidence for basal slip was first reported by Christie et al. (1964). In this trigonal structure, basal glide involves three 1/3〈1120〉slip directions referred to as 〈a〉 (Ba¨eta and Ashbee 1969). Blacic (1975) reports, as a function of increasing temperature, a tran-sition from 〈a〉 -basal to [0001] (〈c〉) prismatic ({m}) {1010}glide. Ball and White (1978) pointed the apparent difficulty of satisfying the von Mises criterion for general plasticity by activation of 〈a〉 -basal and 〈c〉 -prismatic glide alone. In particular, with these slip systems, strains parallel to the [0001] axis cannot be produced in any single grain in response to imposed stresses. They proposed that the deformation of quartzite in the crust involves activation of dislocation climb to allow general plasticity of the polycrystalline aggregate. This fundamental limitation can also be solved by activation of 〈c + a〉 glide involving * Corresponding author at: Univ. Lille, CNRS, INRAE, Centrale Lille, UMR 8207 - UMET – Unit´e Mat´eriaux et Transformations, F-59000 Lille, France.
E-mail address: patrick.cordier@univ-lille.fr (P. Cordier).
dislocations with 1/3〈1123〉Burgers vectors. Evidence for activation of 〈c + a〉 glide was first reported by Ba¨eta and Ashbee (1969) and further confirmed by TEM by Trepied and Doukhan (1982) in quartz single crystals compressed along the [0001] axis at temperatures above 973 K. Activation of slip systems induces crystal preferred orientations in rocks (Nicolas and Poirier 1976) which can be linked to seismic anisotropy (Mainprice and Nicolas 1989). This direction of research has been very active in the last decades, with the development of EBSD measurements and Visco-Plastic Self-Consistent (VPSC) models. Surprisingly, in these studies, the role of 〈c + a〉 glide has only been marginally considered. Alternatively, a number of models have been based on a succession of slip systems with increasing temperature, 〈a〉-glide is successively acti-vated in the easy basal plane, and then in the rhombohedral planes (acute rhombs π
{
1012} and π′
{
0112}, and positive r{1011} and negative z{0111}rhombs) followed by 〈a〉 -prismatic (m{1010}) and finally 〈c〉 -prismatic (see Morales et al. 2011; Keller and Stipp 2011; Morales et al. 2014). However, the activation of those planes does not solve the von Mises-Taylor criterion issue raised by Ball and White (1978). Looking beyond the activation of slip systems, activation of climb (as suggested by Ball and White (1978)) is not the only alternative. Violation of the von Mises-Taylor criterion leads to stress concentration at the grain boundaries which can be released by crack opening or activation of grain boundary sliding. Activation of grain boundary sliding in quartz had been proposed in quartz-rich rocks by Fliervoet et al. (1997), Rutter and Brodie (2004), Fukuda et al. (2018) and Tokle et al. (2019). Microstructural evidence for the activation of grain boundary sliding is difficult to established as demonstrated by recent studies of Maruyama and Hiraga (2017), Quintanilla-Terminel et al. (2017) and Bollinger et al. (2019).
In the present study, we show that the validity of the von Mises- Taylor criterion can be assessed from a detailed, 3D, characterization of the dislocation microstructure since the kinematics of glide is fully determined from a dislocation’s geometry (knowing its Burgers vector). Our approach is presented in the “Theory” section of this paper. Con-ventional TEM usually provides 2D projections of the dislocation microstructure which is not sufficient to determine the slip plane. 3D dislocations structures can be reconstructed by tomography as first demonstrated by Barnard et al. (2006) (see a recent review on this technique by Feng et al. (2020)). The strong sensitivity of quartz to electron irradiation (see for instance Fig. 2 of Barber et al. 2010) is however a limitation to perform electron tomography which usually involves long acquisition of image series at varying tilt. In Section 2, we propose a novel method to perform electron tomography with few projected images which extends this technique to beam-sensitive ma-terials. In Section 3, we show how the strain components produced by the dislocation microstructure can be calculated from the elements characterized in electron microscopy (dislocation geometry, Burgers
vector). The results presented in Section 4 are analyzed in Section 5 in the light of the ability of the observed microstructure to produce a general deformation in the grain. We conclude with some perspectives offered by this work toward more quantitative studies.
2. Materials and Methods 2.1. Specimen
Here we characterize dislocation microstructures in quartz grains from a Bohemian (Czech Republic) granulite. The specimen was me-chanically polished down to a thickness of 30 μm, then ion milled with
Ar-ions to achieve electron transparency. A thin carbon layer was deposited to ensure electron conduction on the thin-foil. An example of typical dislocation microstructure is shown in Fig. 1.
2.2. Transmission electron microscopy
TEM analyses were conducted with a FEI® Tecnaï G2–20 Twin
mi-croscope operating at 200 kV with a LaB6 filament, associated with a
“Spinning Star” precession module (Vincent and Midgley 1994) from the Nanomegas Company. Electron tomography has been performed by acquiring tilt series with a double tilt sample-holder in diffraction contrast imaging mode. The crystal of interest is oriented so as to identify a diffraction vector with a high structure factor to produce well- contrasted images. Here we use g: 1101 which belongs to the family of diffraction vectors with the highest structure factor in quartz. Imaging is performed in the weak-beam dark-field (WBDF) mode to keep a high signal to noise ratio. In these conditions background contrasts are het-erogeneous because of the occurrence of thickness fringes. Also, the contrast of dislocations inclined in the thin foil oscillates. In order to get homogeneous contrast for both background and dislocations, we have induced a precession of the electron beam (Rebled et al. 2011; Mussi et al. 2014; Mussi et al. 2015a, b; Mussi et al. 2017) with a precession angle of 0.1◦ to ensure that the electron beam is not masked by the
objective aperture (necessary to reveal dislocation contrasts). Electron tomography of dislocations requires a perfect alignment of the diffrac-tion vector along the sample-holder principal axis, in order to keep the dislocation contrast constant all over the tilt series acquisitions. Following accurate tilt series alignments (with spatial precision better than 5 nm) dislocation tomography reconstructions are obtained using the weighted back-projection (WBP) algorithm (Herman et al. 1976) accessible on the TomoJ plugin (Messaoudi et al. 2007) from the free ImageJ software. Reconstruction algorithms are aimed at transforming a tilt series into a stack. The determinations of dislocation position in reconstructed volumes are accurate in the sample-holder accessible angular range (interpolation calculation of the algorithm); however they are less accurate in the missing-wedge (extrapolation calculation of the algorithm). Consequently, reconstructed dislocation thicknesses are thin in the sample-holder accessible angular range and thick in the missing- wedge, so their geometries take the form of ribbons. To improve the reconstructed volume qualities, dislocations have been directly redrawn into the volumes using the free UCSF Chimera software (Pettersen et al. 2004; Liu et al. 2014; Mussi et al. 2016; Mussi et al. 2017).
Burgers vector indexing is performed using the thickness fringe method developed by Ishida et al. (1980). This technique consists of counting the number of thickness fringes that end on the dislocation terminations. This number corresponds to the g.b scalar product where g is the diffraction vector and b the Burgers vector. Even if this method is underused by the community of TEM users (Wiezorek et al. 1997; Miyajima and Walte 2009), it is useful to characterize the Burgers vec-tors of materials sensitive to electron beam as it considerably limits the WBDF micrograph acquisition number.
Fig. 1. Typical dislocation microstructure obtained in kinematical bright field condition with the 1101 diffraction vector.
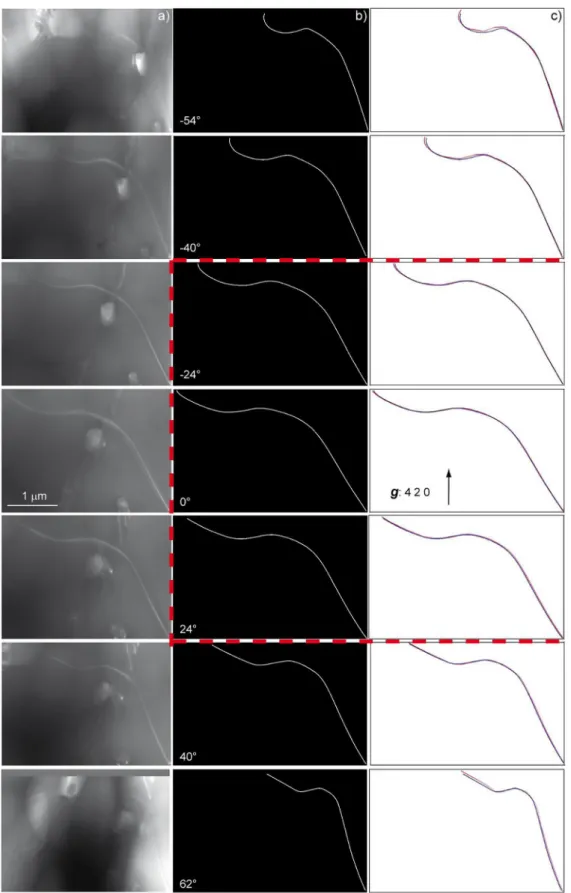
Fig. 2. Reconstruction method for few projected images in garnet. a) Seven projected micrographs (projection angles of − 54◦, − 40◦, − 24◦, 0◦, 24◦, 40◦and 62◦)
extracted from the raw aligned tilt series obtained in WBDF conditions with the 420 diffraction vector and a precession angle of 0.1◦; b) corresponding projected
micrographs redrawn in black and white contrast; c) superposition of projected images extracted from the reconstructed volume (in red) and the redrawn micro-graphs of Fig. 2b (in blue), where the reconstructed volume has been obtained using only 4 redrawn micrographs for projection angles of − 24◦, − 8◦, 8◦and 24◦. The
projected images extracted from the reconstruction volume accurately fit the original micrographs even for high projection angles. (For interpretation of the ref-erences to colour in this figure legend, the reader is referred to the web version of this article.)
2.3. Tomography with few projected images and low angular ranges
To determine the best working conditions to perform electron to-mography on specimens sensitive to electron beam, a tilt series from a previous study has been used. This tilt series was acquired on a deformed garnet sample which is less sensitive to irradiation damage. It was ac-quired every 2◦ from − 54◦to 62◦. Reconstructing a good quality 3D
dislocation microstructure with few projected images and a low angular range requires favorable reconstruction conditions. That is why we decided to analyze only a few dislocations that are not far from the tilt axis, so that reconstruction algorithm extrapolations can be minimized. The dislocations of each projected images have been redrawn to ensure a black and white contrast, since discrete 3D reconstructions give access to better quality volumes than continuous grey level reconstructions (Batenburg and Sijbers 2011). Fig. 2a and b show 7 raw and redrawn projected images among the 59 projected images of the tilt series. An electron tomography volume has been reconstructed with only 4 redrawn projected images and an angular range of only +/− 24◦, i.e.
projection angles (angles between the normal of the thin foil and the electron beam direction for a specific tilt angle) of − 24◦,-8◦, 8◦and 24◦
(red rectangle with dotted lines in Fig. 2). Then, the reconstructed dis-locations are redrawn into the reconstructed volume using Chimera software (Liu et al. 2014; Mussi et al. 2016; Mussi et al. 2017). Fig. 2c reveals small deviations between the positions of the redrawn recon-structed dislocations and the redrawn dislocations of projected images (approximately the dislocation thicknesses) even for high projected angles such as − 54◦ and 62◦. Consequently, we conclude that
tomo-graphic reconstructions performed near tilted axes with dislocation micrographs redrawn in black and white reflect real dislocation micro-structures for only 4 projected images and a low angular range of only 48◦(+/− 24◦).
3. Theory: Inferring strain(¡rate) components from dislocation geometry
3.1. Dislocation glide
A dislocation with a Burgers vector b gliding on a plane with normal ng (index “g” stands for glide) produces a shear proportional to tensor b
⊗ng or equivalently to ̂b ⊗ ̂ng with ̂b and ̂ng the unit vectors parallel to b and ng. Here, ⊗ is the dyadic product (the dyadic product of two vectors ̂
a and ̂b is a second order tensor A̿ with component Aij =aibj). To express the associated symmetric strain tensor, one defines the Schmid tensor S̿ g:
S̿ g =1 2 ( ̂b ⊗ ̂ng+ ̂ ng⊗ ̂b ) Sg ij= 1 2 ( bingj+bjngi )
which is symmetric and traceless, i.e. S11g +S22g +S33g =0 since ̂b and ̂ng are orthogonal. Plastic deformation due to dislocation glide is isochoric. Therefore, S̿ g has only five independent components, for example S11g ,
S22g , S23g , S12g and S13g .
3.2. Dislocation climb
Climb is the non-conservative displacement of a dislocation outside its glide plane due to the absorption or emission of point defects. It concerns only non-screw dislocations, i.e. when dislocations with a Burgers vector has a non-zero edge component. The climb of an edge dislocation produces a normal strain (Lebensohn et al. 2010; Yuan et al. 2018) along the direction of the Burgers vector, i.e. a strain tensor proportional to: S̿ c = ̂b ⊗ ̂b Sc ij=bibj 4. Results
To reduce electron beam irradiation effects, a small condenser aperture (100 μm in diameter) and a small spot size (11.3 nm in
diam-eter) are used. Pixels have been gathered four by four to intensify the contrast by a factor 16 without increasing the electron dose. Contrast adjustments are performed in the vicinity of the zones of interest and analyses are performed as quickly as possible to minimize beam damage. Each tilt series is composed of four WBDF micrographs acquired with a small precession angle, an exposure time of 20s and projection angles of − 30◦, − 10◦, 0◦and 25◦respectively (these projection angles are chosen
to avoid the dynamic contrasts of zone axes). An example of Burgers vector indexing is described on Fig. 3 for the dislocation 1A (Table 1). Two thickness fringes end on the dislocation for a 1011 diffraction vector (small black arrow on Fig. 3a), no interaction is observed for g = 1100 (Fig. 3b), one fringe ends on the dislocation for a 1101 diffraction vector (Fig. 3c), and one for 1101 (Fig. 3d). We can conclude that the Burgers vector of this dislocation is 1/3[1123].
Then we perform tilt series alignments in several small zones where the Burgers vectors of dislocations have been indexed. We use nano-metric dislocation loops near the studied dislocations (see the small white arrow on Fig. 3a) as reference points to perform accurate tilt series alignments. After alignments, the dislocations of interest have been redrawn in white with a black background (Fig. 4b), then the dislocation Fig. 3. Dislocation 1A (see Table 1). Burgers vector indexing by the thickness fringe method (Ishida et al. 1980). a) WBDF micrograph obtained with g: 1011 (projection angle of 41.5◦) showing a dislocation where g.b = ± 2 (small black
arrow), a small dislocation loop of approximately 9 nm in diameter is indicated by a small white arrow; b) WBDF micrograph obtained with g: 1100 (projection angle of − 21.0◦) showing a dislocation where g.b = 0 (small black arrow); c)
WBDF micrograph obtained with g: 1101 (projection angle of 0◦) showing a
dislocation where g.b = ± 1 (small black arrow); d) WBDF micrograph obtained with g: 1101 (projection angle of − 28.5◦) showing a dislocation where g.b = ±
1 (small black arrow). These four diffraction conditions are characteristic of a 1/3[1123]Burgers vector.
microstructures have been reconstructed with the WBP algorithm (Herman et al. 1976) and finally the resulting 3D dislocations have been directly redrawn in the volume (Fig. 4c) using the Chimera software (Liu et al. 2014; Mussi et al. 2016; Mussi et al. 2017). The complete dislo-cation reconstruction corresponding to Fig. 3 is presented on Fig. 4. From Fig. 4d, with a projection angle of − 12◦, the black dislocation
segment projection appears rectilinear which suggests that the plane which contains this dislocation segment is edge-on. Knowing the thin foil orientation, it is possible to characterize this plane which is (0116), at approximately 12◦from the (0001) plane. Similarly, two other planes,
(
3253)and (3121)can be characterized for this dislocation, for pro-jection angles of 46◦ and 85◦ respectively. Dislocation 1A, with the
Burgers vector 1/3[1123] appears to exhibit a complex three- dimensional configuration, with no segment in glide configuration.
Fig. 5 shows the characterization of a [0001] dislocation shown along several projection angles. From Fig. 5e and j, the projections of this dislocation appear rectilinear with tilt angles of -57◦ and 123◦
respectively. Therefore, this dislocation is located in (3148). The normal of this plane is at a 30◦angle to the Burgers vector, i.e. it is not a
glide configuration.
Fig. 6 describes the geometry of a 1/3[2110]dislocation (2C). This is the most commonly indexed Burgers vector of dislocations determined in our study, see Table 1. Here again, the geometry is 3D. This dislo-cation can be subdivided into four segments (in blue, light blue, black and grey colors respectively), each contained in a specific habit plane (Fig. 6). Two of them are prismatic planes: (1100)and (1010)plane which do not contain the Burgers vector. The black and the grey seg-ments belong to the (1 2 3 11)and (3128)planes respectively (Fig. 6b, e, h and i). Except for (1 2 3 11)which is slightly ambiguous, all seg-ments depart significantly from glide configuration. A similar conclu-sion can be drawn for any other 1/3[2110]dislocation characterized (Table 1).
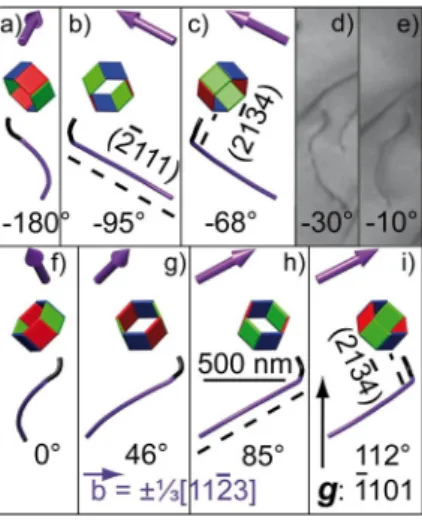
Fig. 7 shows the only unambiguous case for a glide configuration found in this study (dislocation 3E, Table 1). This dislocation has a 1/ 3[1123]Burgers vector. It is composed of 2 segments: a black segment whose projection appears rectilinear for a tilt angle of − 68◦(Fig. 7c) and
a purple segment whose projection is rectilinear for a tilt angle of +85◦
(Fig. 7h). The purple segment is in glide configuration in the (2111), the second order pyramidal plane. The dislocation is, however, not purely in a glide configuration since the black segment (although its plane is not determined precisely), deviates significantly from the glide plane.
Table 1 summarizes all characterizations. It must be noted that this sampling does not capture all dislocations in the area studied. Since tomography is performed only for an individual diffraction vector g =(
1101), some dislocations (e.g. 1/3[1120],1/3
[
1213]and 1/3[2113]) are out of contrast. No conclusion can be drawn for these dislocations.
5. Discussion and conclusion
Several facts emerge from this study which cannot be drawn without a detailed characterization. Firstly, all potential Burgers vectors of the quartz structure have been characterized i.e. <a>, [c] and < c + a>. This probably results from a deformation occurring at high temperature since this sample went through the granulite facies. All dislocations exhibit rather complex 3D configurations. Two processes lead to 3D dislocation microstructures: cross-slip and climb. Here tomography al-lows us to exclude cross-slip as the most prevalent process, since dislo-cation segments in glide configurations are almost never found. Climb is a major process acting in this specimen. This is consistent with the observation of several sub-grain boundaries. From our study, we can derive all parameters which are necessary to infer the strain components produced by the dislocations characterized either by glide (in the only occurrence observed: dislocations 3E) or by climb. Based on these results and theory presented in Section 3, we can report which dislocation provides a non-zero contribution for each component of the strain tensor:
Table 1
Summary of dislocation characterizations where we report the occurrence of the planes containing some segments of the dislocations (see figures). The angle between the Burgers vector b and the normal of those planes is reported in the last column. In some cases, determination of those planes is imprecise when their projection is horizontal (*) or when the segments are very short (**); their values are given to provide an estimation of the angle between the planes and the Burgers vectors.
Dislocation (Burgers vector b) Segment Lying planes (Normal n) (̂n, b) 1/3[2110]dislocations 03B (3253) 58◦ 05B 1 (1103) 70◦ 2 (3253) 58◦ 5B 1 (3253)** 58◦ 2 (1120) 60◦ 3 (1101)* 47◦ 4 (10 1 11 5) 40◦ 5 (1120) 60◦ 6 (3148) 69◦ 2H 1 (3301) 33◦ 2 (3301) 33◦ 1C 1 (3142) 49◦ 2 (1101) 47◦ 2C 1 (1 2 3 11) 85◦ 2 (1100) 30◦ 3 (1010) 30◦ 4 (3128) 68◦ 3I 1 (1 3 2 17) 86◦ 2 (1341) 76◦ [0001] dislocations 1D 1 (1101)* 52◦ 2 (1011)** 52◦ 3 (1101)** 52◦ 4 (3631) 81◦ 2B (3148) 30◦ 1/3[1123]dislocations 1A 1 (3121) 51◦ 2 (3253) 20◦ 3 (0116) 32◦ 1B (2243) 82◦ 1/3[1123]dislocation 3E 1 (2111) 90◦ 2 (2134)** 11◦
The above expression is given in a reference frame with the x-axis taken parallel to the crystallographic direction [a1] of the quartz lattice,
and the z-axis parallel to direction [c]. The glide of dislocation 3E (c-a3)
fills five components of the strain tensor, but since these components are all proportional to each other (due to a single slip system), the dislo-cation 3E only provides one independent system. Using the method described in Castelnau et al. (2020), one can also show that four ponents of the climb strain tensor are independent. As these are com-plementary to those due to glide, the combination of glide and climb satisfies the five necessary systems of the von Mises-Taylor criterion. The striking observation is that, from our non-exhaustive characterization, one is able to conclude that the dislocation microstructure is sufficient to produce a general deformation since all components of the strain tensor are non-zero and independent. In the literature, it has usually been assumed that the von Mises-Taylor criterion is satisfied by climb (implied by <a > or [c] dislocations) or by <c + a > glide. We find here a completely different situation where <c + a > climb is critical to
ensure general deformation.
6. Perspectives
The present study demonstrates that electron tomography can be applied successfully to a beam-sensitive mineral such as quartz. We show that the simultaneous determination of all characteristics of dis-locations (i.e. the Burgers vector and the line geometry) provide crucial information on the deformation mechanisms at play. Such a character-ization is beyond standard observation at the TEM since sample-holder tilt places limitations on determinations of critical imaging information. The electron tomography reconstruction can be used to overcome these physical limitations and to examine the dislocation geometry from all orientations. In the present study which is only a proof of concept, the conclusions presented are only semi-quantitative since we only identify the non-zero strain components. Developments toward a quantitative determination of the components of the strain tensor are, in principle, possible since the results of our calculations could be weighted by the Fig. 4. Reconstruction method for few projected images of Fig. 3 dislocation 1A whose Burgers vector is 1/3[1123]. a) Four aligned projected micrographs (projection angles of − 30◦, − 10◦, 0◦and 25◦) obtained in WBDF conditions with
the 1101 diffraction vector and a precession angle of 0.1◦; b) corresponding
redrawn projected micrographs in black and white contrast; c) superimposed of projected images extracted from the reconstructed volume (in blue) and the redrawn micrographs of Fig. 3b (in red); d) Projected images extracted from the reconstructed volume for eight projected angles, where the (3253) plane is edge-on for the projected angles of 46◦, the (3121)plane is edge-on for the
projected angles of 85◦and the (0116)plane is edge-on for the projected angles
of − 12◦. This reconstruction gives us the opportunity to characterize three
mixed climb systems: ±1/3[1123](3121), ±1/3[1123](3253) and ±1/3
[
1123](0116)(in grey, black and grey respectively), for the same dislo-cation. The crystal orientation is materialized by the colored hexagonal prism and the Burgers vector is shown by the blue arrow. (For interpretation of the references to colour in this figure legend, the reader is referred to the web version of this article.)
ε̿ = ⎛ ⎜ ⎜ ⎜ ⎜ ⎜ ⎜ ⎝ { c − a3 } { c − a3 } { c − a3 } { } { c − a3 } { c − a3 } ⎞ ⎟ ⎟ ⎟ ⎟ ⎟ ⎟ ⎠ glide + ⎛ ⎜ ⎜ ⎜ ⎜ ⎜ ⎜ ⎝ { a1 c + a3 c − a3 } { c + a3 c − a3 } { c + a3 c − a3 } { c + a3 c − a3 } { c + a3 c − a3 } { c c + a3 c − a3 } ⎞ ⎟ ⎟ ⎟ ⎟ ⎟ ⎟ ⎠ climb
Fig. 6. Electron tomography reconstruction for dislocation (shown in d), with a 1/3[2110]Burgers vector (shown by the green arrow), obtained with the 1101 diffraction vector: pro-jected angle of a) -95◦; b) -39◦; c) -25◦; d) -10◦; e) -3◦; f) 46◦; g)
85◦; h) 141◦; and i) 177◦. The
(
1100)plane containing the blue dislocation segment is edge-on for a projection angle of −25◦; the
(
1010)plane containing the light blue dislocation segment is edge-on for a projection angle of − 95◦and a
pro-jection angle of 85◦; the plane containing the black dislocation
segment is edge-on for a projection angle of − 39◦and a
pro-jection angle of 141◦; and the plane containing the grey
dislocation segment is edge-on for a projection angle of − 3◦
and a projection angle of 177◦. (For interpretation of the
ref-erences to colour in this figure legend, the reader is referred to the web version of this article.)
Fig. 5. Electron tomography reconstruction for a [0001] dislocation (2B), obtained with the 1101 diffraction vector, and shown in a) and f). Projected angle of a) -30◦; b) -180◦; c) -134◦; d) -95◦; e) -57◦; f) 25◦; g) 0◦; h) 46◦; i) 85◦; and j) 123◦. The plane containing the dislocation is edge-on for a projection angle of − 57◦and a
projection angle of 123◦. The [0001] Burgers vector is represented by the red arrow. (For interpretation of the references to colour in this figure legend, the reader is
dislocation line length (which is accessible from tomographic study). To be relevant, such study should ensure that all dislocations present in the grain are in contrast and analyzed. The only limitation will then be the sampling which is always a difficulty in the TEM. This can however be achieved if the grains are small enough to be fully characterized.
Author contributions
AM and PC designed the study, AM performed the TEM in-vestigations. AM post-treated and analyzed the data with JG. OC per-formed the theoretical analysis. AM, OC and PC wrote the original draft.
Funding
This work was supported by the European Research Council under the European Union’s Horizon 2020 research and innovation program under grant agreement 787198 – TimeMan to Patrick Cordier.
Declaration of Competing Interest
None.
Acknowledgements
The TEM national facility in Lille (France) is supported by the Conseil Regional du Nord-Pas de Calais, the European Regional Development Fund (ERDF), and the Institut National des Sciences de l’Univers (INSU, CNRS). This project has received funding from the European Research Council (ERC) under the European Union’s Horizon 2020 research and innovation program under grant agreement 787198 – TimeMan. We thank A.K. Kronenberg and an anonymous reviewer for constructive comments.
References
Ba¨eta, R.D., Ashbee, K.H.G., 1969. Slip systems in quartz: I experiments. Am. Mineral. 54, 1551–1573.
Ball, A., White, S., 1978. On the deformation of quartzite. Phys. Chem. Miner. 3, 163–172. https://doi.org/10.1007/BF00308119.
Barber, D.J., Wenk, H.-R., Hirth, G., Kohlstedt, D.L., 2010. Dislocations in minerals. Disloc. Solids 16, 171–232. https://doi.org/10.1016/S1572-4859(09)01604-0. Barnard, J.S., Sharp, J., Tong, J.R., Midgley, P.A., 2006. High-resolution three-
dimensional imaging of dislocations. Science 313, 319. https://doi.org/10.1126/ science.1125783.
Batenburg, K.J., Sijbers, J., 2011. DART: a practical reconstruction algorithm for discrete tomography. IEEE Trans. Image Process. 20, 2542–2553. https://doi.org/10.1109/ TIP.2011.2131661.
Blacic, J.D., 1975. Plastic deformation mechanisms in quartz: the effect of water. Tectonophysics 27, 271–294. https://doi.org/10.1016/0040-1951(75)90021-9. Bollinger, C., Marquardt, K., Ferreira, F., 2019. Intragranular plasticity vs. grain
boundary sliding (GBS) in forsterite: microstructural evidence at high pressures (3.5–5.0 GPa). Am. Mineral. 104, 220–231. https://doi.org/10.2138/am-2019- 6629.
Castelnau, O., Derrien, K., Ritterbex, S., Carrez, P., Cordier, P., Moulinec, H., 2020. Multiscale modeling of the effective viscoplastic behavior of Mg2SiO4 wadsleyite:
bridging atomic and polycrystal scales. C. R. M´ecanique 348, 827–846. https://doi. org/10.5802/crmeca.61.
Christie, J.M., Griggs, D.T., Carter, N.L., 1964. Experimental evidence of Basal Slip in Quartz. J. Geol. 72, 734–756. https://doi.org/10.1086/627030.
Detrez, F., Castelnau, O., Cordier, P., Merkel, S., Raterron, P., 2015. Effective viscoplastic behavior of polycrystalline aggregates lacking four independent slip systems inferred from homogenization methods; application to olivine. J. Mech. Phys. Solids 83, 199–220. https://doi.org/10.1016/j.jmps.2015.05.022.
Feng, Z., Fu, R., Lin, C., Wu, G., Huang, T., Zhang, L., Huang, X., 2020. TEM-based dislocation tomography: challenges and opportunities. Curr. Opin. Solid State Mater. Sci. https://doi.org/10.1016/j.cossms.2020.100833.
Fliervoet, T., White, S., Drury, M.R., 1997. Evidence for dominant grain-boundary sliding deformation in greenschist-and amphibole-grade polymineralic ultra mylonites from the Redbank Deformed Zone, Central Australia. J. Struct. Geol. 19, 1495–1520.
https://doi.org/10.1016/S0191-8141(97)00076-X.
Fukuda, J.-I., Holyoke III, C.W., Kronenberg, A.K., 2018. Deformation of fine-grained quartz aggregates by mixed diffusion and dislocation creep. J. Geophys. Res. Solid Earth 123, 4676–4696. https://doi.org/10.1029/2017JB015133.
Groves, G.W., Kelly, A., 1969. Change of shape due to dislocation climb. Philos. Magaz. A 19, 977–986. https://doi.org/10.1080/14786436908225862.
Herman, G.T., Lakshminarayanan, A.V., Naparstek, A., 1976. Convolution reconstruction techniques for divergent beams. Comput. Biol. Med. 6, 259–271. https://doi.org/ 10.1016/0010-4825(76)90065-2.
Hutchinson, J.W., 1977. Creep and plasticity of hexagonal polycrystals as related to single crystal slip. Met. Trans. A. 8, 1465–1469. https://doi.org/10.1007/ BF02642860.
Ishida, Y., Ishida, H., Kohra, K., Ichinose, H., 1980. Determination of the Burgers vector of a dislocation by weak-beam imaging in a HVEM. Philos. Mag. A 42 (1980), 453–462. https://doi.org/10.1080/01418618008239369.
Keller, L.M., Stipp, S., 2011. The single-slip hypothesis revisited: Crystal-preferred orientations of sheared quartz aggregates with increasing strain in nature and numerical simulation. J. Struct. Geol. 33, 1491–1500. https://doi.org/10.1016/j. jsg.2011.07.008.
Lebensohn, R.A., Hartley, C.S., Tome, C.N., Castelnau, O., 2010. Modelling the mechanical response of polycrystals deforming by climb and glide. Philos. Mag. 90 (5), 567–583. https://doi.org/10.1080/14786430903213320.
Liu, G.S., House, S.D., Kacher, J., Tanaka, M., Higashida, K., Robertson, I.M., 2014. Electron tomography of dislocation structures. Mater. Charact. 87, 1–11. https://doi. org/10.1016/j.matchar.2013.09.016.
Mainprice, D., Nicolas, A., 1989. Development of shape and lattice preferred orientations: application to the seismic anisotropy of the lower crust. J. Struct. Geol. 11, 175–189. https://doi.org/10.1016/0191-8141(89)90042-4.
Maruyama, G., Hiraga, T., 2017. Grain- to multiple-grain-scale deformation processes during diffusion creep of forsterite + diopside aggregate: 1. Direct observations. J. Geophys. Res. Solid Earth 122, 5890–5915. https://doi.org/10.1002/ 2017JB014254.
Messaoudi, C., Boudier, T., Sanchez Sorzano, C.O., Marco, S., 2007. Tomoj: Tomography software for three-dimensional reconstruction in transmission electron microscopy. BMC Bioinform. 8, 288. https://doi.org/10.1186/1471-2105-8-288.
Miyajima, N., Walte, N., 2009. Burgers vector determination in deformed perovskite and post-perovskite of CaIrO3 using thickness fringes in weak-beam dark-field images.
Ultramicroscopy 109, 683–692. https://doi.org/10.1016/j.ultramic.2009.01.010. Morales, L.F.G., Mainprice, D., Lloyd, G.E., Law, R.D., 2011. Crystal fabric development
and slip systems in a quartz mylonite: an approach via transmission electron microscopy and viscoplastic self-consistent modelling. In: Prior, David J., Rutter, Ernest H., Tatham, Daniel J. (Eds.), Deformation Mechanisms, Rheology and Tectonics: Microstructures, Mechanics and Anisotropy, pp. 151–174. https://doi. org/10.1144/SP360.9.
Morales, L.F.G., Lloyd, G.E., Mainprice, D., 2014. Fabric transitions in quartz via viscoplastic self-consistent modeling part I: axial compression and simple shear under constant strain. Tectonophysics 636, 52–69. https://doi.org/10.1016/j. tecto.2014.08.011.
Fig. 7. Electron tomography reconstruction for dislocation 3E (shown in d,e), with a 1/3[1123]Burgers vector (shown by the purple arrow), obtained with the 1101 diffraction vector: projected angle of a) -180◦; b) -95◦; c) -68◦; d) -30◦;
e) -10◦; f) 0◦; g) 46◦; h) 85◦; and i) 112◦. The (2111)2nd order pyramidal glide
plane of the purple dislocation segment is edge-on for a projection angle of − 95◦and a projection angle of 85◦; and the plane containing the black
dislo-cation segment is edge-on for a projection angle of − 68◦and a projection angle
of 112◦. (For interpretation of the references to colour in this figure legend, the
Mussi, A., Cordier, P., Demouchy, S., Vanmansart, C., 2014. Characterization of the glide planes of the [001] screw dislocations in olivine using electron tomography. Phys. Chem. Miner. 41, 537–545. https://doi.org/10.1007/s00269-014-0665-1. Mussi, A., Cordier, P., Demouchy, S., 2015a. Characterization of dislocation interactions
in olivine using electron tomography. Philos. Mag. 95, 335–345. https://doi.org/ 10.1080/14786435.2014.1000996.
Mussi, A., Nafi, M., Demouchy, S., Cordier, P., 2015b. On the deformation mechanism of olivine single crystals at lithospheric temperatures: an electron tomography study. Eur. J. Mineral. 27, 707–715. https://doi.org/10.1127/ejm/2015/0027-2481. Mussi, A., Cordier, P., Ghosh, S., Garvik, N., Nzogang, B.C., Carrez, P., Garruchet, S.,
2016. Transmission electron microscopy of dislocations in cementite deformed at high pressure and high temperature. Philos. Mag. 96, 1773–1789. https://doi.org/ 10.1080/14786435.2016.1177670.
Mussi, A., Cordier, P., Demouchy, S., Hue, B., 2017. Hardening mechanisms in olivine single crystal deformed at 1090 ◦C: an electron tomography study. Philos. Mag. 97,
3172–3185. https://doi.org/10.1080/14786435.2017.1367858.
Nebozhyn, M.V., Gilormini, P., Ponte Casta˜neda, P., 2000. Variational self-consistent estimates for viscoplastic polycrystals with highly anisotropic grains. Comptes Rendus M´ecanique 328, 11–17. https://doi.org/10.1016/S1287-4620(00)88410- 0 no. Ser. IIb.
Nicolas, A., Poirier, J.P., 1976. Crystalline Plasticity and Solid State Flow in Metamorphic Rocks. J. Wiley and Sons, London.
Pettersen, E.F., Goddard, T.D., Huang, C.C., Couch, G.S., Greenblatt, D.M., Meng, E.C., Ferrin, T.E., 2004. UCSF Chimera: a visualization system for exploratory research and analysis. J. Comput. Chem. 25, 1605–1612. https://doi.org/10.1002/jcc.20084. Quintanilla-Terminel, A., Zimmerman, M.E., Evans, B., Kohlstedt, D.L., 2017. Microscale and nanoscale strain mapping techniques applied to creep of rocks. Solid Earth 8, 751–765. https://doi.org/10.5194/se-8-751-2017.
Rebled, J.M., Yedra, L., Estrade, S., Portillo, J., Peiro, F., 2011. A new approach for 3D reconstruction from bright field TEM imaging: Beam Precession Assisted Electron Tomography. Ultramicroscopy 111, 1504–1511. https://doi.org/10.1016/j. ultramic.2011.06.002.
Rutter, E.H., Brodie, K.H., 2004. Experimental grain size-sensitive flow of hot-pressed Brazilian quartz aggregates. J. Struct. Geol. 26, 2011–2023. https://doi.org/ 10.1016/j.jsg.2004.04.006.
Taylor, G.I., 1938. Plastic strain in metals. J. Inst. Met. 62, 301–324. Earth and Planetary Science Letters.
Tokle, L., Hirth, G., Behr, W.M., 2019. Flow laws and fabric transitions in wet quartzite. Earth Planet. Sci. Lett. 505, 152–161. https://doi.org/10.1016/j.epsl.2018.10.017. Trepied, L., Doukhan, J.C., 1982. Evidence of 〈a + c〉 dislocations in synthetic quartz
single crystals compressed along the c axis. Bull. Mineral. 105 (2), 176–180. https:// doi.org/10.3406/bulmi.1982.7601.
Vincent, R., Midgley, P.A., 1994. Double conical beam-rocking system for measurement of integrated electron diffraction intensities. Ultramicroscopy 53, 271–282. https:// doi.org/10.1016/0304-3991(94)90039-6.
von Mises, R., 1928. Mechanik der plastischen Form¨anderung von Kristallen. Z. für Angew. Math. Mech 8, 161–185. https://doi.org/10.1002/zamm.19280080302. Wiezorek, J.M.K., Humphreys, C.J., Fraser, H.L., 1997. Determining directly from
experiment the magnitude of the Burgers vector of glissile component dislocations in Ti3Al. Philos. Mag. Lett. 75, 281–289. https://doi.org/10.1080/095008397179534.
Willis, B., 1952. Screw dislocations in quartz. Nature 170, 115–116. https://doi.org/ 10.1038/170115a0.
Yuan, S., Huang, M., Zhu, Y., Li, Z., 2018. A dislocation climb/glide coupled crystal plasticity constitutive model and its finite element implementation. Mech. Mater. 118, 44–61. https://doi.org/10.1016/j.mechmat.2017.12.009.

![Fig. 5 shows the characterization of a [0001] dislocation shown along several projection angles](https://thumb-eu.123doks.com/thumbv2/123doknet/7328586.211364/6.892.59.430.198.889/fig-shows-characterization-dislocation-shown-projection-angles.webp)

![Fig. 5. Electron tomography reconstruction for a [0001] dislocation (2B), obtained with the 1101 diffraction vector, and shown in a) and f)](https://thumb-eu.123doks.com/thumbv2/123doknet/7328586.211364/8.892.58.526.441.1067/electron-tomography-reconstruction-dislocation-obtained-diffraction-vector-shown.webp)