Liquid biofuels
in the Americas:
Current situation and
potential for development.
By: Mg. Agustín TorrobaLiquid biofuels
in the Americas:
Current situation and
(http://creativecommons.org/licenses/by-sa/3.0/igo/) Based on a work at www.iica.int
IICA encourages the fair use of this document. Proper citation is requested.
This publication is also available in electronic (PDF) format from the Institute’s web site: http://www.iica.int.
Editorial coordination: Mg. Agustín Torroba
Translation: Doreen Montaque-Preston and Bertha McLaren Layout: Carlos Umaña C.
Cover design: Carlos Umaña C. Digital publication
Liquid biofuels in Americas: current situation and potential for development / Inter-American Institute for Cooperation on Agriculture. – San Jose, Costa Rica : IICA, 2020.
61 p.; 21,59 cm X 27,94 cm. ISBN: 978-92-9248-902-1
1. Bioeconomy 2. Bioenergy 3. Biofuels 4. Biomass 5. In-dustry 6. Standards 7. Americas 8. European Union I. Torroba, Agustín II. IICA III. Title
AGRIS DEWEY
Table of Contents
Overview 9
Executive summary 11
1 Introduction 13
1.1 General framework 13
1.2 Classification of liquid biofuels 14
1.2.1 Biodiesel 16
1.2.2Bioethanol 20
2 Biofuels in the Americas: current status, potential and fundamental aspects 23
2.1 Current situation and recent developments 23
2.2 Fundamentals of biofuel use 27
2.2.1 Diversification of the energy matrix: fossil fuel substitution and energy security 27 2.2.2 Industrialization of biomass: value added at source, exportable value added, production diversification and foreign exchange generation 29
2.2.3 Employment creation and rural development 32
2.2.4 Environmental matters 37
2.3 Potential of biofuels in the Americas 41
3 Strategies for the development of biofuels and design of regulatory frameworks. 46
3.1 Comparison of different experiences 46
3.1.1 European Union (UE) 47
3.1.2 United States 48
3.1.3 Brazil 48
3.1.4 Global overview of biofuels 50
3.2 The design of regulatory frameworks 51
3.2.1 Promotional regulatory frameworks 52
3.2.2 Transitional regulatory frameworks 53
3.2.3 Open or unregulated regulatory frameworks 53
Table of Figures
Figure 1: Fossil fuel products derived from petroleum refining and comparable
products derived from biomass refining 15
Figure 2: Schematic diagram of commercial (solid lines) and developing (dotted lines) bioenergy routes (solid lines) using biomass inputs.
(Commercial products are marked with an asterisk.) 16
Figure 3: By-products of the crushing of soy and production of biodiesel 17
Figure 4: Uses of glycerin worldwide. 18
Figure 5: Bioeconomic products of the industrialization of palm. 19
Figure 6: Raw materials and production pathways for bioethanol production. 20
Figure 7: Production of bioethanol and its by-products. 22
Figure 8: Global energy matrix (2017). 23
Figure 9: LAC energy matrix (2017). 23
Figure 10: Evolution of biofuel consumption in the world (in thousands of
barrels per day). 24
Figure 11: Relative share of biofuel production in the world (2016). 25
Figure 12: Average use of biodiesel and bioethanol in selected countries
(% v/v of total use of diesel gasoline for automotive purposes, 2018). 26 Figure 13: Reduction of the petroleum deficit in the Americas, through the use
of biofuels. 28
Figure 14: Evolution of bioethanol production and DDGS exports in the United States 30 Figure 15: Evolution of biodiesel production in Argentina and total glycerin
exports (both in tons). 31
Figure 16: Exports of crude glycerin (in tons). 32
Figure 18: Jobs generated, by type of renewable energy 34 Figure 19: Variation in the real price of raw materials and in the amount destined
to biofuels production during the period 2015-2018. 35
Figure 20: Agricultural support – index of farmer support, as a percentage of revenue
received 36
Figure 21: Typical values and default values for biofuels produced without net
carbon emissions due to changes in soil use. 38
Figure 22: Range of GHG emission by unit of energy generated (Mega Jouls) 40
Figure 23: Contribution of exportable surplus of the Americas to the world
total (2016). 43
Figure 24: Potential bioethanol production based on exportable surplus for corn
and sugarcane (expressed as percentage of the gasoline consumed internally). 44 Figure 25. Biodiesel production potential based on exportable surplus of soybeans
and soybean and palm oil (as a percentage of the diesel consumed domestically). 45 Figure 26: National mandates and the average use of biofuels by country (2019) 51
Overview
On 25 September 2015, the United Nations (UN) adopted the 17 Sustainable Development Goals (SDGs), as the unifying concept defining the effort that the international community, as a whole, and each country, in particular, should ensure the development and well-being of everyone. Most countries in the world have ratified and embraced all of the 17 SDGs.
The Inter-American Institute for Cooperation on Agriculture (IICA) has aligned its strategic objectives with the SDGs, recognizing itself as part of a global alliance committed to the achievement of sustainable development in all its dimensions. To this end, the Institute established the following objectives in its 2018-2022 Medium-term Plan (MTP) (IICA 2018), seeking to:
1) Increase the contributions of the agriculture sector to economic growth and sustainable development.
2) Contribute to the well-being of all rural dwellers.
3) Improve international and regional trade for countries in the region.
4) Increase the resilience of rural areas and agri-food systems to extreme events.
IICA’s MTP (IICA 2018) and its conceptual approach regarding the bioeconomy and production development (IICA 2019) maintain that the shift towards an economy that makes more efficient and sustainable use of biological resources for production development, thereby reducing fossil fuel dependence, will call for new policies, institutions and capacities that drive and influence the behavior of stakeholders, by maximizing the potential benefits and minimizing the costs of the shift for all involved. The strategies to be implemented should include not only general policies, but also new approaches in areas such as science, technology and innovation.
There will also be a need to work towards strengthening the human resources (talent) that are needed for new bioeconomy activities, as well as to devise various rules, regulations, and market instruments that are essential to the sustainable and safe development of new bioeconomy applications.
As such, this document is geared toward technical staff of governmental and non-governmental organizations that are seeking to expand and strengthen biofuel capacities, as part of a broad approach within the bioeconomy production paradigm, which will contribute to the achievement of the SDGs and IICA’s strategic objectives.
Executive summary
The bioeconomy is becoming an extremely important production paradigm in the American he-misphere. The readily available raw materials and the vast exportable supply of surplus biomass have placed the Americas in a privileged position to efficiently utilize its biological resources.
One of the bioeconomy activities that has gained prominence, due to its immense growth over the last two decades, is the production and consumption of liquid biofuels. These bio-based fuels, primarily biodiesel and bioethanol, have enabled the smart industrialization of exportable bio-mass surplus in our region, as a substitute for fossil fuel importation.
Efficient biomass use, through the application of technology, enables the exploitation of biolo-gical resources to address the dual challenge of spurring economic development and contributing to an economy that is also tackling environmental challenges, based on a bioeconomy paradigm.
The first chapter of this document offers an introduction to biofuels and provides information on how it is classified, the products that it substitutes and/or complements, and the multi-product economy associated with this industry.
The second chapter assesses the current situation, the potential of these products and the essen-tial steps that countries in the Americas would have to take to promote the use of biofuels. We must point out the American hemisphere’s vast potential to continue industrializing its exportable surplus of biomass in the form of liquid biofuels. In fact, more than 20 countries in the Americas could begin to incorporate biofuels or to increase their current market share, if they industrialize the exportable surplus of the main raw materials used in biodiesel production (palm and soybean) and bioethanol production (corn and sugarcane)1.
It must be mentioned that the region of the Americas exports 66% of the corn and 51% of the sugar in the world. The potential exportable surplus of these two products alone would enable the production of 70 billion liters of bioethanol, in addition to a series of high value-added by-pro-ducts, such as distilled grain, corn oil, bioelectricity, biofertilizer, cellulosic paper, etc. On the other hand, the region exports 72% of the soybean oil in the world, 5% of the palm oil and 96% of the soybeans that could be industrialized to produce approximately 20 billion tons of soybean oil and close to 100 million tons of by-products for use in the production of food or animal feed (protein flours, pellets, expeller, etc.). These resources place the hemisphere in a position to be able to produce 31 billion additional liters of biodiesel, as well as glycerin as a by-product.
The hemisphere has the vast potential to produce biofuels using other raw materials, such as lig-nocellulose. Future developments in technology and changes in production costs will determine the region’s ability to expand its share in the biofuel market, using alternative raw materials.
Liquid biofuels provide a concrete opportunity for the Americas to add value to the agriculture sector, by efficiently and economically producing and supplying energy that is more environ-mentally friendly than the fossil fuel energy that it substitutes. This document analyzes the main variables that are driving the development of the sector in the hemisphere, namely:
• The generation of employment. • Environmental benefits.
• Generation of value added at source and exportable value added. • Import substitution of fossil fuels.
• Production diversification, through a “multi-product” industry.
• A positive impact on territorial development and family farming, by creating a more consistent demand for raw materials.
The third chapter describes strategies for the development of biofuels and alternative types of regulatory frameworks. It describes the evolution of legislation in the European Union (EU), the United States and Brazil. It also includes a sub-chapter devoted to the creation of regulatory fra-meworks, drawing on worldwide experience.
In terms of institutional structures and the areas that are usually regulated in terms of liquid bio-fuels, regulatory frameworks have focused on four major areas:
• Mandatory blends that can be expressed as percentages or by volume targets. • Mechanisms to determine biofuels prices.
• The tax regime applied to liquid biofuels in comparison to those used for fossil fuels. • The specific tax framework for investment activities and biofuel production.
As far as the legislation is concerned, it should be mentioned that at least 70 countries in the world have mandatory biofuel mixes, many of which are in the Americas. Moreover, in addition to being the leading consumers of this fuel, the American hemisphere has taken the initiative to develop biofuels, which is highly promising. The region produces 87% of the bioethanol in the world and 52% of the biodiesel.
It must be emphasized that this document analyzes the strategy to industrialize agriculture to sustainably produce and provide energy in line with the (SDGs). This strategy is also in keeping with IICA’s strategic objectives to: “increase the contribution of the agriculture sector to econo-mic growth and sustainable development”, while contributing to “improving the international and regional trade of countries in the region”. In summary, it also supports the Institute’s objective to “contribute to the welfare of all rural dwellers”, by directly and indirectly impacting the develo-pment of biofuels in the sector.
1 Introduction
1.1 General framework
The efficient use of biological resources could becom e one of the main comparative advantages of the Americas vis-à-vis the rest of the world. One of the bases for bioeconomy-based develo-pment as a production paradigm is the transformation of biological resources to produce plant biomass, through the process of photosynthesis, which involves solar energy, different mineral components, water and carbon dioxide (CO2).
As such, biotechnology applications, biodiversity resource usage, eco-intensification of produc-tion, increased efficiency of value chains, ecosystem services, biorefineries and bioproducts are the main pathways to the development of the bioeconomy. Given their level of development and potential, biorefineries that produce bioenergy play a pivotal role in the Americas.
In broad terms, bioenergy can be defined as a type of renewable energy produced from biomass derived from a biological or mechanical process, generally from substances that make up living organisms or their remains or waste. This type of primary energy is then used to produce biologi-cal fuel products for use in different stages of production or final consumption: biofuels.
Thus, biofuels are made from biomass and create bioenergy. Depending on the level of proces-sing, they can be classified as:
(i) Primary/ traditional biomass: biomass that has not been subject to extensive processing, wood fuel being the best example.
(ii) Secondary/ modern biomass: the result of a process that alters the natural state of the biomass that was collected. After it is processed, the biomass that has been transformed into secondary fuels has a greater number of applications, both in industry and in transportation. This second category includes biodiesel, bioethanol, biojet fuel, biofuel oil and biogas.
The use of secondary biofuels, especially liquid biofuels, has given rise to associated value chains and networks that have developed considerably in the Americas. This development has been facilitated by ad hoc regulatory mechanisms that have enabled the biofuel production sector to acquire a certain level of maturity and competitiveness in various countries in the region. The application of public policies has been instrumental in creating, developing and strengthening this new business. As such, regulatory systems have considered inserting this new sector into the mature and developed fossil fuel market2.
In addition to being one of the bioeconomy applications with the greatest level of develo-pment and potential in the hemisphere, liquid biofuels are manufactured as part of a system
scope”, “economies of diversity”, etc. Authors such as Carlton and Perloff (1994) and Baumol et al. (1988) refer to “joint production” or “variety”, which is defined as a production process that produces more than one good. In the case of biofuels, a basket of bioproducts is produced, many of them of significant value, thereby enhancing the potential of the relevant bioeconomy pathway.
These types of green chemistry-based production systems enable products that are typically derived from fossil and petrochemical refining processes to be replaced by others, through the use of oleochemistry and alcochemistry. The manufacturing of bio-based fuels and by-products has created a production system in which one production sector is linked to multiple value chains, both in the production of biofuels as well as in the preceding stages. In addition to the typical products that can complement or substitute fossil-based fuels, bioproducts are also produced at the same time for use as food, pharmaceuticals, energy, etc.
1.2 Classification of liquid biofuels
Given their physiochemical properties, biofuels can either complement and/or substitute pro-ducts derived from the refining of petroleum. The most commonly used petroleum-based fossil fuels are gasoline and diesel or gas oil, which in 2017 accounted for 42% and 24%, respectively, of total hemispheric consumption of petroleum products. Diesel can be substituted by biodiesel, which is the result of a transesterification process, using an oil (usually soybean, rapeseed or palm) and an alcohol. Gasoline, on the other hand, can be replaced by bioethanol, by way of fermentation and distillation of raw materials with high levels of sugar, starch or lignocellulose. Biofuels can also be produced using other raw materials and technology.
Biofuels can be classified as conventional or advanced. Although the classification is not based on homogenous criteria, in general the definition takes into account the raw material used, the type of technology and its environmental performance, in terms of its ability to reduce greenhouse gas emissions (GHG).
Conventional biofuels tend to be associated with fuels that are “first generation” (raw material from crops that can be used as food), whereas advanced biofuels are second or third generation fuels (using raw materials such as lignocellulose and algae), resulting in a greater reduction of GHG emissions.
Liquid biofuels for aviation (biokerosene or biojet fuel), the maritime industry, and electricity generation (biofuel oil or bio oil) are produced and consumed on a much lower scale; yet, despite their marginal use offer great potential for development.
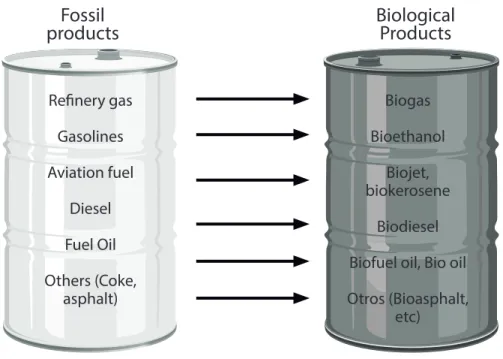
The cracking of fossil fuel molecules triggers a production process that gives rise to a wide ran-ge of energy and non-energy (asphalt, solvents, etc.) products. Similarly, cracking and other phy-siochemical processes to treat biomass also produce comparable energy and non-energy products.
The following diagram lists the main products derived from the petroleum refining process and the substitute/complementary products obtained from the biomass refining process.
Figure 1: Fossil fuel products derived from petroleum refining and comparable products deri-ved from biomass refining.
Refinery gas Gasolines Aviation fuel Diesel Fuel Oil Others (Coke, asphalt) Biogas Bioethanol Biojet, biokerosene Biodiesel Biofuel oil, Bio oil Otros (Bioasphalt,
etc)
Fossil
products
Biological
Products
Source: Prepared by the author.
Some biofuel products are not yet being produced on a commercial scale, for example, bio me-thanol, biobutanol and biohydrogen, among others. The following diagram provides a schematic breakdown of which raw materials can be transformed into biofuels, the technological processes for conversion and the resulting biofuels:
Figure 2: Schematic diagram of commercial (solid lines) and developing (dotted lines) bioe-nergy routes (solid lines) using biomass inputs. (Commercial products are marked with an
asterisk.)
Notes: 1. Parts of each feedstock could also be used in other routes. 2. Each route also produces co-products. 3. Biomass upgrading includes densification processes (for example, pelletization, pyrolysis, torrefaction, etc.) 4. Anaerobic digestion processes release biomethane, essentially methane, which is the main component of natural gas. 5. There can be other thermal processing routes, such as hydrothermal processes, liquefaction, etc. Other routes, for example, include aqueous phase reforming. 6. Gas oil and diesel, biogas oil and biodiesel are synonymous.
NB: MSW= municipal solid waste and DME = dimethyl ether
Source: Adapted from IPCC 2011..
1.2.1 Biodiesel
Biodiesel has similar physical and chemical properties to fossil diesel and can therefore be used as an alternative fuel. However, it can also be used as a complementary product that can be combined with fossil diesel to create a mixed fuel.
The amount of biodiesel in a fossil diesel mix is referred to as a “blend”. Blends are designated as Bx, with x being the percentage of biodiesel in the mix. Thus, a 5% biodiesel to 95% diesel mix would be a B5 blend. Similarly, a 10% to 90% mix, respectively, would be considered a B10 blend, and so on. Pure biodiesel is known as B100.
Oils are used in the production of biodiesel, most commonly soy, palm and rapeseed oil. Howe-ver, other materials can also be used, such as beef tallow, waste vegetable oil, castor and jatropha oil, biomass residue, etc.
The traditional production method is a process in which the raw material reacts with alcohol (usually methanol) and a catalyst (sodium methyl is most frequently used). This process, ca-lled transesterification, is the most common chemical process used to manufacture biodiesel, and usually produces “FAME” biodiesel (Fatty Acid Methyl Esters).
There is an alternative method of producing renewable diesel that bears mentioning, using a process other than oil transesterification or FAME. This type of biofuel—that can also be used as a substitute to fossil diesel—is produced through the hydrogenation of vegetable oils or animal fat. Hydrogenated vegetable oil (HVO) already accounts for more than 10% of biodiesel produced in the world. This product has remarkably similar characteristics to fossil diesel and the process can also result in a series of high-quality by-products: jet fuel and fuel oil, all of them based on biological raw materials.
The initial crushing process in the production of soy biodiesel, gives rise to the following pro-ducts:
• 80 % for pellets, expellers and protein flours for human consumption and animal feed. • 18-20 % for oil for subsequent use in the production of biodiesel.
• 0-2 % residue that may be used in new energy generation processes.
Figure 3: By-products of the crushing of soy and production of biodiesel
Source: CARBIO.
It is interesting to note that a large part of the production process is geared toward food produc-tion (80%), whereas only a small part is for energy producproduc-tion.
20% Oil
Food
Biofuels Industry
Glycerin
80% Protein
flours
Moreover, the production process that gives rise to biodiesel also produces glycerol, which has multiple uses: cosmetics, pharmaceuticals and textiles, as well as for military and food purposes, to name a few. The following infographic illustrates various uses of glycerin, worldwide.
Figure 4: Uses of glycerin worldwide.
Source: Sierra-Márquez et al. 2017.
On the other hand, the process to extract palm oil to produce palm oil biodiesel gives rise to a range of by-products with multiple uses.
Van Dam (2016) indicates that the main by-products of the process are empty fruit bunches, mesocarp fibers, palm kernels and palm kernel cake. These materials have tremendous potential, as they can generate CO2 neutral energy; supplement soil carbon; promote the return of nutrients, as well as produce briquettes and pellets for co-combustion, pyrolysis oil, biocarbon, cellulose paper pulp, lignocellulosic bioethanol and animal feed, among other products. Moreover, palm oil is an extremely valuable component in the food and oleochemical industries.
Other Opportunities
Paper Textiles
Metabolites Animal Feed
Detergents 2% Tobacco 6% Alkyd resins 8% Others 11% Triacetin 10% Others 11% Cellophane 2% Explosives 2% Pharmaceuticals 18% Personal care items 16% Polyether & Polyols 14% Food 11%
Figure 5: Bioeconomic products of the industrialization of palm.
Source: Sierra-Márquez et al. 2017.
According to FEDEPALMA (2016), the average extraction rate of crude palm oil in Colombia is 20.4%, which can vary depending on the production region and the technology that is applied. This oil can be used to produce biodiesel, whereas the by-products can be used in any of the mul-tiple applications mentioned above.
Like soybean oil, the transesterification of palm oil with an alcohol also produces a combination of methyl or ethyl esters (biodiesel) and glycerin.
The quality of a biodiesel is closely linked to the raw material used to produce it. Thus, the qua-lity specifications of palm biodiesel differ from soy- and rapeseed-based biodiesel, due to the na-ture of palm oil. For example, one noteworthy difference stems from the fact that the freeze point of palm-based biodiesels is higher. Soy-based biodiesel has a lower freeze point than palm-based biodiesel, but a higher freeze point than equivalent rapeseed-based fuels. Therefore, climate can be a factor in determining the raw material used to produce the biodiesel4.
Bio-energy
Bio-compounds
Paper Methanol
Inorganic & organic fertilizers Biotechnology products Biohydrogen Biomethane Bioethanol Glycerin Soaps Plasticizers Edible oils Bioethanol Stearin Olein Pulp Fruit Almond Fiber Effluent Oil Oil
Palm Kernel Cake
Activated Carbon
Palm Kernel Ash for the construction industry Proteins and bioactive peptodes
Biodiesel
Margarine and clandles
1.2.2 Bioethanol
Bioethanol is an ethyl alcohol produced through the fermentation of raw materials with a high sugar content (such as sugarcane, sorghum, or beet); cereals (such as corn or wheat) and/ or lignocellulosic biomass products. It can be used in combustion engines; it can also be blended with gasoline or used to replace it. In a similar manner to biodiesel, ethanol blends are identified using the ‘x’ system, with ‘x’ being the proportion of bioethanol in the mixture. Thus, E100 is pure bioethanol.
Extracting bioethanol from cane or beet sugar is simpler than extracting it from grains, as it requires one less stage in the production process, since there are sugars that are already availa-ble in the biomass. Overall, the process involves the extraction of sugar (using a mill), which is then followed by fermentation. After fermentation, the alcohol is distilled, as is the case with starch-based production.
Figure 6: Raw materials and production pathways for bioethanol production.
Source: BNDES 2008.
Sugar biomass
(Sugarcane, beet) (Corn, wheat, tapioca)Starch biomass (Under develptment)Cellulosic biomass
Fermentable Sugar Solution
Bioethanol Diffusion extraction or pressure extraction Grinding Enzymatic hydrolysis Grinding Acid hydrolysis or enzymatic hydrolysis Fermentation Distillation
Bioethanol can be produced from sugarcane, by using either direct sugarcane juice or molasses5. Bioethanol can also be produced through the melting of raw sugar, although this approach is less com-mon. In the saccharose to bioethanol process, 1kg of sugar, in theory, can produce 0.684 liters of bioe-thanol anhydride6. On the other hand, using molasses, which is a sugar by-product, produces a much lower amount. Thus, if the juice itself is used in the production process, more than 80 liters of bioethanol can be produced from each ton of cane. If molasses is used, the process will only produce close to 12 liters of ethanol per ton of processed cane and the rest of the cane will produce approximately 110 / 130kg of sugar7.
Similar to biodiesel production, bioethanol production is also linked to processes that result in other by-products. In the case of sugarcane-based production, the process also gives rise to the following by-products:
• Bagasse and agricultural crop residue (ACR) that can be used to produce electricity, steam, paper and/ or lignocellulosic bioethanol.
• Vinasse, which can be used to produced biogas and unicellular proteins, as well as biofertilizer to fertilize terrains or as a fuel to burn in furnaces.
• Yeasts, which can be used as a food supplement.
• CO2 recovery for use in the production of sparkling and carbonated drinks and for the recovery of hydrocarbons.
• Sugar, in cases in which production is molasses-based and not based on the use of direct sugarcane juice.
The second method of producing bioethanol uses cereals as the main raw material. The conversion process generally begins with selection, cleaning and milling of the grain. It can be a wet milling pro-cess, in which the grain is soaked and fractionated before the starch is converted into sugar; or a dry milling process, when this takes place during the conversion process. In both cases, the starch is con-verted into sugars through an enzymatic process at high temperatures. The sugars that are released are fermented with yeasts and the alcohol that is produced is distilled for purification into bioethanol. One ton of corn—the cereal most commonly used in the production of this type of biofuel—can produce bioethanol, as well as a series of associated by-products that also add value and facilitate the develop-ment of compledevelop-mentary activities:
• DDGS/WDGS8: dried and wet distiller’s grain for animal feed. Approximately 33 % of corn is con-verted into this product, which is subsequently processed into red and white proteins (for feedlots,
5In the sugar production process, molasses is the part of the sugarcane that is saturated and does not crystallize.
6For more details, see BNDES 2008.
dairy farms, etc.).
• Corn oil: for human consumption, biodiesel production and other industrial uses. • CO2 recovery: for sparkling and carbonated beverages and hydrocarbon recovery.
• Vinasse: This by-product, 30% to 35% of which is comprised of soluble proteins, can be mixed with the distiller’s grains or used to generate biogas.
Figure 7: Production of bioethanol and its by-products.
Source: Prepared by the author.
The third method to produce bioethanol uses cellulose. This type of production calls for extre-mely complex processes prior to fermentation, thereby increasing the cost of production. Althou-gh commercial-scale plants for this type of production already exist, their contribution to total production is still marginal.
2. Biofuels in the Americas: current status,
po-tential and fundamental aspects
2.1 Current situation and recent developments
The composition of energy matrices9 in the world and in Latin America and the Caribbean (LAC) has one feature in common: heavy dependence on fossil fuels. Indeed, 81% of global energy consumption is based on coal, natural gas and petroleum, as compared to 70% in Latin America. According to the International Energy Agency (IEA 2018), the energy sector generated 72% of total GHG emissions in 2013, with fossil fuels, particularly coal and petroleum, being the main sources of emission.
Figure 8: Global energy matrix (2017).
Figure 9: LAC energy matrix (2017). Source: IEA 2019.
After petroleum, natural gas, and coal, biomass is the fourth largest source of energy; it results from plant photosynthesis, as part of the process of capturing solar energy, CO2, water and other components. This energy source accounts for 10% of the global energy matrix and 21% of the LAC energy matrix.
The global use of liquid biofuels as bioenergy has tripled in just over ten years, due to pu-blic incentive policies, to a great extent, and to the increased productivity of the sector, that, in some cases, has been able to compete, on a price-basis, with fossil fuels.
Figure 10: Evolution of biofuel consuption in the world (in thousands of barrels per day).
Source: U.S. Energy Information Administration 2019.
The region of the Americas has taken the initiative in this area and the development of the sector has been truly promising. The region produces 87% of the world’s bioethanol and 52% of the biodiesel. The use of biofuels has spread throughout the hemisphere, with several successful experiences.
Figure 11: Relative share of biofuel production in the world (2016).
Source: U.S. Energy Information Administration 2019.
In addition to producing a large share of the bioethanol in the world, the use of the bio-fuel in the hemisphere generally far exceeds the usage in the rest of the world. Most notable is the case of Brazil10 , with its 27% anhydrous bioethanol gasoline blends and the possibi-lity of using pure hydrated bioethanol, which has meant that a total of 44% of gasoline con-sumption is in the form of bioethanol. Similarly, Paraguay currently has a mandatory 25% volume of bioethanol in gasoline, whereas in Argentina it is 12% and in Colombia, 10%. On the other hand, the United States uses a 10% bioethanol mix on average, with different states instituting their own blend requirements. It also has a blender pump system and a technology that enables the use of up to 85% bioethanol (E85), also known as American flex fuel.
The raw materials that are most utilized for bioethanol production in the United States are sugarcane and corn. The first is used mainly in Brazil, a country that has industrialized 64.5% of the cane in the 2019-2020 harvest for biofuel production. This raw material is also heavily used in Colombia and Paraguay. On the other hand, the United States is the major global producer of corn bioethanol and has now industrialized 40% of this grain for biofuel production. Argentina has a mixed system – 50% corn-based bioethanol and 50% sugarcane-based bioethanol.
These countries have major surpluses of these raw materials. Brazil exports 38% of the world’s sugar; the United States exports 31% of the corn and Argentina, 13% of the corn. At an aggregate level, exports from the Americas account for 66% of the world’s corn and 51% of its sugar, and thus has a large amount of feedstock available to be industrialized in the form of biofuel. This will be presented in greater detail later in this document.
percen-in the Americas: Brazil, which has an 11% mix, with the aim of percen-increaspercen-ing it 1% every year until it reaches B15 in 2023; Argentina and Colombia, with 10% mixes; Uruguay with an average of 5% and the United States with 4%.
Figure 12: Average use of biodiesel and bioethanol in selected coun-tries (% v/v of total use of diesel gasoline for automotive purposes, 2018).
Source: Prepared, based on data from USDA 2019, REN 21 and national legislation.
The most frequently used raw materials in the Americas are soy and palm oil, whereas in Europe the most frequently used material is rapeseed oil. Argentina and the United States produce 100% of their biodiesel with soy oil, whereas Brazil produces 80% with that raw material. Colombia uses palm oil.
The choice of raw materials is closely linked to production surpluses. As a region, the Americas exports 72% of the world’s soy oil, with Argentina as the main exporter, at 41% of the world total, Brazil at 11% and the United States at 10%. Colombia, on the other hand, is the world’s fourth lar-gest exporter of palm oil, accounting for 1.5% of the total. This data illustrates that the American region has a high volume of available raw material that can be industrialized for biofuel production.
The use of biofuels has allowed the Americas to reduce imports of petroleum and its by-products by 30%, as well as to replace 11.6% of the gasoline used by the region with bioethanol and 4.6% of the diesel with biodiesel.
2.2 Fundamentals of biofuel use
According to Georgescu-Roegen (1975), the term bioeconomy “is intended to make us bear in mind continuously the biological origin of the economic process and thus spotlights the pro-blem of mankind’s existence with a limited store of accessible resources, unevenly located and unequally appropriated”.
Thus, national biofuel development strategies will no doubt depend on the amount and quali-ty of biological resources generated through photosynthesis, or in Georgescu-Roegen’s words, on the “limited store of accessible resources, unevenly located and unequally appropriated”.
In this sense, the basis for the use of biofuels could vary according to availability and the quality of each country’s biological resources; its ability to harness them; the availability of non-renewable natural resources and the productive economic structure.
The biological origin of the resources that will determine the development of the overall in-vestment and production strategy for bioenergy, and specifically for liquid biofuels, will enable the supplementation or substitution of hydrocarbon products located in sedimentary basins that arose through fossil fuel formation over millions of years. The biological products are derived from a completely different type of process that is based on capturing solar energy through “on-time” photosynthesis”11. Production, distribution and consumption processes of bio-based fuels can take place over short periods in tandem with the natural production cycles of biomass and the social cycles of industrial processing, distribution and consumption.
2.2.1 Diversification of the energy matrix: fossil fuel substitution and energy security
As a region, the Americas consumes 30 million barrels of petroleum per day. This production is not enough to supply all its needs and thus it imports 10% of the petroleum it consumes. Biofuel use has allowed the reduction of crude oil imports by 30%. The region has a surplus of vegetable biomass, which is uses to produce these bio-based fuels.
Figure 13: Reduction of the petroleum deficit in the Americas, through the use of biofuels.
Source: Prepared, based on data from British Petroleum 2019.
It must be noted that the composition of the energy matrices at the world level and in LAC are similar: the heavy dependence on fossil fuels. Thus, 81% of the world energy mix is comprised of coal, natural gas and petroleum, whereas these same sources account for 70% of the LAC energy matrix. Biofuel use allows the region to reduce its fossil fuel dependence.
Furthermore, the hemisphere uses more than 82% of its petroleum refining capacity. The remai-ning 18% consists of many costly and small-scale units. New investments in refiremai-ning would call for huge levels of investment; would enable only a minor boost in production capacity and would yield a mix of by-products: gasoline, aviation fuel, diesel, fuel oil, etc. In contrast, investments in biofuel production capacities would require significantly smaller sums. It would also enable modular production capacity and would facilitate the production of the specific biofuel that is required, rather than a range of different fuels.
Moreover, biofuels have properties that are in line with developments in technical specifications and the desired qualities of fossil fuels, enabling the mixing of biofuels and fossil fuels to create a final product with superior characteristics. For example, bioethanol is formulated as an anti-knock agent with an octane rating between 102 and 13012. This makes it an octane enhancer that has enabled the replacement of some enhancers that were previously used in formulating gasoline and that potentially pose a risk to the environment and to health, such as methyl tert-butyl ether (MTBE)13, a product that has been banned in the United States, in the same way that lead has. In the case of biodiesel, the limited amount of sulfur in that product is in line with new quality spe-cifications for diesel fuel, which usually require a reduction in sulfur content.
Thus, biofuel production enables countries to rely on domestic sources of energy, commercia-lizing and adding value to biological resources, thereby creating greater independence and diver-sification of the energy matrix.
2.2.2 Industrialization of biomass: value added at source, exportable value added, pro-duction diversification and foreign exchange generation
As mentioned before, biofuel production takes place within the framework of a series of mul-ti-product productive processes that add value to by-products of the agriculture sector.
Depending on each country’s availability of resources and economic geography, the industria-lization of biological resources can take place in locations other than where the raw material is produced or even in neighboring areas (value added at source). The latter is closely related to the fact that biomass “travels but does not travel well”. In the absence of a logistical infrastructure, in many cases it may be convenient to industrialize raw material at source. For example, we have outlined two cases of value addition at source:
(i) Production of sugarcane bioethanol: Due to the costs of transporting the raw material, the cane is not usually transported more than 60km from the area in which it was produced. For this re-ason, sugar mills seek to optimize the use of all the cane, whether to produce sugar or biofuels that can be sold to distributors or closer consumption centers. The consumption centers may be net importers of gasoline and thus commercialization at source could offer a clear benefit, by reducing logistical costs. Furthermore, by-products are usually used in surrounding areas: steam generated from the bagasse is often used by the mill for production; bioelectricity gene-rated from the excess bagasse or the sugarcane harvest residue—SHR—is used in production or incorporated into the distribution grid; and biofertilizer is usually returned to the field. (ii) Corn bioethanol production: An inadequate economic transportation infrastructure can
create a situation in which logistical costs to transport the corn to ports for export can be ex-tremely onerous. This would induce producers to industrialize the grain into bioethanol, which would provide a benefit, by reducing their freight or “return freight” costs. Under this system, adjoining areas can be supplied with bioethanol for consumption and with associated by-pro-ducts, which are generally activities involving the use of dried distiller’s/ wet distiller’s grains with solubles (DDGS/WGS), such as dairy farms, feed lots and poultry production centers. In addition to adding value, biofuel production facilitates production diversification and in many cases the generation of exportable value added. One example is the case of bioethanol in the United States. Bear in mind that this country is the world’s largest exporter of agricultural products. According to the U.S. Grain Council (2019), the FAZ Report of the U.S. Department of Agriculture has indicated that among the 47 products that this organization monitors in the United States, the product with the highest increase in exports over the last five years is bioethanol. More than 6.1 billion cubic meters, valuing USD 2.7 billion, were shipped to more than 80 countries in 2018. This required the industrialization of 16 million tons of corn.
Similarly, exports of DDGS from bioethanol production have grown exponentially, valuing more than USD 3 billion in 2018. Exports of this by-product have increased in tandem with the increase in bioethanol production, as illustrated in the figure below.
Figure 14: Evolution of bioethanol production and DDGS exports in the United States
Source: Prepared, based on data from ITC (Trade Map) and the U.S. Energy Information Administration.
In the case of biodiesel, the development of by-products derived from its production process has enabled value addition to the business, thus making it possible to make additional invest-ments, particularly in the glycerin market. One example of this is Argentina, which prior to insta-lling its biodiesel plants, did not produce this by-product and after the creation of this industry in 2017, now exports 7.5% of the world’s glycerin and has built three glycerin refining plants, which has allowed the country to quadruple the price at which it sells the product.
The following figure shows how Argentina expanded glycerin exports hand in hand with bio-diesel production. Prior to embarking on biobio-diesel production in 2007, the country did not gene-rate any value-added exports using that by-product. When it embarked on biofuel production, the manufacturing of glycerin, targeting the external market, began to grow in proportion to biodiesel growth. Furthermore, the construction of the glycerin refining plants enabled the production of this additional value-added by-product, which has been exported at prices that are four times the price of crude glycerin.
Figure 15: Evolution of biodiesel
production in Agentina and total glycerin exports (both in tons).
Source: Prepared, based on data from Argentina’s Secretary of Energy and the National Institute of Statistics and Censuses, INDEC. A similar situation occurred with the introduction of mandatory biodiesel requirements in Bra-zil and Colombia. In both cases, the generation of exportable value-added through this biodiesel by-product enabled both countries to acquire a 13.4% and 5.1% share, respectively, of the export market for crude glycerin. The United States, a country that also produces this biofuel, has fo-llowed the same route. The following figure illustrates that as of 2006, the year when biodiesel production was taking shape, associated exports of crude glycerin became particularly important for the four major producers in the hemisphere.
Figure 16: Exports of crude glycerin (in tons).
Source: Prepared, based on data from the ITC (Trade Map).
Biofuels also enable diversification of the production matrix, by industrializing primary ex-ports, decreasing producers’ exposure to fluctuations in the prices of commodities from exporting countries and generating foreign exchange that helps to strengthen the external accounts of coun-tries.
These characteristics also contribute to the achievement of two of the strategic objectives of IICA’s 2018-2022 Medium-term Plan: to increase the contributions of the agriculture sector to economic growth and sustainable development and to contribute to improving international and regional trade for countries in the region.”1 4.
2.2.3 Employment creation and rural development
The changes spurred by the efficient use of biomass to produce biofuel, in addition to genera-ting added value, reducing the carbon in the environment and decreasing our dependence on fossil fuels, also play a key role in employment creation.
According to the World Bank (2019), in 2018, unemployment in Latin America surpassed 8% for the second consecutive year, which is equivalent to more than 25 million unemployed people. Moreover, according to data from the International Labor Organization (ILO), more than 20 mi-llion of those who are employed live in situations of extreme or moderate poverty.
A report by the International Renewable Energy Agency, IRENA (2019), indicated that in 2018 bioenergy generated 3.18 million jobs – equivalent to 30% of all jobs in the renewable energy sector.
Figure 17: Job creation, by type of renewable energy.
Source: Prepared, based on data from IRENA 2019.
Specifically, the liquid biofuels sector in particular has employed 2.063 million people, with a year-on-year growth rate of 6%, which represents 68% of jobs generated by the bioenergy sector.
Moreover, the employment generated by the biofuels sector worldwide is highly concentrated in the hemisphere: LAC accounts for employs 50% of liquid biofuel jobs worldwide, while North America accounts for 16%. Brazil leads among countries as the largest employer in bio-fuels, employing 832,000 persons.
Figure 18: Jobs generated, by type of renewable energy
Source: IRENA 2019.
As a result, biofuels in particular, and bioenergy in general, hold second place worldwide in terms of job generation in the field of renewable energy. The Americas represent 66% of the jobs generated by the liquid biofuels industry worldwide, which is an additional factor that exp-lains why their production and development are crucial.
The additional impact of upstream agriculture linked to the production of biofuels relates clo-sely to increased demand for raw materials and its impact on prices. According to IICA (2020), 16% of corn production worldwide, 20% of sugar production, 19% of soybean oil and 16% of palm oil were destined toward biofuels.
When the prices of related commodities are not attractive, the redirection of raw material deri-ved from crops, especially multiannual ones, can be particularly beneficial to farmers. It generates more stable demand for raw materials, although the effect on prices is not clearly known. Several studies reveal factors that could have diverse impacts on the price of agricultural raw materials. Although there is no general consensus on the matter, it seems that the impact of biofuels produc-tion on agricultural prices is not connected to the degree initially believed to the general rise in the price of raw materials in 2007-2008.
Paying special attention to data in recent years, it is observed that between 2015 and 2018, the use of soybean oil destined to biofuel production increased by 40%; however, the price of soy decreased by -3%, while the price of soybean oil experienced a marginal increase of 0.3%. In the case of palm oil, its use in the production of biofuels increased by 56% in the same period, while its real price decreased by -7%. Likewise, corn consumption for bioethanol increased 10% and su-gar 2%, while their real prices diminished by -7% and -11%. According to these figures, in recent years, the increased use of raw materials in the production of biofuels has not been reflected in a substantial increase in prices, but rather may have stemmed a higher decrease.
Figure 19: Variation in the real price of raw materials and in the amount destined to biofuels production during the period 2015-2018.
Source: World Bank 2019 and market data
The occurrence of higher prices in agricultural products is implicit due to various transfer programs, direct subsidies or price support that States implement to benefit farmers in many countries. An index prepared by the Organization for Economic Cooperation and Development (OECD) reveals that, out of a total of 55 countries evaluated in 2018, 51 implemented some form of action that implied higher re-venues for farmers. The positive impact that the use of biofuels possibly has on the price of agricultural raw materials is in line with the need for higher sector revenue in several countries.
Figure 20: Agricultural support – index of farmer support, as a percentage of revenue received
Source: OECD 2019.
Indeed, production of biofuels ensures stable demands of certain raw materials. In some cases, the impact will be less, like soy, where it needs to be noted that only 18% of the bean generates soybean oil.
The importance of using specific raw materials to produce biofuels becomes a relevant factor in some countries in particular. An example is sugar cane in Brazil, a country which allocated 64.5% of its 2019/2020 harvest to the production of bioethanol. Even so, it continues to be the world’s primary sugar producer and exporter (38% of global export) in a market that has had the lowest prices over the last decade. Without a doubt, the demand for sugar cane to produce bioethanol has allowed farmers to position their products based on stronger demand within an unfavorable price context.
There was a similar occurrence with corn ethanol: between 2011 and 2018, the price dropped 48% while the production of ethanol based on this raw material has continuously increased. Wi-thout a doubt, using corn to produce bioethanol has cushioned the price drop, the same as happe-ned in the case of sugar cane.
The more stable demand for raw materials and the positive impact this possibly has on prices can benefit a neglected group in LAC: family farmers, of whom there are 60 million working in the sector. According to IICA (2018), 46% of LAC’s rural population is poor, well above national
averages. This population group could benefit indirectly from higher prices and more sustainable demand for raw materials destined to biofuels15. Therefore, an increase in prices would imply a redistribution of revenue in favor of the population sector most affected by poverty.
In addition, Martinelli et al. (2011) conducted a study for Brazil in which they highlighted that the value added of sugar cane production components linked to the generation of ethanol and sugar could have a significantly positive impact on local human development, compared with other farming activities. According to the study, the results show that this phenomenon is linked to the stimulation of rural development promoted by the industry involved in the downstream production process.
In this way, biofuel production contributes to the well-being of rural dwellers, which is a strate-gic objective of IICA’s Medium-term Plan (MTP)16.
Finally, it should be pointed out that the production of biofuels can serve as a reserve or buffer for raw materials in the event that crises arise due to the loss of harvests17.
2.2.4
Environmental matters
The bioeconomy, as a production paradigm, has the double challenge of developing the eco-nomy and promoting a model in line with current environmental challenges. Therefore, the use of biofuels must contribute to decarbonization, in contrast to fossil substitutes which, according to the IEA (2018) generated the equivalent of 72% of CO2 emissions in 2013.
In this sense, many laws link the use of biofuels to the existence of emissions reduction certifi-cation compared to fossil substitutes. For example, the EU, in its Directive 2009/30/CE, assigns the following mandatory emissions savings percentages with respect to fossil substitutes:
15 The status of poverty in the world is also heightened in rural areas. It is estimated that between 70% and 80% of poor people
(630-720 million persons) live in rural territories (Mendes Souza et al. 2015).
16 For more information on the objectives of IICA’s Medium-term Plan 2018-2022, see http://apps.iica.int/SReunionesOG/Content/
Figure 21: Typical values and default values for biofuels produced without net carbon emissions due to changes in soil use.
Source: EU, Directive 2009/30/EC
Brazil, for its part, established the RenovaBio program in December 2017, as part of its Natio-nal Policy on Biofuels. This program is based on annual CO2 emissions reduction, with distribu-tors being directly responsible for compliance with obligations. Moreover, the program includes biofuel certificates based on emissions reduction and decarbonization credits (CBIO). It is impor-tant to point out that the obligation uniquely lies with the distributor, a crucial player in Brazil’s bioethanol market.
Depending on the level of emissions and raw materials used, the United States Environmental Protection Agency (EPA) classifies biofuels based on emissions reduction as follows:
• Conventional renewable biofuels: GHG reduction greater than or equal to 20% • Advanced biofuels: GHG reduction greater than or equal to 50%.
• Cellulosic biofuels: GHG reduction greater than or equal to 60%. • Biomass-based diesel: GHG reduction greater than or equal to 50%.
The GHG reduction performance of biofuels varies according to multiple factors, taking the product’s life cycle into consideration, and is closely linked to agricultural yield and the techno-logies applied during the primary and industrial production process.
According to Chidiak et al. (2018), who carried out studies in Argentina, the average national value of biodiesel emissions reduction, taking into account change in soil use, showed a decrease between 51% and 72% compared with substitute fossils, depending on a scenario of whether any change in soil use is contemplated. In the case of ethanol derived from sugar cane, the average national value of emissions reduction varies between 64% and 62%, depending on the fuel of reference being considered. Analyses carried out by Hilbert et al. (2016) on the corn bioethanol industry showed reductions of 66% in CO2 emissions, compared with gasoline.
According to studies carried out by Gauch (2013), an 83% reduction in CO2 emissions was ob-served for biodiesel derived from palm, and 74% for bioethanol derived from sugar cane.
According to the IPCC (2011), the “good use of bioenergy can significantly reduce greenhouse gas emissions compared with alternative fossils.” In this sense, it is necessary to establish national instruments of measure for GHG emissions throughout the life cycle of biofuels according to the different raw materials used, with the aim of corroborating the environmental advantages. In ad-dition, special attention should be paid to changes in the use of cultivatable soil. The IPCC report points out that, when soils with a high carbon content (forests) are converted into land destined to grow biofuels, it can take several decades (even centuries) to recuperate the net emissions derived from changing the soil use. On the other hand, the use of marginal land to produce raw material destined to make biofuels as a replacement for fossils has the effect of maximizing emissions savings.
Figure 22: Range of GHG emission by unit of energy generated (Mega Jouls)
Note: Different raw materials and other commercial technologies and technologies under develo-pment are included (algal biofuels, Fischer-Tropsch synthesis, etc.). Changes in carbon stocks as a result of a change in soil use are excluded.
Source: IPCC 2011
In addition to emissions reduction objectives, best environmental practices in biofuels produc-tion must be guaranteed as it relates to the management and disposal of the associated effluents. In almost all cases, it is possible to use these effluents as by-products to produce energy, bio com-post, etc. Also, it should be ensured that biofuels production results in an energy return rate that guarantees the sustainability of the industry18.
18 The energy return rate, better known as “energy return on investment (EROI)” is the ratio between the energy contained in a product
It is important to stress that the processes for certifying the reduction of GHG emissions and tracking the source of raw materials from zones that are free of deforestation, or that are under biodiversity protection, must be agile ones; moreover, they should not evolve into non-tariff me-asures intended to restrict global trade in biofuels.
Based on its potential to generate new sources of inclusive and sustainable economic growth and contribute to decarbonization of the economy, the sustainable development of the biofuels industry can be a suitable strategy for achieving the SDGs that aim to: a. Reduce poverty (objective 1).
b. Guarantee health and well-being (objective 3).
c. Guarantee the availability of clean, affordable energy (objective 7).
d. Create new sources of income and employment
e. Promote industrial innovation and renewal
f. Achieve more sustainable cities and communities (objective 11). g. Foster climate change mitigation and adaptation (objective 13).
Table 1: Biofuels and the SDG
2.3 Potential of biofuels in the Americas
As mentioned before, the use of biofuels is part of the transition towards cleaner energy, thus reducing GHGs. In this sense, within the framework of the general strategy for bioeconomy, bio-fuels promote a cleaner alternative for energy production while fostering growth and development through the industrialization of biological resources in the countries.
The availability of biological resources, raw materials and technologies and the cost of pro-duction are key factors to assess the potential to produce additional amounts of biofuels. In this respect, 90% of biodiesel is produced with three types of oil: soybean, palm and rapeseed19. Production deriving from sunflower or coconut oil or from waste is marginal and depends on the relative availability of raw materials as well as the production costs.
Similarly, the production of bioethanol focuses primarily on the use of corn and sugarcane. Pro-duction based on other raw materials such as cassava or sugar beet accounts for a low percentage
of the world total. Likewise, the use of lignocellulosic material has yet to gain a foothold. In this respect, although the technological availability enables innovative production by using this type of raw materials, the production costs still constitute a major obstacle.
The so-called green chemistry, which focuses on biofuels, helps replace the import of oil and its byproducts, which in the hemisphere amounts to 3.5 million barrels per day. In this context, the hemisphere may leverage the fact that this region is the top net exporter of biomass. Accordingly, each country could profit fully from its excess production to develop a corresponding strategy. The current technological availability facilitates the use of a wide range of biofuels in combina-tion with fossil fuels, in some cases in their pure state, such as the flex fuel 20 used in more than
70% of the Brazilian fleet.
In order to quantify the potential, it is worthwhile mentioning that the Americas export 66% of the world’s corn and 51% of the world’s sugar. The potential exportable surplus generated only by these two products combined could produce 70 billion liters of bioethanol, plus a series of byproducts with high value added, such as DDGS, WDGS, corn oil, bioelectricity, biofertilizers, cellulosic paper, etc.
The production potential of other raw materials, such as lignocellulosic material, place the con-tinent in an even more privileged position. The future evolution of technologies and production costs will constitute a determining factor to expand the contribution of biofuels through the use of alternative raw materials. Certain estimations21 indicate that the potential of this type of raw material could translate into 442 billion liters of bioethanol produced globally, with a significant contribution from the Americas.
On the other hand, the hemisphere exports 72% of the world’s soybean oil and 5% of the palm oil. It also exports 96% of the soy that can be industrialized to produce approximately 20 billion liters of soybean oil and nearly 100 million tons of byproducts for human or animal consumption (protein flours, pellets, expeller, etc.). These resources provide the hemisphere with the potential to produce 31 billion liters of biodiesel22.
20 This type of engine allows the use of gasoline or bioethanol indistinctly. 21 See, for example, Mendes Souza et al.2015.
Figure 23: Contribution of exportable surplus of the Americas to the world total (2016).
Source: ITC (TradeMap).
The quantification of the exportable surplus from the raw materials mentioned to produce bioethanol (corn and sugarcane) places more than 15 countries in a good position to replace gasoline with this biofuel. Belize, for instance, could replace its low consumption of gasoline and even generate a high exportable surplus. Argentina, a net exporter of sugar and one of the top world exporters of corn, alre-ady has a bioethanol mix that reaches 12% and could generate more than 10.5 million cubic meters of bioethanol, which surpasses the amount of gasoline consumed.
Other countries such as Cuba, Paraguay and Guatemala have a strong potential to produce biofuels compared to the fossil fuels they consume. On the other hand, Brazil, the world’s top producer and exporter of sugar and second global producer of corn already uses 44% bioethanol in the total fuel it consumes and could industrialize its exportable surplus of corn and sugar to add 47 additional points to this biofuel.
As can be seen in the next graph, the availability of resources to produce bioethanol has great unta-pped potential in several countries of Central and South America. Likewise, the United States, which consumes 72% of the continent’s gasoline, could contribute an additional 4 points in bioethanol, with a basis of 10% of current use. This additional 4% would be equal to, in terms of volume, approximately 40% of the gasoline currently consumed by Mexico, the fourth largest consumer after the United States, Canada and Brazil.
Figure 24: Potential bioethanol production based on exportable surplus for corn and sugarcane (expressed as percentage of the gasoline consumed internally).
Source: Prepared based on data from IEAe ITC (TradeMap).
On the other hand, the potential of soybean and palm to produce biofuels is concentrated in more than ten countries. Paraguay could replace 90% of its consumption of fossil-based diesel with biodiesel if it manages to industrialize all the soybean it exports. In order to do this, the country would need to overcome its primary bias and industrialize soybeans in order to have oil available for biodiesel production. Argentina, on the other hand, has one of the most competiti-ve soybean crushing clusters in the world, and is the largest exporter of soybean oil. Moreocompetiti-ver, it exports unprocessed soybean that could also be industrialized. The country, which already has 10% of biodiesel in its mix, could add 41 additional points of this biofuel. Uruguay, on the other hand, exports more than 2 million tons of soy, but with a low level of industrialization. In order to increase biodiesel use, this country could move forward in the processing of soybean. Within the countries with potential, several have exportable surplus of palm oil: Colombia (the main producer in the hemisphere), Honduras, Guatemala, Costa Rica and Ecuador, among others. In turn, Brazil and the United States have significant exportable surplus deriving from soybean and soybean oil.
Figure 25. Biodiesel production potential based on exportable surplus of soybeans and soybean and palm oil (as a percentage of the diesel consumed domestically).
Source: Prepared based on data from IEAe ITC (TradeMap).
Based on the exportable surplus of the raw materials described, the hemisphere has the poten-tial to provide 43% of the new world supply of biodiesel and 66% of the bioethanol.
3 Strategies for the development of biofuels and
design of regulatory frameworks.
This chapter briefly describes the regulatory experiences that have contributed to the develop-ment of the biofuel business in selected countries and regions. A general overview is also provi-ded on the world situation with respect to the number of countries that have mandates on the use of biofuels. Finally, the different schemes are outlined, which can be used as a strategy to develop the production and use of biofuels under different types of regulatory frameworks.
3.1 Comparison of different experiences
The development of biofuels in the world has taken place in two different ways: • Mandate markets23
• Non-mandate markets
In the first case, in order to reach the percentage goals with respect to mixes or absolute esta-blished volumes, each country has used different strategies. However, the gist of the matter is that each country must ensure the sale of biofuels at a price that will enable the functioning of the sector, and guarantee that the corresponding enforcement agency properly supervises the manda-tory use of biofuels. In this way, two reference cases are presented; a heavily regulated example (price and amount) and another with a lower level of regulation (where the price is determined by the market).
In the case of mandate-free markets, two different situations are observed. In the first case, the-re athe-re countries that have promoted the mandatory use of biofuels, but whethe-re thethe-re is also a fthe-ree segment: this is the typical case of Brazil with bioethanol, where there is a mandatory market for gasoline and at the same time a segment where hydrated alcohol competes directly with its substi-tute. There are also cases of mandate-free markets, but which award special benefits to those who use biofuels, ranging from differential taxes to decarbonization bonds. One example was the use of the E85 in Sweden, which was tax-free until 2016. The second example of a market with no mandate is observed in those countries where the use of biofuels has not been promoted and there is no system of promotion, and where the development of the industry and the sale of products
occur only if they are price-competitive with respect to fossil fuels. The most relevant examples of this type of market are observed in Africa with biodiesel, where in certain cases the price of biodiesel was lower than its fossil fuel counterpart, which led to its unrestricted use.
Below is an outline of the development of biofuels in the European Union, the United States and Brazil.
3.1.1 European Union (UE)
The EU policy was developed pursuant to Directive No 2003/30/CE, which allowed the mem-ber states to establish national objectives defining the minimum proportion of biofuels to be used, but taking an indicative reference value of 2% as at December 2005 and of 5.75% as at 2010, applicable to the transportation segment. In 2015, the legislation changed this to 7% as a goal for 2020 for first-generation biofuels. This goal is periodically reviewed.
Furthermore, a subsidy of € 45 per hectare for energy crops was established (for example, rape-seed for biodiesel or grains for bioethanol), with a maximum surface area of 1,500,000 hectares, for replacing a fossil fuel with a renewable, agricultural-based source. The subsidy was based on a purchase agreement between the farmer and the downstream sector.
The EU moved forward with respect to the implementation of a reference market with mix levels and prices that were based on the case of Rotterdam, where prices are determined between buyers and sellers. In this way, EU producers must compete against the biodiesel import parity (being net importers of this product).
Under this scheme, reference prices that are influenced by external markets have rendered many European producers uncompetitive, with the industry operating at 40%, given the small scale of the plants and their disadvantages in the face of other competitors such as Argentina and Indone-sia.
Recently, the second Renewable Energy Directive (REN II) set the maximum limit for con-ventional biofuels at 7% by 2030 and defined a goal of 3.5% for advanced biofuels for the same year. It also established a minimum mandate requirement for transportation of 0.5% in the use of advanced biofuels for 2020. The data indicates that the percentage of biodiesel mix during 2018 reached 5.8% in the eurozone, and 3.6% in the case of bioethanol.
Finally, the recent quality directives (FQD) set a ceiling of 10% if ethanol is used as an oxyge-nating agent, and also established limits for palm- and soybean-based biodiesel.