Science Arts & Métiers (SAM)
is an open access repository that collects the work of Arts et Métiers Institute of
Technology researchers and makes it freely available over the web where possible.
This is an author-deposited version published in:
https://sam.ensam.eu
Handle ID: .
http://hdl.handle.net/10985/10297
To cite this version :
Shoko WAKAMIYA, Lamia BELOUAER, David BROSSET, Yukiko KAWAI, Christophe
CLARAMUNT, Kazutoshi SUMIYA Exploring Geographical Crowd’s Emotions with Twitter
-DBSJ journal - Vol. 13, n°1, p.77-82 - 2015
Exploring Geographical Crowd’s
Emotions with Twitter
Shoko
WAKAMIYA
1Lamia
BELOUAER
2David BROSSET
2Yukiko
KAWAI
1Christophe
CLARAMUNT
2Kazutoshi SUMIYA
3The research introduced in this paper develops a semantic model whose objective is to analyze the geographical and emotion-based distribution of tweets at a large country scale. The approach extracts and categorizes tweets based on semantic orientations of terms in a dictionary, and explores their spatial and temporal distribution. Tweets are classified into different emotional classes, qualified and valued using different interval distributions that favor identification of significant trends that are compared to some of the main properties of the underlying geographical space. The whole approach is applied to a large tweets database in Japan, and illustrated by some experimental but real data that trigger some surprising and puzzling outcomes that are discussed in the paper.
1. Introduction
Self-emerging social networks constitute extremely rich data and information environments that offer several avenues for an analysis of the patterns that emerge. Many of these social networks are geographically distributed, this providing novel opportunities; but also novel research challenges for geographical and information sciences. These social and spatial networks are under rapid development and continue to evolve as major platforms of human ideas, thoughts, and activities. These networks allow humans worldwide to share and communicate thoughts, ideas, opinions, and so on. Since, these tools are used by individuals to broadcast their day-to-day happenings, or to report on an external event of interest. Such contents can reflect emotions/moods from personal to global scales.
Twitter encapsulates a large amount of data collected from a popular social medium. It now serves as an information and communications hub for millions who seek news, conversation or just amusement. Tweets are restricted to 140 characters or fewer, and they can be retweeted by anyone, provided they are in the public stream. Studies on tweets have primarily focused on studying trends of use of positive and negative words, sentiment extraction from posts based on linguistic
1 Member, Kyoto Sangyo University
{shokow, kawai}@cc.kyoto-su.ac.jp
2 French Naval Academy Research Institute
{lamia.belouaer, david.brosset, christophe.claramunt}@ecole-navale.fr
3 Member, University of Hyogo
features [1], sentiment classification [8], as well as sentiment flow in networks [10]. The information communicated through Twitter conveys the interests and opinions of individuals, and reveals links and the complex structure of social networks. However, this information is only partially exploited if one does not consider its geographical aspect. Since, Twitter feeds more often than not have some sort of geographic content. For instance, tweets may communicate the location from where a particular report is generated, people can use mobile phones and Twitter to quickly organize a protest event before authorities can stop it.
Understanding and studying the relationship between emotions that emerge from tweets and the geographical dimension is worth being explored for many socio-economical, transportation and urban studies to mention a few examples. Emotions and moods play a critical role in our everyday lives, fundamentally directing our attentions and responses to environment, framing our attitudes and impacting our social relationships. Consumer research, health care, urban development, etc. are just a few of the domains that would benefit from social network/media tools that can track some population behaviors. However, little attention has been directed towards the geographical, temporal and semantic analysis of the way self-emerging social networks.
This paper introduces a modelling approach that explores the geographical and temporal distribution of emotions observed through geo-tagged tweets over Twitter. The approach is grounded on a semantic extraction of the terms identified in tweets messages, those being classified and valued by an emotion dictionary introduced in a related work [15]. Tweets are classified at two levels of abstraction: 1) a 5-level categorization of the terms and 2) score-based aggregation of the terms.
The remainder of this paper is as follows. Section 2 introduces related work. Section 3 describes the main modelling principles behind our approach, and whose objective is to extract and categorize the emotions generated from crowd’s located tweets. Section 4 presents the experiments conducted, and applied to a large tweets database in Japan, and discusses some of the main findings. Finally, Section 5 concludes the paper and outlines further work.
2. Related Work
Emotions are central to the expression of human thoughts, ideas and opinions, and in turn impact their attitudes and behaviors. An increasing amount of work in the social network and media domains have been recently oriented to the analysis and understanding of the role of emotions in human behavior [12, 18]. Several recent studies have been oriented to the detection and classification of positive and negative sentiments reflected by tweets in order to better understand the polarity of human opinions on various topics and contexts. For instance, [5] studied how individual mood varies from hour-to-hour, day-to-day, and across seasons and cultures by measuring positive and negative emotions and moods in Twitter posts. In [3], more than 200 moods have been extracted from tweets, based on psychology research, and
in order to derive a representation of the human mood landscape. The principle behind this approach is to classify the terms and moods identified according to an emotion-based dictionary. Several recent dictionary-based approaches have been oriented to the analysis, clustering and prediction of sentiments and emotions expressed by tweets [2, 7, 16]. However, and to the best of our knowledge, little attention has been directed towards a better understanding of how emotions derived from tweets at a large scale can be associated to human behaviors, and how those are expressed in space and time. In fact, tweets are implicitly or explicitly broadcasted from space and time. In [4] the origins and pathways of tweets in the US have been studied, and how those reflect local consumption behaviors and clusters, and reveal that those coincide with major air traffic hubs. The spatial variability and structure of population’s response to various stimuli such as large scale sportive, political or cultural events have been also studied [6, 13].At a larger scale, the large implicit database that can be constructed from tweets can reveal users’ movement patterns, city and transportation activities, and temporal variations in time [14]. However, the exploration of emotion patterns in space and time, and how those emerge at different scales and granularities, as well as the relationship with the underlying properties and events that arise in geographical spaces is still a direction to explore. In [11], Mislove et al. spatio-temporally explore the pulse of mood throughout the day using Twitter. Although the aim of this study is quite similar with the one of this paper, we attempt to analyze the semantics which are contained in the tweets, particularly positive and negative emotions.
In our previous work [17], crowd-sourced distances between locations were derived by observing crowd’s movements as inferred from tweets. However, the semantics that emerge from these tweets were not considered. The modelling approach was mainly based on time stamps and geographical coordinates. The approach retained in this paper extends our preliminary work by analyzing the semantics contained in the tweets, particularly positive and negative emotions. This will allow to qualitatively explore and evaluate reasonable crowd-sourced cognition emitted by tweets, as well as the relationships between these tweets and the place and time where and when those tweets were broadcasted.
3. Modeling Approach
This section develops the modeling principles retained for extracting and categorizing emotions that emerge from crowd’s located tweets. Our idea is to explore the spatio-temporal dynamics of crowd’s emotions when compared to the underlying properties of the geographical space. Tweets have some specific properties, very different per nature: first tweets can be considered as a sort of big data when considering the amount of tweets emitted for a given region and period of time. On the other hand, the length of the textual message of each tweet is limited to less than 140 characters, this offering several manipulation capabilities regarding the semantics that emerges.
A tweet T1 can be modeled as a data tuple that
represents the user ID u1, timestamp t1, location l1, and
textual message m1 as follows: T1=<u1, t1, l1, m1>. This
means that a tweet T1 is triggered from one location l1 by
a given user u1 at a given time t1. Moreover, this modeling
approach is extended by aggregating the emotions that emerge in each tweet, either positive or negative (e.g., e1,
e2) which are extracted from tweet messages: u1 = (<T1, t1,
l1, e1>, <T2, t2, l2, e2>, ...).
In order to extract the semantics that emerges from tweets, we focus on the most frequent emotions. For this, we classify tweets by applying two levels of abstraction: 1) a 5-level categorization of the semantic terms and 2) score-based aggregation of the semantic terms. In order to extract emotions from respective tweets, a dictionary of semantic orientations of words introduced in a related work [15] is used as a non-sensitive reference and dictionary.
This dictionary is made of triplets; a term, its main part of speech, a qualitative evaluation of the emotions broadcasted from -1.0 to 1.0 which are computed by extracting average semantic orientations (positive or negative) of respective words. For instance, (“surpass”, verb, 1.0), (“good”, adjective, 0.999995), (“generosity”, noun, 0.509142), (“order”, verb, -0.509892), (“disease”, noun, -0.999998), and (“bad”, adjective, -1.0). Here, when the value of a word is 1.0, its semantic orientation is positive. On the other hand, when the value of a word is -1.0, it means the semantic orientation of the word is negative.
When a tweet is given, our method first splits it towards terms using a morphological analyzer. Therefore, we determine whether each term is in the dictionary and extract its semantic value when available. Next, we classify the terms based on their semantic values into positive and negative categories as the first method. Here, if the semantic value of a term is larger than 0, it is classified into a positive category. On the other hand, if its value is smaller than 0, it belongs to a negative group.
For a first exploration, tweets are classified based on the number of positive/negative terms with respect to the emotional classes; Very Positive (VP), Positive (P), Neutral (Neut), Negative (N), Very Negative (VN). Then the number of terms in each group is counted as follows:
) 1 ( ) ( ) ( ) (mi PosTermsmi NegTermsmi CountEmo 2 ) ( if 1 ) ( if 0 ) ( if 1 ) ( if 2 ) ( if i i i i i m CountEmo VN m CountEmo N m CountEmo Neut m CountEmo P m CountEmo VP
where, a function CountEmo(:) evaluates the superior emotional direction of a given tweet’s message mi by
computing the difference between the number of positive terms |PosTerms(:)| and the number of negative terms calculated |NegTerms(:)|. Overall, each tweet is categorized according to the derived value of emotion count. For instance, a message “I’m very happy” has two semantic terms; “very” and “happy” and the values of the
words are -0.169067 and 0.995837, respectively, according to the dictionary. Then, on the basis of their semantic values, the message has one negative word and one positive word, and both |PosTerms(m)| and |NegTerms(m)|are 1. As a result, the message is classified into the category Neut, because CountEmo(m)
becomes 0.
Then, in order to normalize all values of the 5-level categorization introduced previously, we apply the second method based on emotion scores as follows:
(2) 5 . 0 ) ( 1.0 -if 0 ) ( 0.5 -if 0 ) ( if 5 . 0 ) ( 0 if 0 . 1 ) ( 0.5 if i i i i i m ScoreEmo VN m ScoreEmo N m ScoreEmo Neut m ScoreEmo P m ScoreEmo VP
where, a function ScoreEmo(:) computes the sum of the average values of scores of positive terms and the average values of scores of negative terms. For instance, the message “I’m very happy” has two emotional words; “very” and “happy” and their values are -0.169067 and 0.995837, respectively, according to the emotional dictionary. In this case, ScoreEmo(m) is 0.82677 by the sum of the values, so the message is classified into the category P.
The main property of the second approach is that it allows to take into account all emotions that are broadcasted in a given tweet. The emotion values derived are refined and give a more balanced emotion value, in contrast to the generic approach previous retained where the most prominent emotion is taken into account. The experimental section will explore the respective properties and advantages of the two approaches.
4. Experimental Study
4.1 Results
The modeling approach introduced in the previous section has been applied to an experimental but a real large database of Japanese tweets. In order to obtain massive numbers of tweets with geographic coordinates from Twitter, a geographic tweets monitoring system has been
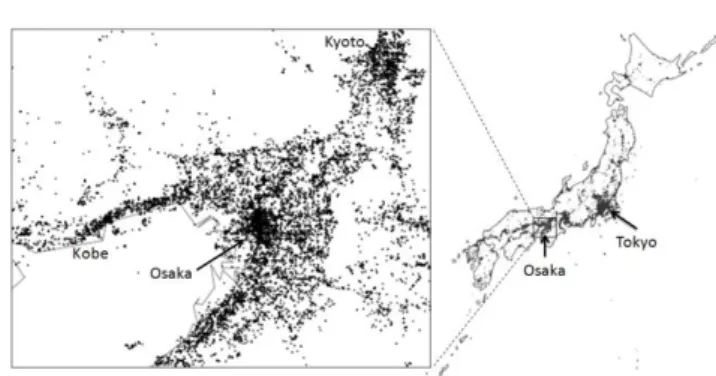
used in [9]. A quad tree data structure was applied to spatially distribute tweets and derived a form of density-based map. This allowed to collect about 0.2 millions geo-tagged tweets on a daily basis as shown in Figure 1. In this figure, dotted points represent locations of the collected geo-tagged tweets in Japan. It clearly appears that high density locations are found in urban areas such as Tokyo, Osaka, Kyoto, and Kobe.
The objective of this experiment is to observe spatio-temporal distribution of crowd’s emotions in a local area around Osaka. Therefore, geo-tagged tweets around Osaka had been extracted from the database over one week period. The two classifications have been applied to study the emotions that emerge. The terms of each tweet were analyzed by the Japanese morphological analyzer, Mecab4. The semantic orientations of respective terms
were valued by matching them to the index words of the dictionary as suggested in [15].
When applying the first classification, emotions for each tweet are aggregated to either a positive or negative based on the number of positive and negative terms (Equation (1)). Specifically, the semantic orientation of each tweet is the difference of positive and negative emotion values. For this, we collected geo-tagged tweets emitted in the region around Osaka between Tuesday, June 18, 2013 and Monday, June 24, 2013. We could on average extract 51,840 geo-tagged tweets on a weekday and 99,255 geo-tagged tweets on a weekend, respectively. Table 1 shows the number of geo-tagged tweets classified into five crowd’s emotions by the first method. Figure 2 shows geographic distributions of tweets classified into five emotional classes on Saturday, Jane 22. The table and figure showed a clear predominance of negative emotions over positive emotions. Furthermore, we could observe positive emotions are more predominant in urban centers such as Osaka and Kyoto, especially over the weekend as
4 Mecab: http://mecab.googlecode.com/svn/trunk/mecab/
doc/index.html
Table 1. The number of geo-tagged tweets classified into five emotional classes by first method.
Date VP P Nuet N VN Total
Tue, Jun. 18 197 1,482 19,481 9,995 13,583 44,738 Wed, Jun. 19 164 1,454 18,609 9,155 13,373 42,755 Thu, Jun. 20 198 1,556 20,933 10,447 14,919 48,053 Fri, Jun. 21 301 2,343 30,896 14,941 20,271 68,752 Sat, Jun. 22 505 3,540 51,176 22,915 30,376 108,512 Sun, Jun. 23 380 2,889 42,719 18,855 25,154 89,997 Mon, Jun. 24 226 1,630 25,684 116,112 15,751 54,903
Table 2. The number of geo-tagged tweets classified into five emotional classes by second method.
Date VP P Nuet N VN Total
Tue, Jun. 18 1,098 2,687 37,959 2,072 922 44,738 Wed, Jun. 19 928 2,464 36,545 1,972 846 42,755 Thu, Jun. 20 1,098 2,721 41,138 2,161 944 48,053 Fri, Jun. 21 1,675 3,932 58,587 3,222 1,336 68,752 Sat, Jun. 22 2,448 5,910 92,983 5,027 2,144 108,512 Sun, Jun. 23 1,886 4,785 77,456 4,170 1,800 89,997 Mon, Jun. 24 1,229 2,939 47,218 2,406 1,111 54,903
Figure 1. Geographic distribution of geo-tagged tweets.
) ( ) ( ) ( ) ( ) ( i i i i i m NegTerms m rms ScoreNegTe m PosTerms m rms ScorePosTe m ScoreEmo
shown in Figure 2 (a) and (b).
When applying the second classification, emotions are normalized for each tweet based on the respective score of positive/negative words (Equation (2)). Table 2 shows the number of geo-tagged tweets classified into five crowd’s emotions by the second method. Figure 3 shows geographic distributions of tweets aggregated into five emotional classes on Saturday, Jane 22. This approach
favors a more balanced valuation of the different terms and then of the overall emotion value that emerges from each tweet. In order to compare with crowd’s emotions on the weekday and the weekend in detail, we show geographic distributions of two emotional classes; Very Positive (VP) and Very Negative (VN) on Friday, June 21 an example of weekdays and Saturday, June 22 as an example of weekends as illustrated in Figures 4 and 5. In Figure 5. Geographic distributions of Very Positive (VP) (dark blue points) and Very Negative (VN) (red points) on Saturday, June 22, 2013.
Figure 4. Geographic distributions of Very Positive (VP) (dark blue points) and Very Negative (VN) (red points) on Friday, June 21, 2013.
Figure 2. Geographic distributions of crowd’s emotions aggregated by the first approach on Saturday, June 22, 2013.
Figures 4 and 5, locations of VP are in crowded areas around Osaka station, Nanba station, and on the north of Kyoto station on both the weekday and the weekend, this is probably reflecting the fact that these areas are multifunctional areas including downtowns and lots of famous sightseeing places for not only tourists but also working people and local residents. Although we cannot identify types of crowds who emitted the tweets in these areas whether tourists, working people, or local residents, this results show that these areas are potentially places where humans are more likely to express positive emotions. On the other hand, we could find a different pattern which appears in an area around Kobe station; there were lots of locations of VN on the weekday (in Figure 4) and crowd’s emotion VP became superior to VN
on the weekend (in Figure 5). We consider that it was caused by the fact that many people work in this area on weekdays because there are lots of office buildings and weekends are their off-days.In addition, we could observe another pattern which would be caused by different functions of locations such as urban centers and bedroom towns.Specifically, in bedroom towns in Kobe and Osaka such as Ashiya city, Nishinomiya city, Toyonaka city, Suita city, and Sakai city as shown in Table 3, there were some locations of VP on the weekday, but crowd’s emotion at these locations changed to VN on the weekend as shown in Figure 5. At other locations in suburban areas, we could observe more VN than VP on the weekend.
4.2 Discussion
We discuss the results of this experimental study which applied our proposed methods for aggregating crowd’s emotion to a tweets database and explored spatio-temporal patterns of crowd’s emotions in a local area of Japan. A first noteworthy result of the first method is that there is a clear predominance of negative emotions over positive emotions. From the point of view of geographic distributions of crowd’s emotions, we could observe positive emotions are more predominant in urban centers, especially over the weekend. Against the results of the first approach which were inclined towards negative emotions, we could obtain the reasonable results of the second method which successfully normalized too biased crowd’s emotions, though there were still negative emotions over positive ones. From these results, we could confirm one common trend is that the tweets emitted generally follow some spatio-temporal patterns based on the difference of functions of places as shown in Table 3; people emit VP emotion when they are out on both weekdays and weekends, and they emit VN emotion when they are at home, especially on weekends.
The proposed approaches are still preliminary but allow to observe several valuable trends. First one significant pattern is that the geography that emerges from this large tweet database matches very much the main urban and suburbs as reflected by the experimental study. This is not a completely surprising result as humans are more likely to broadcast tweets, and as the higher the population the higher the probability to have tweets broadcasted. However, the approach offers some promising avenues of research to study temporal and spatial differences, as well
as the impact of specific events in the distribution of tweets (typically in the case of a disaster or emergency to study how people react in such situations). One specific trend that appears in the study developed is the importance of negative emotions when the most significant terms are retained. Of course this preliminary result should be confirmed by a more precise analysis of the semantics behind the tweets by confronting our results with a close examination of a sample of tweets, as this is confirmed by the more balanced results of the second approach. This is one of direction we plan to explore when extending our experimental study.
5. Conclusions
This paper introduced a modeling approach for the analysis of the spatial and temporal distribution of the emotions that emerge from tweets in a large geographical area. The principles behind was to extract and categorize tweet terms using an emotional dictionary. Two approaches were developed, first sentiments were aggregated in each tweet based on the number of positive/negative terms. The objective of the second approach was to normalize the bias of the number of terms by scoring the semantic directions of emotional terms in each tweet. The modeling approach had been experimented thanks to a specific sentiment dictionary developed in a related work. Tweets were categorized according to the emotions’ patterns that emerge and then allows for an exploration of positive and negative patterns in space and time.
In future work, we will conduct statistical testing to verify whether the differences observed by the experimental study are statistically significant. Furthermore, we plan to develop the modeling approach and to explore some novel directions such as the application of a multi-criteria valuation of negative and positive terms in each tweet. Additionally we plan to consider tweets followers as emotions can be distributed from humans to humans. This will add a social network component and this many avenues of research. In addition we will consider further semantics which can be extracted from social networks such as followers, because emotions may distribute from a user to others. Then, we try to find any patterns of spatio-temporal semantic distribution based on topics such as geo-social events.
[Acknowledgments]
This work was supported by the Strategic Information and Communications R&D Promotion Programme (SCOPE) of the Ministry of Internal Affairs and Communications of Japan, and JSPS KAKENHI Grant Number 26280042.
Table 3. Functions of places.
Function Place name
Osaka Station, Kyoto Station Nanba Station, Kobe Station Ashiya city, Nishinomiya city Toyonaka city, Suita city, Sakai city Urban centers
[References]
[1] Barbosa, L., Feng, J.: Robust Sentiment Detection on Twitter from Biased and Noisy Data. In: Proc. of the 23rd International Conference on Computational Linguistics: Posters (COLING ‘10), pp. 36-44 (2010) [2] Bollen, J., Mao, H., Pepe, A.: Modeling Public Mood
and Emotion: Twitter Sentiment and Socio-Economic Phenomena. In: Proc. of the Fifth International AAAI Conference on Weblogs and Social Media (ICWSM), pp. 450-453 (2011)
[3] Choudhury, M. D., Counts, S., Gamon, M.: Not all moods are created equal! exploring human emotional states in social media. In: Proc. of the Sixth International AAAI Conference on Weblogs and Social Media, pp. 66-73 (2012)
[4] Ferrara, E., Varol, O., Menczer, F., Flammini, A.: Traveling trends: social butterflies or frequent fliers? In: Proc. of the first ACM conference on Online social networks, pp. 213-222 (2013)
[5] Golder, S. A., Macy, M. W.: Diurnal and Seasonal Mood Vary with Work, Sleep, and Daylength Across Diverse Cultures. In: Science vol. 333, no. 6051, pp. 1878-1881 (2011)
[6] Kim, H.-G., Lee, S., Kyeong, S.: Discovering hot topics using Twitter streaming data: social topic detection and geographic clustering. In: Proc. of the 2013 IEEE/ACM International Conference on Advances in Social Networks Analysis and Mining, pp. 1215-1220 (2013) [7] Kivran-Swaine, F., Naaman, M.: Network properties
and social sharing of emotions in social awareness streams. In: Proc. of the ACM 2011 conference on Computer supported cooperative work (CSCW ‘11). pp. 379-382 (2011)
[8] Kontopoulos, E., Berberidis, C., Dergiades, T., Bassiliades, N.: Ontology-based Sentiment Analysis of Twitter Posts. In: Expert System Application, vol. 40, no. 10, pp. 4065-4074 (2013)
[9] Lee, R., Wakamiya, S., and Sumiya, K.: Discovery of unusual regional social activities using geo-tagged microblogs. In: World Wide Web, vol. 15, no. 4, pp. 321-349 (2011)
[10] Mahalia, M., Conal, S., Daniel, W., Jure, L., Christopher, P.: Sentiment Flow Through Hyperlink Networks. In: Proc. of the Fifth International AAAI Conference on Weblogs and Social Media (ICWSM), pp. 550-553 (2011)
[11] Mislove, A., Lehmann, S., Ahn, Y.-Y., Onnela, J.-P., Rosenquist, J. N.: Pulse of the nation: US mood throughout the day inferred from twitter. http://www.ccs. neu.edu/home/amislove/twittermood/
[12] Palmer, A., Nicole K.-L.: The effects of pre-enrolment emotions and peer group interaction on students’ satisfaction. In: Journal of Marketing Management, vol. 27, no. 11-12, pp. 1208-1231 (2011)
[13] Pozdnoukhov, A., Kaiser, C.: Space-time Dynamics of Topics in Streaming Text. In: Proc. of the 3rd ACM SIGSPATIAL International Workshop on Location- Based Social Networks, pp. 1-8 (2011)
[14] Silva, T. H., Vaz de Melo, P. OS., Almeida, J. M., Salles, J., Loureiro, A. AF.: A comparison of Foursquare and Instagram to the study of city dynamics and urban social behavior. In: Proc. of the 2nd ACM SIGKDD
International Workshop on Urban Computing, pp. 4:1-4:8 (2013)
[15] Takamura, H., Inui, T., Okumura, M.: Extracting Semantic Orientations of Words Using Spin Model. In: Proc. of the 43rd Annual Meeting on Association for Computational Linguistics, pp. 133-140 (2005)
[16] Tsagkalidou, K., Koutsonikola, V., Vakali, A., Kafetsios, K.: Emotional Aware Clustering on Micro-blogging Sources. In: Proc. of the 4th International Conference on Affective Computing and Intelligent Interaction - Vol. Part I, pp. 387-396 (2011) [17] Wakamiya, S., Lee, R., Sumiya, K.: Social-Urban
Neighborhood Search Based on Crowd Footprints Network In: Proc. of the Fifth International Conference on Social Informatics (SocInfo2013), pp. 429-442 (2013) [18] Yang, L., Yang, H.: Research on Characteristics and
Reasons of Current Internet Group Events. In: Proc. of International Academic Workshop on Social Science (IAW-SC-13), pp. 980-983 (2013)
Shoko WAKAMIYA
She is a researcher in Kyoto Sangyo University. She received a Ph.D. degree in Human Science and Environment from University of Hyogo in 2013. Her research interests include socio-geographic mining and user-generated contents analysis.
Lamia BELOUAER
She is a lecturer in Naval Academy Research Institute, France. She received a Ph.D. degree in University of Caen. Her interests are in Artificial Intelligence, especially knowledge representation and decision processes and their applications to agents.
David BROSSET
He is an assistant professor in computer science at the Naval Academy Research Institute in France. He received a Ph.D in computer science from the Arts & Métiers ParisTech school. His research is focused on geographical information science applied to several domains such as social networks, renewable marine energy or cybersecurity.
Yukiko KAWAI
She is an Associate professor in Kyoto Sangyo University. She received a Ph.D. in Engineering, Nara Institute of Science and Technology. Her research is personalization, information search, developments of next generation Web applications and information-fusion technology.
Christophe CLARAMUNT
He is a professor in computer science and chair of the Naval Academy Research Institute in France. He holds a Ph.D. in Computer Science from the University of Burgundy, France. His research is oriented towards theoretical and pluri-disciplinary aspects of geographical information science.
Kazutoshi SUMIYA
He is a Professor at School of Human Science and Environment, University of Hyogo. He received the Ph.D. degree in Engineering in 1998 from the Kobe University Graduate School of Science and Technology. His research interests include web information systems, spatio- temporal database, and multimedia databases.