A MULTI-SECTOR PLANNING SUPPORT MODEL FOR EN ROUTE AIR TRAFFIC CONTROL
MOHAMED OSSAMA HASSAN
DÉPARTEMENT DE MATHÉMATIQUES ET DE GÉNIE INDUSTRIEL ÉCOLE POLYTECHNIQUE DE MONTRÉAL
THÈSE PRÉSENTÉE EN VUE DE L’OBTENTION DU DIPLÔME DE PHILOSOPHIÆ DOCTOR
(GÉNIE INDUSTRIEL) DÉCEMBRE 2017
ÉCOLE POLYTECHNIQUE DE MONTRÉAL
Cette thèse intitulée :
A MULTI-SECTOR PLANNING SUPPORT MODEL FOR EN ROUTE AIR TRAFFIC CONTROL
présentée par : HASSAN Mohamed Ossama
en vue de l’obtention du diplôme de : Philosophiæ Doctor a été dûment acceptée par le jury d’examen constitué de :
M. SOUMIS François, Ph. D., président
M. SAUCIER Antoine, Ph. D., membre et directeur de recherche Mme YACOUT Soumaya, D. Sc., membre et codirectrice de recherche M. DESAULNIERS Guy, Ph. D., membre
DEDICATION
To the memory of my grandmother Fawkia El Maraghy, who taught me the true meaning of perseverance and that there is no excuse for not learning . . .
ACKNOWLEDGEMENTS
I wish to express my heartfelt gratitude and appreciation to my director Professor Antoine Saucier for his continuous guidance, thorough remarks and availability, which enabled me to complete and present this work. Throughout my Ph.D. program, he was an example for the professor I wish to be.
I also wish to thank my co-director Professor Soumaya Yacout for both her moral and scien-tific support. She always pushed me and encouraged me to do my best. She shared with me her knowledge and experience, her advices on both my work and my life were always of a great help. For her I will always be grateful.
I owe Professor François Soumis special thanks as he was the one who advised me to look into the topic of this work.
Many thanks also goes to my colleagues Wissem Maazoun and Ahmed Ragab for their help and advices that improved this work.
I also thank the Thales group, RAAS and Air Canada companies as well as the NSERC and CRIAQ funds who financially supported this project.
I would like to extend my thanks to the jury members Professor François Soumis, Professor Guy Desaulniers and Professor Daniel Delahaye to take the time to evaluate this work. Last but not least, my sincere appreciation to my mother and my father who have been my role models throughout my life, there are no words who can describe my gratitude to them. My utmost gratitude to my beloved wife for her unconditional support, comprehension and patience throughout the years I took to finish this work.
RÉSUMÉ
Le concept de planification multisectorielle (PM) a été récemment introduit dans le contrôle du trafic aérien. Ce concept consiste à remplacer le contrôleur de planification par un pla-nificateur multisectoriel (PrM). Le PrM est responsable des tâches de planification dans un ensemble de secteurs adjacents. L’objectif principal du PrM est de minimiser et d’équilibrer la charge de travail des contrôleurs entre les secteurs. Le PrM a besoin d’outils d’aide à la décision pour l’aider à accomplir ses tâches. L’objectif de cette thèse est de fournir au PrM un modèle d’aide à la décision qui minimise et équilibre la charge de travail des contrôleurs dans un ensemble de secteurs en route sur un horizon de temps moyen, soit 20 à 90 minutes. On propose une définition complète du problème de la résolution de la complexité, qui est une mesure de la charge de travail, dans le contexte de la PM. On représente la charge de travail des contrôleurs par le nombre de conflits. Pour obtenir des solutions optimales rapidement pour des problèmes impliquant de nombreux avions (par exemple 200), nous avons choisi d’utiliser un modèle de programmation linéaire mixte. Notre modèle minimise et équilibre le nombre des conflits de croisement et de rattrapage avec le nombre minimum de trajectoires modifiées. Nous présentons une formulation linéaire pour la détection et la résolution des conflits de croisement et de rattrapage. Notre formulation repose sur une transformation des distances de séparation en temps de séparation, et consiste à examiner ces temps en utili-sant des contraintes linéaires. Nous avons aussi proposé une première méthode permettant d’équilibrer le nombre de conflits entre les secteurs.
Notre modèle permet l’utilisation de changements de vitesse, de cap et d’altitude. Nous avons formulé le modèle de telle sorte que toutes les combinaisons de ces trois manœuvres puissent être utilisées ou empêchées. Nous avons défini les trois manœuvres pour obtenir des chan-gements minimes du temps de parcours des trajectoires modifiées. Notre modèle ne modifie pas les points d’arrivée et de sortie des avions dans les secteurs.
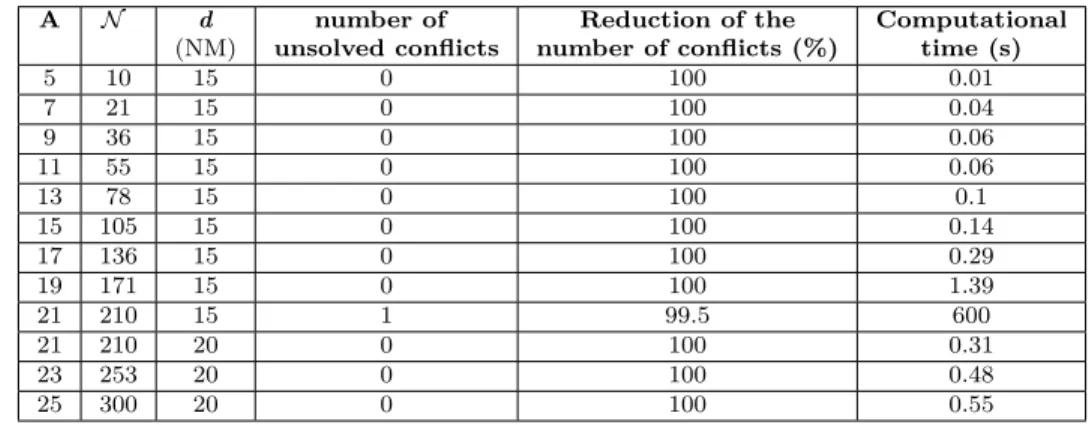
Pour un ensemble de problèmes étalons de détection-résolution de conflits, notre modèle a éliminé 100% des conflits dans des problèmes impliquant 25 avions et 300 conflits simultanés. Ces résultats ont été obtenus en moins d’une seconde de calculs. Pour un ensemble de pro-blèmes de résolution de complexité générés aléatoirement et impliquant jusqu’à 200 avions, notre modèle a éliminé tous les conflits en modifiant moins de 30% des trajectoires. Le retard moyen par trajectoire modifiée était inférieur à 2,5% du temps de parcours.
Nous concluons que notre modèle est un outil efficace pour réduire le nombre de conflits dans un ensemble de secteurs adjacents tout en minimisant le nombre de trajectoires modifiées. Notre modèle permet de calculer des solutions avec le nombre minimum de conflits dans un
temps raisonnable (<10 minutes). Nous avons montré que l’ajout des changements de cap et d’altitude aux changements de vitesse permet de réduire significativement le nombre de conflits non résolus et le nombre de trajectoires modifiées. Nous avons aussi montré que notre méthode d’équilibrage des conflits entre les secteurs permet d’éviter de surcharger l’un des secteurs sans augmenter significativement le nombre total de conflits.
ABSTRACT
The concept of multi-sector planning (MSP) was recently introduced into air traffic control to accommodate the continuous growth of air traffic. This concept consists in replacing the planner controller by a multi-sector planner (MSPr). The MSPr is responsible for the planning tasks in a set of adjacent sectors. The primary aim of the MSPr is to minimize and balance the workload among sectors. The MSPr needs advisory tools and models to help him fulfil his tasks. The main objective of this thesis is to develop a MSP support model that minimizes and balances controllers workload in a set of adjacent en route sectors over a medium time horizon, i.e. 20 to 90 minutes.
We introduce a complete definition of the complexity resolution problem in a MSP context. The complexity is a measure for controllers workload. We choose to measure the controllers workload by the number of conflicts. Since the MSPr deals with many aircraft and requires relatively fast solutions, we formulate our model using a mixed integer linear program. Our model minimizes and balances the crossing and trailing conflicts with the minimum number of modified trajectories. We introduce a linear formulation for the detection and resolution of crossing and trailing conflicts. Our formulation relies on the transformation of safe separation distances into safe separation times and on the examination of the separation times between aircraft using linear constraints. We also propose a first method to take into account workload balancing in the complexity resolution problem.
Our model enables the use of speed, heading and altitude changes. We formulated the model so that any combination of these three manoeuvres can be used or prevented. We defined the three manoeuvres so that the model ensures minimal changes in the travel duration of the modified trajectories. Our model also ensures spatial trajectory recovery.
For a set of conflict detection and resolution benchmark problems, our model eliminates 100% of the conflicts in problems that involve up to 25 aircraft and 300 simultaneous conflicts. The solutions are obtained in less than one second. For a set of randomly generated complexity resolution problems, our model eliminates all the conflicts in problems that involve up to 200 aircraft by modifying less than 30% of the trajectories. The average delay per modified trajectory is less than 2.5% of the travel duration through the multi-sector area.
We conclude that our model is an efficient tool to decrease and balance the total number of conflicts in a set of adjacent sectors using the minimum number of modified trajectories. Our model is able to obtain solutions with the minimum number of conflicts in a reasonable amount of time (<10 minutes). In comparison with the use of only speed changes, the introduction of the heading and altitude changes can reduce significantly the number of
unresolved conflicts and the number of modified trajectories. We also found that our workload balancing method prevents overloading one of the sectors without a significant increase of the total number of conflicts.
TABLE OF CONTENTS DEDICATION . . . iii ACKNOWLEDGEMENTS . . . iv RÉSUMÉ . . . v ABSTRACT . . . vii TABLE OF CONTENTS . . . ix
LIST OF TABLES . . . xii
LIST OF FIGURES . . . xiv
LIST OF SYMBOLS AND ABBREVIATIONS . . . xvii
LIST OF APPENDICES . . . xxiii
CHAPTER 1 INTRODUCTION . . . 1
1.1 Air traffic control . . . 1
1.1.1 Digital communication . . . 4
1.1.2 Flight management system . . . 5
1.1.3 New air traffic control tools . . . 5
1.1.4 Automatic air traffic control . . . 6
1.1.5 Multi-sector planning . . . 6
1.2 Motivation . . . 11
1.3 Objectives . . . 12
1.4 Research approach . . . 12
1.5 Thesis outline . . . 13
CHAPTER 2 LITERATURE REVIEW . . . 14
2.1 Complexity resolution problem . . . 14
2.2 Complexity measures . . . 20
2.3 Conflict detection and resolution . . . 22
CHAPTER 3 MULTI-SECTOR PLANNING FOR CROSSING CONFLICTS . . . 35
3.1 Problem definition . . . 35
3.1.1 Trajectory modification . . . 36
3.1.2 Assumptions . . . 38
3.2 Multi-sector planning support model using speed and heading changes . . . . 40
3.2.1 Input data . . . 42 3.2.2 Decision variables . . . 46 3.2.3 Objective function . . . 47 3.2.4 Constraints . . . 47 3.2.5 MSP-SH/C formulation . . . 54 3.3 Detailed example . . . 56
3.4 Conflict detection and resolution for the circle problem . . . 60
3.5 Numerical experiments . . . 64
3.5.1 Experimental design . . . 65
3.5.2 Computational time . . . 67
3.5.3 Comparison between the performance of each manoeuvre . . . 68
3.5.4 Comparison between the performance of MSP-S/C (large speed) and MSP-SH/C . . . 69
3.5.5 Travel time results . . . 71
3.5.6 Effect of the allowed percentage of modified trajectories . . . 73
3.5.7 Workload balancing tests . . . 75
3.6 Concluding remarks . . . 80
CHAPTER 4 MULTI-SECTOR PLANNING FOR CROSSING AND TRAILING CONFLICTS . . . 81
4.1 Multi-sector planning support model using speed and heading changes for crossing and trailing conflicts . . . 81
4.1.1 Input data . . . 86
4.1.2 Variables . . . 87
4.1.3 Objective function . . . 88
4.1.4 Constraints . . . 89
4.1.5 Trailing conflict prediction constraints . . . 89
4.1.6 Balancing constraint . . . 95
4.1.7 MSP-SH/CT formulation . . . 95
4.2 Detailed example . . . 98
4.2.2 The preprocessing stage output data . . . 99
4.2.3 The optimal solution . . . 99
4.3 Numerical experiments . . . 102
4.3.1 Experimental design . . . 104
4.3.2 Testing the modified objective function . . . 105
4.3.3 Comparison between the performance of each manoeuvre . . . 110
4.3.4 Travel time results . . . 111
4.3.5 Effect of changing the allowed percentage of modified trajectories . . 113
4.3.6 Workload balancing results . . . 115
4.4 Concluding remarks . . . 117
CHAPTER 5 FLIGHT LEVEL CHANGE MANOEUVRE . . . 119
5.1 Multi-sector planning support model using speed, heading and altitude changes for crossing and trailing conflicts . . . 119
5.1.1 Assumptions . . . 119
5.1.2 Variables . . . 121
5.1.3 Constraints . . . 121
5.1.4 MSP-SHA/CT formulation . . . 124
5.2 Detailed example . . . 126
5.2.1 The preprocessing stage input data . . . 127
5.2.2 The preprocessing stage output data . . . 127
5.2.3 The optimal solution . . . 130
5.3 Numerical experiments . . . 133
5.3.1 Comparing altitude modifications to speed and heading changes . . . 133
5.3.2 Comparison between the performance of MSP-SHA/CT and MSP-SH/CT134 5.3.3 Changing the allowed percentage of modified trajectories . . . 136
5.3.4 Effect of the workload balancing factor . . . 138
5.3.5 Concluding remarks . . . 143 CHAPTER 6 CONCLUSION . . . 144 6.1 Summary . . . 144 6.2 Contributions . . . 145 6.3 Future work . . . 146 REFERENCES . . . 148 APPENDICES . . . 157
LIST OF TABLES
Table 1.1 Tasks assignment in the traditional and multi-sector planning configu-rations . . . 9 Table 2.1 Summary of the reported literature on the CDR problem . . . 32 Table 3.1 Flight plans for the detailed example, (x, y) in km and ti(m) in minutes 59 Table 3.2 Flight pairs at risk of a crossing conflict - E . . . . 61 Table 3.3 The values of the decision variables for the optimal solution of the
detailed example- Ti(m) in minutes . . . . 61 Table 3.4 Optimal solution of the detailed example - modified trajectories . . . 62 Table 3.5 Performance of MSP-SH/C on the circle problem with „ = 8° . . . . 63 Table 3.6 Performance of MSP-SH/C on the circle problem with „ = 12° . . . . 64 Table 3.7 Computational time in seconds - –, “ = 0.5 and ⁄ = 4 . . . . 68 Table 3.8 Percentage of resolved conflicts using different model variants- –, “ =
0.5 and ⁄ = 4 . . . . 69 Table 3.9 Percentage of resolved conflicts using MSP-S/C (large) and
MSP-SH/C-–, “ = 0.5 and ⁄ = 4 . . . . 70 Table 3.10 Average delay percentage per modified trajectory . . . 72 Table 4.1 Aircraft cruising speed for the detailed example. . . 98 Table 4.2 Original trajectories for the detailed example : (x, y) in km and ti(m)
in minutes. . . 99 Table 4.3 Alternative flight plans for the detailed example : (x, y) in km and
ti(m) in minutes. . . 101 Table 4.4 The flight plan indicator matrix Ia(i) of the detailed example . . . 101 Table 4.5 Flight pairs at risk of a trailing conflict - ¯E . . . 102 Table 4.6 The values of the decision variables for the optimal solution of the
detailed example- Ti(m) in minutes . . . 103 Table 4.7 The modified trajectories in the optimal solution of the detailed example
. . . 103 Table 4.8 Average number of conflicts per problem. . . 106 Table 4.9 Average percentage of resolved conflicts using the unmodified and
mo-dified objective functions (%). . . 107 Table 4.10 Percentage of modified trajectories using the modified and unmodified
Table 4.11 Computational time in seconds using the modified and unmodified ob-jective functions. . . 109 Table 4.12 Total percentage of resolved conflicts using different model variants. 110 Table 4.13 Percentage of delay per modified trajectory. . . 112 Table 5.1 Original trajectories : (x, y) in km and ti(m) in minutes. . . 127 Table 5.2 Alternative flight plans : (x, y) in km and ti(m) in minutes. . . 129 Table 5.3 Flight plan indicator matrix Ia(i). Note that Ia(i) = 1 if aircraft a can
use flight plan i. . . 129 Table 5.4 Flight plan pairs at risk of a crossing conflict. . . 131 Table 5.5 Flight plan pairs at risk of a trailing conflict. . . 131 Table 5.6 Decision variables P (i) and Ti(m) for the optimal solution : Ti(m) in
minutes. . . 132 Table 5.7 The value of Li(m, k) for the flight plans used in the optimal solution. 132 Table 5.8 The modified trajectories in the optimal solution. . . 132 Table 5.9 Total percentage of resolved conflicts using different modification
ma-noeuvres. . . 134 Table 5.10 Percentage of modified trajectories using different modification
ma-noeuvres. . . 135 Table 5.11 Percentage of resolved conflicts using MSP-SH/CT and MSP-SHA/CT. 135 Table 5.12 Percentage of modified trajectories using MSP-SH/CT and MSP-SHA/CT.
. . . 136 Table 5.13 Computation time in seconds using MSP-SH/CT and MSP-SHA/CT. 136 Table C.1 Flight pairs at risk of a crossing conflict - E. . . 164 Table C.2 Common flight segments parameters. . . 165
LIST OF FIGURES
Figure 1.1 Conflict types . . . 2
Figure 1.2 The semicircular rule . . . 3
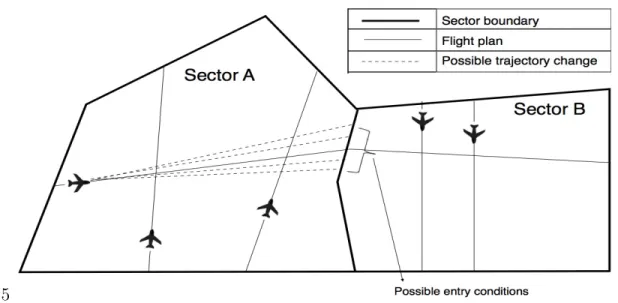
Figure 1.3 Example of a multi-sector area . . . 8
Figure 2.1 Example of a CDR problem in two sectors using heading changes . . 18
Figure 2.2 Geometrical construction of conflict constraints for two aircraft . . . . 24
Figure 2.3 False detection example . . . 25
Figure 2.4 Intersection point of two flight plans . . . 26
Figure 3.1 MSPr support model application scenario. . . 36
Figure 3.2 Example of a heading change manoeuvre. . . 37
Figure 3.3 Predefined heading changes. . . 38
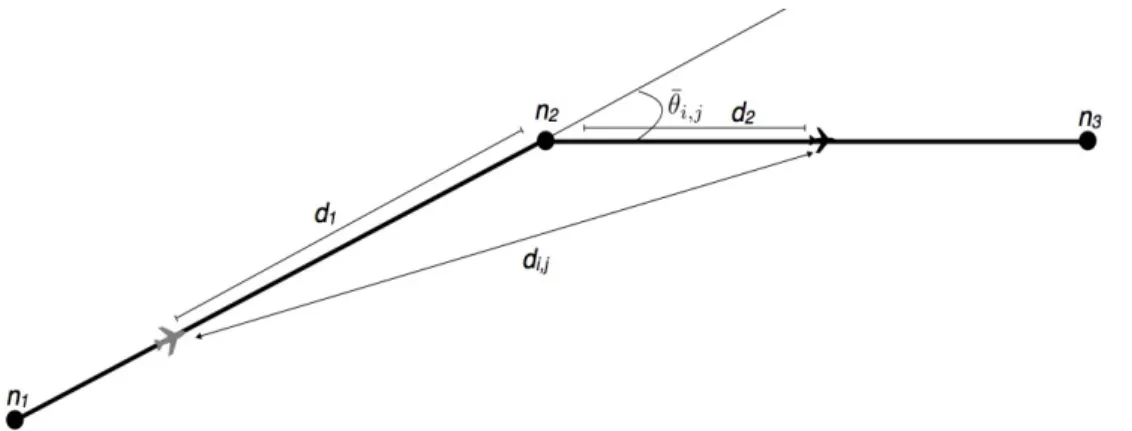
Figure 3.4 The intersection angle ◊i,j between two aircraft. . . 41
Figure 3.5 The minimum separation time for different intersection angles. . . 42
Figure 3.6 Crossing conflict with small ◊i,j : (a) Separation time < Si,j; (b) Sepa-ration time > Si,j. . . . 43
Figure 3.7 Crossing conflict with large ◊i,j : (a) Separation time < Si,j; (b) Sepa-ration time > Si,j. . . . 44
Figure 3.8 Time windows leading to a crossing conflict : (a) intersecting time windows ; (b) and (c) disjoint time windows. . . 45
Figure 3.9 Example of an intersection of two flight plans. . . 52
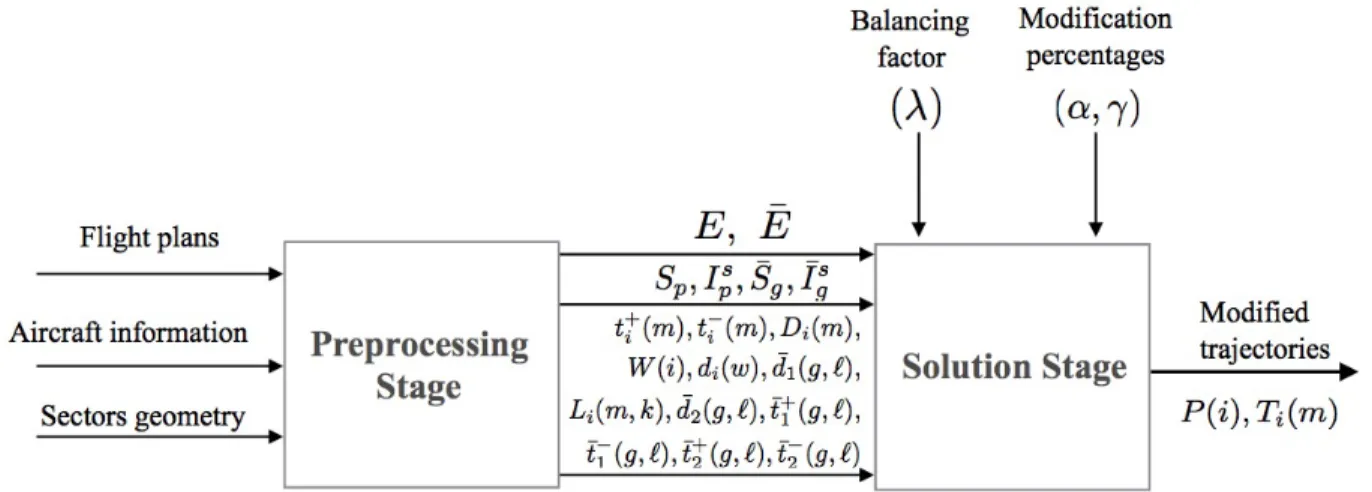
Figure 3.10 IDEF0 for the MSP-SH/C model. . . 56
Figure 3.11 The multi-sector area of the detailed example. . . 56
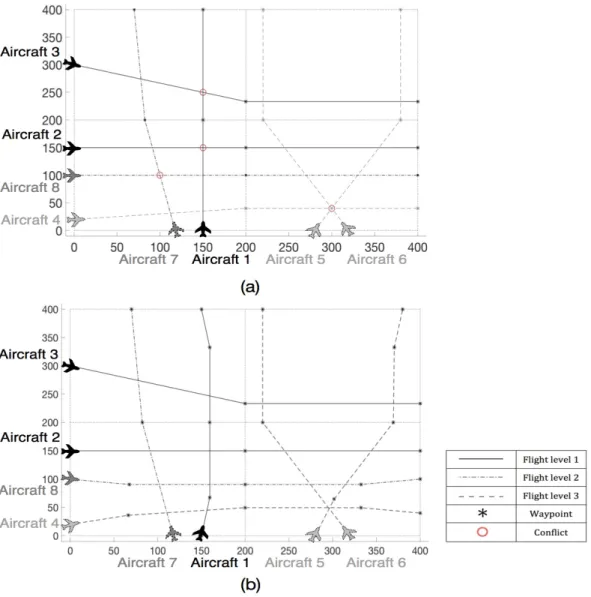
Figure 3.12 Aircraft trajectories for the detailed example : (a) original trajectories ; (b) modified trajectories. . . 58
Figure 3.13 Example of a 7 aircraft circle problem. . . 62
Figure 3.14 Example of a 5 aircraft circle problem : (a) original trajectories ; (b) modified trajectories. . . 64
Figure 3.15 Solution of a circle problem with 23 aircraft at : (a) time=0 ; (b) time= 7 min, (c) time= 10 min ; (d) time= 14 min ; (e) time= 17 min ; (f) time = 21 min. . . 65
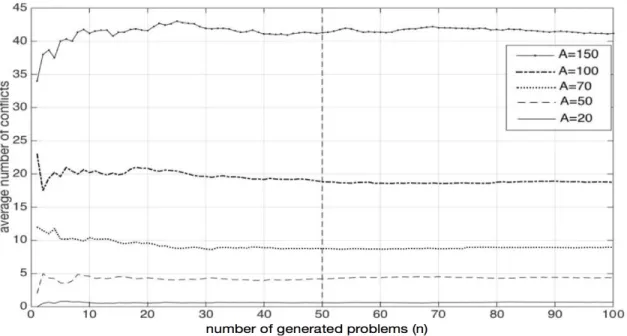
Figure 3.16 Average number of conflicts as a function of the number of problems. 68 Figure 3.17 Number of unresolved conflicts using MSP-S/C (large speed) and MSP-SH/C for : (a) A=100 ; (b) A=150. . . 70
Figure 3.19 Heading manoeuvre to solve near border conflict. . . 72
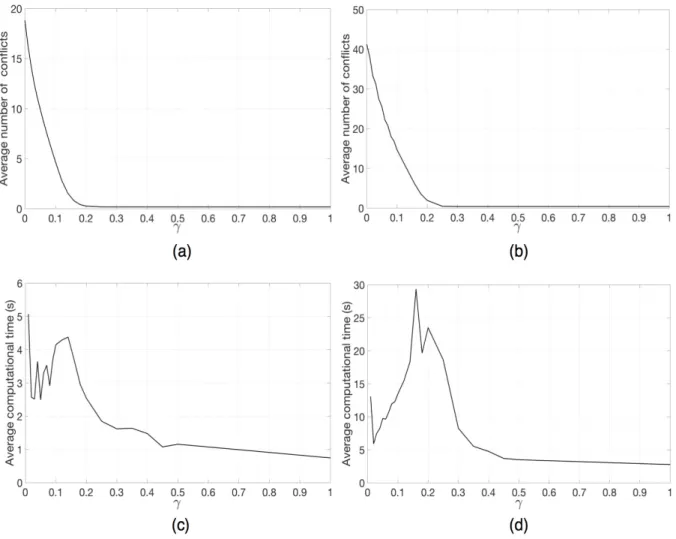
Figure 3.20 Testing the effect of “ on the performance of MSP-SH/C : (a) number of unresolved conflicts for A = 100 ; (b) number of unresolved conflicts for A = 150 ; (c) average computational time for A = 100 ; (d) average computational time for A = 150. . . . 74
Figure 3.21 The actual percentage of modified trajectories for : (a) A = 100 ; (b) A= 150. . . 75
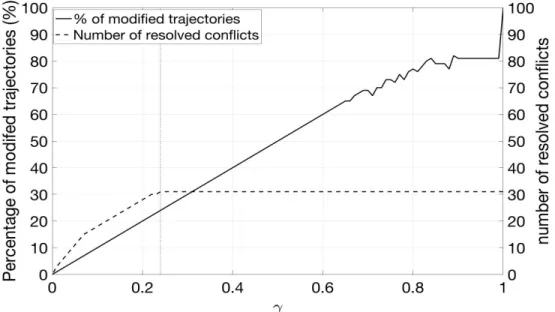
Figure 3.22 A comparison between the percentage of modified trajectories and num-ber of resolved conflicts for a problem with A = 100. . . . 76
Figure 3.23 Workload balancing results for problems involving 100 aircraft. . . . 77
Figure 3.24 Workload balancing results for problems involving 150 aircraft. . . . 78
Figure 3.25 Number of conflicts per sector for : (a) A = 100, ⁄ = 4 ; (b) A = 100, ⁄ = 1.5; (c) A = 100, ⁄ = 1; (d) A = 150, ⁄ = 4; (e) A = 150, ⁄ = 1.5; (f) A = 150, ⁄ = 1. . . . 79
Figure 4.1 Example of a trailing conflict at : (a) T1, where the aircraft are safely separated ; (b) T2 > T1,where the distance between the aircraft is less than the safe separation distance D. . . . 82
Figure 4.2 Illustration of a trailing conflict between two points. . . 82
Figure 4.3 Conflict free condition for a trailing conflict. . . 83
Figure 4.4 Consecutive flight segments for two trailing aircraft. . . 84
Figure 4.5 Trailing aircraft on consecutive flight segments. . . 84
Figure 4.6 Separation distance between two trailing aircraft on consecutive flight segments. . . 86
Figure 4.7 A trailing conflict between flight plans i and j. . . . 91
Figure 4.8 IDEF0 for the MSP-SH/CT model. . . 97
Figure 4.9 Aircraft trajectories for the trailing detailed example : (a) original tra-jectories ; (b) modified tratra-jectories. . . 100
Figure 4.10 Average number of conflicts as a function of the number of problems. 105 Figure 4.11 The percentage of modified trajectories for the problems with ¯A = 10. 107 Figure 4.12 A comparison between the percentage of modified trajectories and num-ber of resolved conflicts for a problem with ¯A = 10 using : (a) the unmodified objective function, (b) the modified objective function. . . 108
Figure 4.13 Confidence interval of the percentage of resolved conflicts with a confi-dence level of 95% for problems with : (a) ¯A = 5 ; (b) ¯A = 7 ; (c) ¯ A = 10 ; (d) ¯A = 20. . . 111
Figure 4.14 Number of unresolved conflicts using MSP-S/CT (large speed) and MSP-SH/CT for problems with : (a) ¯A = 10 ; (b) ¯A = 20. . . 112 Figure 4.15 Testing the effect of “ on the performance of MSP-SH/CT : (a) number
of unresolved conflicts for ¯A = 10 ; (b) number of unresolved conflicts for ¯A = 20 ; (c) average computational time for ¯A = 10 ; (d) average computational time for ¯A = 20. . . 113 Figure 4.16 Percentage of modified trajectories as a function of “ for problems
with : (a) ¯A = 10 ; (b) ¯A = 20. . . 114 Figure 4.17 Testing the effect of varying ⁄ on the performance of MSP-SH/CT : (a)
number of unresolved conflicts for ¯A = 10 ; (b) number of unresolved conflicts for ¯A = 20 ; (c) average computational time for ¯A = 10 ; (d) average computational time for ¯A = 20. . . 116 Figure 4.18 Percentage of modified trajectories as a function of ⁄ for problems
with : (a) ¯A = 10 ; (b) ¯A = 20. . . 117 Figure 5.1 IDEF0 for the MSP-SHA/CT model . . . 126 Figure 5.2 Aircraft trajectories for the detailed example with altitude changes :
(a) original trajectories ; (b) modified trajectories (the trajectories of the grey-shaded aircraft are not modified). . . 128 Figure 5.3 Comparing the MSP-SHA/CT and MSP-SH/CT models while varying
“ : (a) number of unresolved conflicts for ¯A = 10 ; (b) number of unresolved conflicts for ¯A = 20 ; (c) percentage of modified trajectories for ¯A = 10 ; (d) percentage of modified trajectories for ¯A = 20. . . . 137 Figure 5.4 Average computation time as a function of “ for problems with : (a)
¯
A = 10 ; (b) ¯A = 20. . . 138 Figure 5.5 Average number of conflicts as a function of ⁄ for problems with ¯A = 10
using : (a) MSP-SHA/CT ; (b) MSP-SH/CT. . . 139 Figure 5.6 Percentage of modified trajectories as a function of ⁄ for problems with
¯
A = 10. . . 140 Figure 5.7 Average computation time as a function of ⁄ for problems with ¯A = 10. 140 Figure 5.8 Number of conflicts as a function of ⁄ for a problem with ¯A = 20 using
MSP-SHA/CT. . . 141 Figure 5.9 Percentage of modified trajectories as a function of ⁄ for a problem
with ¯A = 20. . . 142 Figure 5.10 Computation time as a function of ⁄ for a problem with ¯A = 20. . . . 142 Figure A.1 Two aircraft with an intersection angle ◊i,j. . . 157
LIST OF SYMBOLS AND ABBREVIATIONS
– the maximum percentage of aircraft trajectories that can be modified using speed changes.
— the maximum percentage of aircraft trajectories that can be modified using altitude changes.
“ the maximum allowed percentage of modified trajectories. ¯“ the minimum value of “ that resolves most conflicts.
⁄ the workload balancing multiplier = Maximum allowed workload per sector Average workload in all sectors . ◊i,j intersection angle between flight plans i and j.
¯◊i,j the angle between two consecutive common flight segments between flight plans i and j.
„ Turn angle of the heading change manoeuvres. A the number of aircraft.
¯
A the number of trajectories.
Ap Y _ _ _ _ _ _ ] _ _ _ _ _ _ [
1 if the aircraft following the first flight plan, i, of the pth flight plan pair in E arrives at the intersection point before the aircraft following the second flight plan, j, and they are safely separated; 0 otherwise. Bp Y _ _ _ _ _ _ ] _ _ _ _ _ _ [
1 if the aircraft following the second flight plan, i, of the pth flight plan pair in E arrives at the intersection point before the aircraft following the first flight plan, j, and they are safely separated; 0 otherwise. Cp Y _ _ _ ] _ _ _ [
1 if a conflict is predicted to happen between the pth flight plan pair in E ; 0 otherwise. Cg1 Y _ _ _ ] _ _ _ [
1 if the aircraft following the gth plan pair in ¯E lose separation at the beginning of the CFS,
Cg2 _ _ _ ] _ _ _ [
1 if the aircraft following the gth plan pair in ¯E lose separation at the end of the CFS,
0 otherwise. ¯ Cg Y _ _ _ ] _ _ _ [
1 if a trailing conflict is predicted to happen for the gth plan pair in ¯E,
0 otherwise.
D Safe horizontal separation distance (=5NM).
Di(m) the distance between waypoints m and m + 1 of flight plan i
d Separation distance between alternative flight plans, i.e. heading change manoeuvres.
di,j(◊i,j) The separation distance between the aircraft following flight plans i and j with and intersection angle equals ◊i,j.
di(w) the euclidean distance between the the wth intersection point of the flight plan i and the previous waypoint.
¯d1(g, ¸) the euclidean distance between waypoint m and the first point in the
CFS,
¯d2(g, ¸) the euclidean distance between waypoint m and the end point in the
CFS.
E the set of all flight plan pairs that are at risk of a pairwise crossing conflict.
¯
E the set of flight plan pairs at risk of a trailing conflict. Hp(k) Y _ _ _ ] _ _ _ [
0 if both flight plans of the pth pair in E use flight level k at their intersection point; 1 otherwise. ¯ Hg(k) Y ] [
0 if both flight plans of the gth pair in ¯E use flight level k at the CFS; 1 otherwise.
Ia(i)
Y ] [
1 if aircraft a can use flight plan i; 0 otherwise. Is p Y _ _ _ ] _ _ _ [
1 if the intersection point of the pth flight plan pair in E is located in sector s ; 0 otherwise. ¯Is g Y _ _ _ ] _ _ _ [
1 if the beginning of the CFS for the gth flight plan pair in ¯E is located in sector s ;
Is(i) ]
[
1 if flight plan i includes a speed change manoeuvre; 0 otherwise.
Ih(a)
Y ] [
1 if aircraft a undergoes a heading change manoeuvre; 0 otherwise.
Il(i)
Y ] [
1 if flight plan i includes an altitude modification; 0 otherwise.
I(a)
Y ] [
1 if the trajectory of aircraft a undergoes any modifications; 0 otherwise.
i(p) the first flight plan of the pth flight plan pair in E. ¯i(g) the first flight plan of the gth flight plan pair in ¯E. J the number of possible flight plans.
j(p) the second flight plan of the pth flight plan pair in E. ¯j(g) the second flight plan of the gth flight plan pair in ¯E. K the number of flight levels.
L(i) the number of flight level changes in the original flight plan i.
Li(m, k) Y _ _ _ ] _ _ _ [
1 if flight plan i includes flying between waypoints m and m + 1 on flight level k;
0 otherwise.
N(i) the number of waypoints in flight plan i. N The total number of conflicts in a problem P(i)
Y ] [
1 if there is an aircraft using flight plan i; 0 otherwise. Rg Y _ _ _ ] _ _ _ [
1 if the aircraft following flight plan ¯i(g) arrives to the CFS before the aircraft following flight plan ¯j(g),
0 otherwise.
˙Si,j the minimum separation time at the intersection point between flight plans i and j at fixed speeds.
Si,j the minimum separation time at the intersection point between flight plans i and j
Sp the minimum separation time at the intersection point between the pth flight plan pair in E
¯Si,j the minimum separation time at the beginning and the end of the CFS between flight plans i and j
¯Sg the minimum separation time at the beginning and the end of the CFS between the gth flight plan pair in ¯E
Ti(m) the time taken by an aircraft following flight plan i to pass from way-point m to wayway-point m + 1.
ti(m) the planned time at which an aircraft that uses flight plan i passes by its mth waypoint
tÕi(m) the actual time at which an aircraft that uses flight plan i passes by its mth waypoint
t+i (m) the maximum possible time at which an aircraft following flight plan i can reach its mth waypoint.
t≠i (m) the minimum possible time at which an aircraft following flight plan i can reach its mth waypoint.
¯t1(g, ¸) the passage time at the first point of the CFS for the ¸th flight plan of
the gth flight plan pair in ¯E.
¯t2(g, ¸) the passage time at the end point of the CFS for the ¸th flight plan of
the gth flight plan pair in ¯E. ¯t≠
1(g, ¸) the minimum passage time at the first point in the CFS for the ¸thflight
plan of the gth flight plan pair in ¯E. ¯t+
1(g, ¸) the maximum passage time at the first point in the CFS for the ¸th
flight plan of the gth flight plan pair in ¯E. ¯t≠
2(g, ¸) the minimum passage time at the end point in the CFS for the ¸thflight
plan of the gth flight plan pair in ¯E. ¯t+
2(g, ¸) the maximum passage time at the end point in the CFS for the ¸th
flight plan of the gth flight plan pair in ¯E.
ˆti(w) the passage time of the wth intersection point of the modified flight plan i.
ˆt+
i (w) the maximum possible time at which an aircraft following flight plan i can reach the wth intersection point.
ˆt≠
i (w) the minimum possible time at which an aircraft following flight plan i can reach the wth intersection point.
Ui(m, k)
Y ] [
0 if flight plan i uses flight level k at the waypoints m and m + 1 1 otherwise.
v+a the maximum allowed speed for aircraft a v≠
a the minimum allowed speed for aircraft a
Xi(m) the X coordinate of the mth waypoint in flight plan i. Yi(m) the Y coordinate of the mth waypoint in flight plan i. Zi(m) the flight level index at the mth waypoint in flight plan i. W(i) the number of intersection point in flight plan i.
ATC : Air Traffic Control
ATCO : Air Traffic Control Officer ATM : Air Traffic Management
CFS : Common Flight Segment
CDR : Conflict Detection and Resolution FMS : Flight Management System
ICAO : International Civil Aviation Organization IDEF0 : Integrated definition of function modelling MILP : Mixed Integer Linear Program
MINLP : Mixed Integer Non Linear Program
MSA : Multi-Sector Area
MSP : Multi-Sector Planning MSPr : Multi-Sector Planner
MSP-H/C : Multi-sector planning support model using heading changes for crossing conflicts
MSP-S/C : Multi-Sector Planning support model using Speed changes for crossing conflicts
MSP-SH/C : Multi-Sector Planning support model using Speed and Heading changes for Crossing conflicts
MSP-A/CT : Multi-Sector Planning support model using Altitude changes for Cros-sing and Trailing conflicts
MSP-H/CT : Multi-Sector Planning support model using Heading changes for Cros-sing and Trailing conflicts
MSP-S/CT : Multi-Sector Planning support model using Speed and changes for Crossing and Trailing conflicts
MSP-SH/CT : Multi-Sector Planning support model using Speed and Heading changes for Crossing and Trailing conflicts
MSP-SHA/CT : Multi-Sector Planning support model using Speed, Heading and Alti-tude changes for Crossing and Trailing conflicts
NextGen : The next generation air transportation system NM : Nautical Mile, 1 NM ¥ 1.852 Km
PHARE : Program for Harmonized ATM Research in EUROCONTROL
PC : Planner Controller
SESAR : Single European Sky ATM Research project TC : Tactical Controller
LIST OF APPENDICES
APPENDIX A FORMULATION OF THE SAFE SEPARATION TIME FOR CROS-SING CONFLICTS . . . 157 APPENDIX B THE CROSSING CONFLICT DETECTION CONSTRAINTS . . . 160 APPENDIX C THE PREPROCESSING STAGE OUTPUT DATA FOR THE
CHAPTER 1 INTRODUCTION
Since the beginning of the commercial use of planes, the growth of air traffic always results into the evolution of Air Traffic Control (ATC). Due to the current growth rate, such an evolution is imperative. One of the recently developed concepts introduced to the ATC to answer this need is the Multi-Sector Planning (MSP). It relies on expanding the role of the planner controller to be responsible of a set of adjacent sectors instead of only one. The application of this concept is attributed to the advancement in the flight management and communication systems. The MSP entails the need for tools and models to help the Multi-Sector Planner (MSPr) fulfilling his new tasks efficiently.
A brief review of the air traffic control system, the multi-sector planning concept, the moti-vation of the presented work, the objectives, the approach followed and an overview of the dissertation will be presented in the following sections.
1.1 Air traffic control
The airspace and the runways can be seen as limited resources that have to be shared bet-ween the aircraft. Each aircraft uses these resources to optimize several factors such as fuel consumption, punctuality and passenger comfort. Air Traffic Management (ATM) is the pro-cess, procedure and resources that are used to coordinate the aircraft to enable safe and efficient aircraft operations, both in air and on ground. According to the European organi-zation for the safety of air navigation (EUROCONTROL), the ATM system is composed of three subsystems (EUROCONTROL, 2012) :
— Airspace management that is responsible for the design of the airspace (sectors and routes).
— Traffic Flow Management (TFM) that is responsible for ensuring that the planned aircraft trajectories do not lead to exceeding the airspace or the airports capacities. — ATC that is responsible for monitoring the aircraft in real time and ensure that they
maintain safe separation distances between each other.
In the current ATM system, the airspace can be seen as a set of flight levels and routes forming a network designed to simplify the control of air traffic. The flight levels are horizontal plans separated by 1000 ft, where each flight level is characterized by a constant atmospheric pressure using a sea level pressure datum of 29.92 inches of mercury. This design ensures that two aircraft flying at different levels can never be in conflict.
Organization (ICAO). The horizontal separation distance en route is normally 5 NM and the vertical separation distance is 1000 ft for altitudes lower than 29,000 ft and 2000 ft for altitudes higher than 29,000 ft (Prandini et al., 2000). ICAO changed these norms by applying the reduced vertical separation minima rule that is now implemented in almost all countries. The reduced vertical separation minima rule reduces the vertical separation distance to 1000 ft for the altitudes between 29,000 ft and 41,000 ft and requires the equipment of aircraft using these altitudes with a certified altimeter (ICAO, 2002).
Two or more aircraft are considered in conflict when their separation distances are below these norms. There are three types of possible conflicts between flights : crossing, trailing and head-to-head conflicts, Figure 1.1. The design of the airspace and flight trajectories prevents the occurrence of head-to-head conflicts. The semicircular rule is applied worldwide : a single flight direction (eastbound or westbound) is assigned to each flight level. The flight direction assignment is done alternatively. For example, for flight levels below 29,000 ft (FL290), the eastbound flights are assigned to odd flight levels (FL270, FL250,..) whereas the westbound flights are assigned to even flight levels (FL280, FL260,...),Figure 1.2.
Figure 1.1 Conflict types
It is the task of the ATC to predict the occurrence of conflicts over a short time horizon (10-15 min) and to devise a solution to ensure the separation of aircraft (Whiteley, 1999a). A solution consists in giving instructions (clearances) to one or more of the aircraft in conflict to undergo a change in the trajectory. Clearances can indicate changes of speed, heading and/or altitude.
Nowadays, the controlled airspace is divided into space volumes called sectors. Each sector has a distinct radio frequency for communication with aircraft. A terminal sector is a sector that includes an airport. Otherwise, it is called an en route sector. A team of 2-3 Air Traffic
Figure 1.2 The semicircular rule
Control Officer (ATCO) is responsible for the ATC tasks in a sector. These tasks can be classified in two main tasks (Conversy et al., 2011) :
1. Receiving/handing off the aircraft from/to adjacent sectors (hello, goodbye, negotia-ting exit conditions and change of radio frequency)
2. Ensuring the separation of the aircraft. That includes detecting the conflicts and solving them :
— Detecting possible conflicts within the sector. — Finding a feasible solution to the detected conflicts. — Transmitting the instructions to the pilots.
— Ensuring that the pilots follow the instructions.
According to EUROCONTROL (2014), the number of aircraft that a team of ATCO can handle depends on several factors such as the location of the sector, the complexity of the traffic flows and the day. Each sector has a capacity expressed in the current ATM system by the number of aircraft entering the sector per hour. Most commonly in Europe, this capacity is between 40 and 60 entries per hour.
The latest reports from EUROCONTROL in 2013 (EUROCONTROL, 2013a,b) lowered the predicted annual growth rate of air traffic in medium and long terms to (0.7-2.6%) from the previous 2010 predicted growth rate of (1.6-3.9%) (EUROCONTROL, 2010, 2011). Even with these lower predicted rates, the air traffic is anticipated to undergo an increase of 20-80% in the next 20 years. This growth of air traffic in the already congested air space shows the need of increasing the efficiency of the ATM system and air space capacity while ensuring the safety of flights and minimizing delays. In the current ATM system, the increase in air traffic is handled by grouping or splitting the sectors to keep the controllers workload within
a reasonable range. However, this method is attaining its limit. The sectors are becoming so small that aircraft pass by them in a few minutes. This indicates that by further decreasing sectors size, the hand off and communication task would be more frequent and would form a burden on the controllers (Whiteley, 1999a; Conversy et al., 2011). As a result, the Single European Sky ATM Research project (SESAR) in Europe and the Next Generation air transportation system (NextGen) project in the USA were launched to address the challenges inherited from the predicted air traffic increase.
Many attempts were made to reduce the amount of work required from the controllers. These were motivated by the fact that the ATCO workload is one of the main factors limiting the capacity of the sectors, subsequently limiting the capacity of the airspace (Whiteley, 1999a; Rey et al., 2012; Prandini et al., 2011, 2010a; Herr et al., 2005). These attempts include introducing new communication systems, advancements in the Flight Management System (FMS), introducing new tools for the controllers, automating the ATC tasks and presenting new ATC operational structure (e.g. Multi-sector planning). In the next sections some of these attempts are briefly presented along with a detailed review on the introduction of the multi-sector planning concept.
1.1.1 Digital communication
Nowadays, most of the communication and the exchange of information between pilots and controllers are done using voice radio communication. This is done on high, very high and ultra high frequencies. Whenever a pilot enters a new sector, he is given a radio frequency to perform his communication (Nolan, 2010). This system suffers from several drawbacks (Zingale et al.; Omer, 2013) :
— The amount of exchanged information is limited and needs to be concise. — The controller can receive information from only one pilot at a time.
— The exchange of information requires time, which limits the number of the aircraft that a controller can handle.
A support communication system to overcome the disadvantages of the voice system is based on exchanging the information on digital form through a data link system (Zingale et al.; Omer, 2013; Yun-sheng et al., 2016; ICAO, 2013). A data link system would allow the pilot and the controllers to exchange detailed information such as the local weather condition, the status of the aircraft and the latest weather prediction. Data link is supposed to reduce the amount of time taken by the controller in communication and reduce the voice channel congestion (ICAO, 2013). It is an essential tool in the future of ATM.
1.1.2 Flight management system
The FMS is a computerized system for aircraft navigation, flight planning and en route guidance. It is installed on a large number of aircraft. The FMS takes as input the flight plan, the current position of the aircraft and gathers information from aircraft systems such as the engine and the fuel systems and the surveillance system. Using this information, the FMS determines the optimal trajectory for the aircraft according to a cost function. This cost function is based on the fuel consumption and flight time related costs. The FMS updates its information during the flight and serves as an en route guidance system that delivers instructions to the pilot (or the autopilot) to follow the flight plan (Walter, 2000; Gawinowski et al., 2007).
The FMS can help to improve the efficiency of the ATM system in many ways. It gathers detailed information about the aircraft and the flight status. Coupled with a data link system, the FMS will allow to quickly exchange this information with ground control. The FMS serves as a guidance system for the autopilot en route. This implies that aircraft trajectories obtained by following the autopilot are not subject to human decisions and consequently are more predictable. In other words, the FMS should improve the predictability of aircraft positions in the future, which is a key enabler to improve the ATM system (Omer, 2013; Gawinowski et al., 2007).
Mueller and Sandy (2007) found that the FMS coupled with a data link system is able to correct periodically the lateral deviation from the planned trajectory. They also found using simulation that an integration of the current FMS version along with a data link system is able to ensure the following of required time of arrival at waypoints and allows the implementation of the trajectory based operations. In addition, new versions of the FMS do not only provide tracking of the flight plan in 3D (space), but they can also ensure the following of a 4D flight plan (space and time) (Walter, 2000; Wichman et al., 2001). This means ensuring that aircraft follow their flight plans precisely both in space and time. Such a system will also improve the predictability of the aircraft position over a long time horizon.
1.1.3 New air traffic control tools
One of the projects proposed by EUROCONRTOL was the Multi Actor Man Machine In-terface (MAMMI) that aimed at introducing a new layout and new tools for the control center (Vales et al., 2007). The proposed control center (Conversy et al., 2011; Vales et al., 2007) was designed to increase the collaboration between the controllers in the same team, subsequently redistributing the workload and increasing the ability of the team to handle a greater number of aircraft.
1.1.4 Automatic air traffic control
While ATC tasks are still being performed manually by controllers monitoring a radar screen, devising solutions and communicating instructions to pilots (Cafieri and Durand, 2014), the automation of the ATC is considered as a requirement for improving the ATM system (SESAR, 2007). So, much research work proposed new methods and tools for automatic Conflict Detection and Resolution (CDR). These methods and tools are aimed to be included in the ATC system to reduce controller workload (Kuchar and Yang, 2000a; Omer and Farges, 2012). This direction of research is motivated by the fact that while the number of aircraft per sector (traffic density) is a significant factor for ATCO workload, it is not the only one. Other important factors include the number and the complexity of the conflicts. Varying these factors can have a high impact on the number of tasks required from the controllers. The En Route Air traffic Soft Management Ultimate System (ERASMUS), part of the SESAR project (Gawinowski et al., 2007; Drogoul et al., 2009), proposed a framework to solve conflicts over a time horizon of 30 minutes based only on minor speed adjustments. The results of ERASMUS encouraged other researchers (Rey et al., 2012, 2015; Vela et al., 2009; Chaloulos et al., 2010) to investigate the potential of using only speed regulations for CDR and to decrease the number of conflicts over a long time horizon. The CDR problem and a set of different models proposed to solve it are discussed in details in the next chapter.
1.1.5 Multi-sector planning
The standard ATC team structure includes two controllers for each sector. One is the Planner Controller (PC) and the other one is the tactical controller (TC), also called the executive controller. The main tasks of the PC are :
— Conflict detection over a medium time horizon. This includes observing the aircraft that are intended to enter the sector and predict if any of these aircraft will be involved in a conflict in the sector.
— Planning out the aircraft trajectories. This comprises determining the entry and exit conditions of the aircraft to prevent predicted conflicts from occurring, if possible. — Co-ordination with adjacent sectors and centers. This incorporates the negotiation of
the entry and exit conditions with adjacent sectors as they may have contradicting conditions.
The main tasks of the TC are :
— Supervision of the traffic within the sector. This includes monitoring the progress of the aircraft in the sector to ensure that each aircraft does not deviate from its flight plan and that it leaves the sector at the planned time and position.
— Conflict detection over a short time horizon (15 min) by predicting the loss of safe separation between the aircraft within the sector.
— Conflict resolution. This incorporates the planning of a solution for the predicted conflicts, transmitting the clearances to the pilots through radio communication and verifying it is followed.
— Updating the flight plan of the aircraft whether it has deviated due to controller intervention or by accident.
— Handover of the aircraft to adjacent sectors.
The standard operational structure (one PC - one TC per sector) is not the best structure to handle the predicted increase in air traffic. The continuous process of redesigning the sectors and the subsequent change in resources allocation requires an operational structure that is more flexible (Vales et al., 2007; Whiteley, 1999a; SESAR, 2013a). This signifies the need of new ATC concepts and team structures to answer to the new challenges in the future ATM system. These challenges include the need for increasing the airspace capacity and providing a new solution to handling the expected increase in demand other than the redesigning of the sectors.
As an answer to this need, the Program for Harmonized ATM Research in EUROCONTROL (PHARE) was the first to introduce the concept of MSP (Whiteley, 1999a; Latron et al., 1997). PHARE is a European research program, launched in 1989 and completed in 1999, to investigate the future of ATM concepts. The general idea of MSP is to add a new controller position called the MSPr, who is responsible for the planning of aircraft trajectories in a set of adjacent sectors (Multi-sector area) over a medium time horizon. The aim of the MSPr is to reduce and balance the workload of the sectors controllers in a Multi-Sector Area (MSA) (Figure 1.3) in order to increase the global capacity (Ehrmanntraut and McMillan, 2007; Prevot et al., 2010a). The application of the MSP concept shall decrease the uncertainties in controllers decisions which are regarded as the main source of error in the prediction of aircraft trajectories (Swierstra and Green, 2003; Herr et al., 2005).
The original concept presented in PHARE (Whiteley, 1999a; Latron et al., 1997) suggested the introduction of the MSPr to the ATC operational structure in addition to the original positions of the planner and tactical controllers. The tasks of the PC and TC shall remain the same as in the standard structure. In the new structure proposed by PHARE, the MSPr shall be responsible for detecting complex situations in a set of adjacent sectors over a medium time horizon (10-40 min). He shall be also responsible for finding solutions to avoid the occurrence of these complex situations. The aim of introducing the MSPr was to reduce the complexity of situations encountered by the sector controllers in order to reduce the required planning tasks.
Figure 1.3 Example of a multi-sector area
To test this concept, a new complexity measure was developed in PHARE to quantify the expected workload in a sector. In addition, different tools such as the tactical load smoother software (a tool to calculate the predicted complexity over a medium time horizon) were developed as part of PHARE to help the MSPr perform his tasks. The application of the concept was tested via simulation by controllers using different scenarios (Whiteley, 1999a; Latron et al., 1997) and proved the feasibility of the concept. During the simulations, it was found that the controllers tend to use tactical load smoother to check if their solutions to conflicts would decrease the complexity of the situation in medium term. It was also found that the MSPr can decrease MSA complexity without the need to solve any conflict through his interventions at the MSA level. For example, in one case the MSPr imposed several route changes from the beginning to spread horizontally a flow of traffic and by this he reduced the MSA complexity.
One of the conclusions in PHARE was the need for validation of the multi-sector planning concept and the need for the definition of the working procedure of the ATC under this concept. It suggested that further studies have to be done to define precisely the tasks of the controllers in a multi-sector planning structure.
As part of the Gate-to-Gate project, launched by EUROCONTROL to validate the new ATM concepts, the MSP concept was tested and validated (Herr et al., 2005; EUROCONTROL, 2006). Herr et al. (2005) suggested three operational configurations for the ATC under the
multi-sector planning concept. One of these configurations was tested and validated using real time simulations. This configuration (MSP configuration) implies that the MSPr performs, with the aid of different tools, the tasks of the PC in several adjacent sectors and that the tasks of TC remain the same as in the standard configuration. Table 2.1 shows a comparison between the standard and the MSP configuration from the tasks assignment point of view.
Table 1.1 Tasks assignment in the traditional and multi-sector planning configurations
C onflic t de te ct io n (M edium te rm) P la nning out the tr aj ec to rie s (E nt ry /e xit co ndit io ns ) Sup er vis io n of the air cr af t (w ithin the se ct or ) C onflic t de te ct io n (Sho rt te rm) C onflic t re so lut io n Up da ting flig ht pla n C oo rdina tio n ta sk s Ha ndo ve r the flig ht s Standard Configuration PC PC TC TC TC TC PC TC MSP Configuration Software MSPr TC TC TC TC MSPr TC
The MSP configuration was incorporated in the SESAR project (SESAR, 2013a). The confi-guration was introduced and tested for a MSA of two sectors and it was labeled as 1P-2T configuration (one PC for two TC). The MSPr was responsible for the planning tasks in two adjacent sectors. In SESAR, the MSPr main goal is to avoid conflicts by determining conflict free trajectories to decrease the workload of the tactical controllers. The 1P-2T configuration was validated using simulations and the findings of this study pointed out that the confi-guration is applicable, provides better flexibility in managing the controllers and leads to comfortable level of workload for the controllers. The 1P-2T configuration was considered in SESAR as the first step for the application of the multi-sector planning concept (1P-nT) that will be later investigated.
The multi-sector planning concept was also introduced in NextGen. It was presented as a new controllers operational structure (Willems et al., 2005; Corker et al., 2006; Williams et al., 2007; Celio, 2007). This new structure comprises a controller for each sector and a strate-gic controller responsible for a set of adjacent sectors. The role of the stratestrate-gic controller is slightly different than that of the MSP as introduced in SESAR. In addition to generating so-lutions based on a global view of the assigned sectors, the strategic controller is to help sector controllers in their tasks whenever the sector workload increases. Celio (2007) stated that the controllers in NextGen will respond to conflicts by checking a set of automatically generated
solutions and deciding which one to apply instead of generating the solutions themselves. Also, it was said that due to the improvement in the accuracy of predicting the position of aircraft and the use of automatic prediction of conflicts, the controllers in many cases would solve conflicts that are predicted to happen in adjacent sectors. This means that the resolu-tion of the conflicts will be done and the correcting clearances will be issued in a sector prior to the one where the conflict is predicted to occur.
In the context of NextGen project, different operational structures for the MSP were in-vestigated (Willems et al., 2005; Corker et al., 2006; Smith et al., 2010) mainly to study the difference between incorporating the MSPr as a coordinator in addition to traditional operational structure and replacing the PC of multiple sectors. The work of Willems et al. (2005) and Corker et al. (2006) showed the feasibility of the MSP concept. Williams et al. (2007) also demonstrated that the application of the MSP concept improves the utilization of controllers. A series of human-in-the-loop simulations were conducted in (Smith et al., 2010; Prevot et al., 2010a) to evaluate the feasibility and determine the best operational structure for the MSP concept in the United States national airspace. In these simulations, real controllers took the roles of MSPr and sector controllers for a simulated MSA. The re-sults demonstrated the ability of the MSPr to reduce the workload of the controllers, sector complexity and number of conflicts with all the tested operational structures.
As the magnitude of the planning tasks required from the MSPr exceeds that of the PC, the necessity for tools and models to help the MSPr fulfill his tasks increases. Prevot et al. (2010b) presented the results of an extensive study, using human-in-the-loop simulations, for the assessment of a set of tools designed to help the MSPr. One of these tools allows the MSPr to test and filter the traffic to help him focus on a specific criterion (e.g. flight level or time domain). Another tool predicts the number of aircraft per sector and the sector com-plexity by predicting flights trajectories. One of the important tested tools tests the solutions proposed by the MSPr before its application. The results showed the importance of such tools for the application of the MSP concept.
A model or a tool to generate solutions that decrease and balance the workload in a MSA is essential for the application of the MSP concept. As a part of the continuous work of EUROCONTROL on the multi-sector planning concept, Flener et al. (2007a,b) presented a constraint programming method for complexity resolution in a multi-sector planning ATC environment. This method aims at modifying flights trajectories to reduce the predicted com-plexity measure over a medium time horizon (20-90 min) for a set of adjacent sectors. The method also aims at balancing complexities between sectors. Recently, Hong et al. (2016) presented a two level hierarchical architecture for the resolution of conflicts in a designated sector in a multi-sector planning framework. In a first step, a mixed integer linear program
(MILP) is used to minimize the complexity in the neighbour sectors. Aircraft trajectories are modified using speed or heading changes. The complexity is measured by the magnitude of the deviation from the original flight plans. In a second step, another MILP is used to solve conflicts in the designated sector while using the solutions generated in the first step as entry/exit conditions on the flights that pass through the sectors. Both the models of Flener et al. (2007a,b) and Hong et al. (2016) will be discussed in details in the next chapter. While the importance of such models for the MSPr seems to be essential, to our knowledge the work of Flener et al. (2007a,b) and Hong et al. (2016) remain the only reported literature in this research area.
1.2 Motivation
The SESAR and NextGen projects that represent the future of the ATM systems in Europe and in the United States of America promote a new ATC system. This system promotes the control of aircraft and the resolution of conflicts based on medium time horizon prediction to reduce the controllers’ workload. The availability of such an ATC system is attributed to the advancement in communication and flight support systems that have increased the precision of aircraft position prediction.
Both SESAR and NextGen adopted the multi-sector planning concept. The concept intro-duces a new controller position (MSPr). The MSPr will be responsible for the planning tasks in a set of adjacent sectors (MSA) taking into account the traffic situation in each sector within the MSA. The main objective of the MSPr is to balance and reduce the workload of the sector controllers. One of the main benefits of applying the MSP is the responsive management of the traffic by redistributing the workload at sector level.
The multi-sector planning concept brought out the need for tools to help the MSPr to fulfil his tasks. Such tools must be able to :
— Evaluate the workload of the controllers and indicate the complex areas in the MSA. — Predict the position of the aircraft and predict the possible conflicts over a medium
time horizon.
— Propose a set of solutions that solve the conflicts, minimize and balance the workload of the sectors controllers.
The work proposed here addresses this need. It aims at presenting a support tool for the MSPr that evaluates the workload of the controllers, predicts and solves conflicts over a medium time horizon and provides a set of optimal solutions while taking into consideration the difference between the MSP and the traditional CDR problem. Such a tool requires the definition of the complexity resolution problem in a multi-sector planning framework and its
solution in an appropriate time frame.
1.3 Objectives
The objectives of this work can be summarized as follows :
— Define precisely the complexity resolution problem in a multi-sector planning frame-work. The problem definition shall include the detection of both crossing and trailing conflicts. It shall also incorporate the ability of the MSPr to modify an aircraft tra-jectory using all types of manoeuvres (speed, heading and altitude changes).
— Develop an approach to modify aircraft trajectories (with minimal changes) to reduce and balance the predicted complexities of a set of adjacent sectors (MSA) over a medium time horizon (20 – 90 minutes). This approach shall be able to provide a set of different solutions to the complexity resolution problem in a reasonable amount of time while balancing the workload amongst the sectors.
— Validate and test the feasibility and efficiency of our approach.
— Test and compare the effect of multiple manoeuvres combinations on different air traffic scenarios to suggest the best combination for each scenario.
1.4 Research approach
Due to the complexity of that problem and in order to achieve the research objectives, we broke down the project into the following steps :
1. Present a precise definition of the complexity resolution problem in a MSP framework, including the choice of the complexity measure that will be used in this work.
2. Formulate a model to solve the complexity resolution problem as defined in the first step using only speed and heading manoeuvres. This model shall be able to predict aircraft position and handle only crossing conflicts.
3. Validate and test the model using randomly generated problems. Test the effect of the workload balancing and different manoeuvres combinations on the generated solutions. 4. Modify the model to include the detection and solution of trailing conflicts.
5. Test the effect of trailing conflicts on the model efficiency and the tested manoeuvres combinations using different air traffic scenarios.
6. Reformulate the model to include altitude change manoeuvres.
1.5 Thesis outline
The thesis is presented in six chapters. Chapter 2 presents a review of the related literature highlighting the research gaps in the complexity resolution problem under the MSP context. This chapter includes also a review on the complexity measures and the conflict detection and resolution problem. Chapter 3 covers the first three research steps. It introduces the definition of complexity resolution problem under the MSP concept and presents the formulation of the mathematical model to address the problem using only speed and heading manoeuvres. Several randomly generated problems are used to evaluate the benefits of the developed model and to test different manoeuvres combinations. Chapter 4 covers the next two research steps. It presents a detailed description of the modification of the MSP support model to handle trailing conflicts in addition to crossing conflicts. Randomly generated problems are used to assess the efficiency of the model including the count of the trailing conflicts. Different air traffic scenarios are also used to test the different combinations of manoeuvres. Chapter 5 covers the last two research steps. It presents the full model including all three types of manoeuvres and the tests used to assess its efficiency. Finally, the summary and main conclusions are presented in Chapter 6.
CHAPTER 2 LITERATURE REVIEW
Multi-sector planning is a new ATC concept that aims at reducing and balancing controllers workload in a set of adjacent sectors. This objective is achieved through the introduction of a new ATC position called multi-sector planner (MSPr). Tools and models to help the MSPr fulfill his tasks are essential to the application of the MSP. These tools must be able to analyze air traffic situations and devise solutions that reduce and balance the controllers workload.
The complexity resolution problem targets the modification of flights trajectories to reduce a measure that represents controllers workload over a predetermined time period for a set of sectors. Solving this problem while trying to balance the complexity measure, which repre-sents controllers workload, is fundamental to the MSP support tools.
In this chapter, we present a detailed review of the approaches used to solve the complexity resolution problem in a MSP context. We also introduce a brief review on the complexity measure formulation with the aim of identifying an appropriate measure. Finally, we present a review on the conflict detection and resolution problem to determine an approach to solve the complexity resolution problem in a MSP framework.
2.1 Complexity resolution problem
The MSP was first introduced as part of the PHARE project (Whiteley, 1999a; Latron et al., 1997) to increase airspace capacity. In PHARE, the term complexity resolution was defined as the task of determining the complex areas in a MSA and finding a solution that resolves these problematic areas by solving the predicted conflicts (Latron et al., 1997). Several ATC support tools were introduced in PHARE to help the controllers including the MSPr. One of these tools is the tactical load smoother (TLS). It is intended to help the MSPr by predicting the complexity in a MSA over a 40 min time horizon. The complexity measure used in the TLS depends on the number of aircraft in the sector, position of each aircraft, number and type of conflicts and the number of trajectory changes. The TLS uses these factors along with the uncertainty in aircraft position and the conflict probability to calculate a global complexity measure. The TLS presents a map of the MSA that highlights the problematic zones with high complexity measure. It displays this map along with the number of aircraft and the number of conflicts per sector. This information is supposed to be used by the MSPr to devise a solution using other support tools.
traffic situations. These tools include a conflict detection tool called conflict probe (Kremer et al., 1999). It aims at comparing flight plans and trajectories with each other to detect pos-sible conflicts while taking into account restricted flight zones. Another tool, problem solver, was presented in PHARE to help solving the conflicts (Whiteley, 1999b). This tool does not propose any solutions to solve the conflicts but gives the controller a geometric view of the conflict and enables him to modify the trajectories graphically and test his solutions.
The tools developed in PHARE were tested using human-in-loop simulations where control-lers took the roles of MSPr and sector controlcontrol-lers in a simulated air traffic situation. The tools were found to be helpful from the controllers point of view. The MSPr controllers used the TLS to identify the zones with high workload (complexity measure). Then they reduced its complexity using classic deconfliction manoeuvres (i.e. speed, heading and altitude ma-noeuvres) for the conflicts. Having a global view of the MSA, the MSPr were also able to avoid high complexity zones by spreading the flow horizontally. Note that in the latter case, the MSPr did not target the resolution of conflicts. A traditional planner controller would not be able to devise such a solution. The controllers used the suggested support tools to test their solutions and ensure their efficiency (Whiteley, 1999a; Kremer et al., 1999; Whiteley, 1999b).
The work of Flener et al. (2007a,b,c) as part of the ongoing work of EUROCONTROL on the MSP concept targeted the complexity resolution problem. The main objective of this work was to develop a model that minimizes and balances the complexities in a set of adjacent upper airspace sectors.
Flener et al. defined the complexity of a sector s at a given moment m as
C(s, m) = Nsec(s, m) + Nnsb(s, m) + Ncd(s, m) (2.1) where Nsec(s, m) is the number of aircraft in sector s at moment m, Nnsb(s, m) is the number of aircraft near the borders of sector s (< 2 min flight) at moment m and Ncd(s, m) is the number of climbing and descending aircraft in sector s at moment m.
This measure takes the same form of the one introduced in PHARE (Whiteley, 1999a). Flener et al. decided not to include a term related to aircraft equipments due to the lack of data. They also decided to exclude the number of flight pairs in potential conflicts arguing that it was not strongly correlated to another complexity measure developed by EUROCONTROL as part of the complexity and capacity project (Hilburn, 2004; Flynn et al., 2003).
Such a measure gives an instantaneous read on air traffic complexity and is subject to sudden rises and falls. As a result, Flener et al. redefined the sector complexity as the average of the
instantaneous complexity at the beginning, middle and end of a 7 minutes time period using
C(s, m) =
q2
i=0C(s, m + 3.5i)
3 . (2.2)
Flener et al. (2007a) stated that the average time to pass a European upper airspace sector is 8 minutes. So choosing a sampling interval that is ¥ 44% of the average time to pass a sector can neglect important information regarding the air traffic situation. For example, an Airbus A320 has a nominal climb rate of ¥ 1200 feet per minute (over FL300), hence it can climb two flight levels (2000 feet) in less than two minutes. Such a climb can be neglected if it occurs between two sampling points. This means that a solution that minimizes (2.2) can include high unaccounted complexities between sampling points.
Flener et al. (2007a,c) defined the complexity resolution problem as follows. Given a MSA S and the flight plans of the aircraft planned to pass through S during a given time period of 20 to 90 minutes, find a modification of the flight trajectories such that a minimum of f% of these flights pass through S during this time period and such that the sum of sectors complexities as measured in (2.2) is minimized.
The minimum percentage f% was introduced to prevent the resolution algorithm from rerou-ting all the flights outside the MSA. Imposing such a constraint is necessary if the solutions can involve large changes in the aircraft trajectories. Such changes, if applicable, are costly and raise the problem of equity among the flights. While the value of f has a major impact on the output solution, Flener et al. did not present an approach to properly determine its value nor did they present results using different values other than 90%.
To solve the complexity resolution problem, Flener et al. proposed three types of modifica-tions for aircraft trajectories. The first type is a change of take off time. This type allows the modification of aircraft take off time by multiples of 5 minutes. Although this change can represent a powerful tool, there is no guarantee that the imposed solution will comply with airports or other MSA capacities. As the change of take off time remains always within the authority of the central flow management unit and beyond the responsibility of the MSPr (Whiteley, 1999a; Barnier and Allignol, 2012), there is no guarantee that the solution will be applicable.
The second type of modification suggested by Flener et al. (2007a,b,c) was changing the time at which the aircraft enters the MSA. This change was constrained to be in the range of -2 to +1 minutes per 20 minutes of flight time. This modification is implemented by changing the aircraft speed within two sectors around the MSA. Such a change requires the MSPr to negotiate new entry conditions with neighbouring sectors to validate it. There are no gua-rantees on the feasibility of the implied changes.