HAL Id: hal-00004520
https://hal.archives-ouvertes.fr/hal-00004520
Submitted on 19 Mar 2005
HAL is a multi-disciplinary open access
archive for the deposit and dissemination of
sci-entific research documents, whether they are
pub-lished or not. The documents may come from
teaching and research institutions in France or
abroad, or from public or private research centers.
L’archive ouverte pluridisciplinaire HAL, est
destinée au dépôt et à la diffusion de documents
scientifiques de niveau recherche, publiés ou non,
émanant des établissements d’enseignement et de
recherche français ou étrangers, des laboratoires
publics ou privés.
XM M
− Newton Ω project: III. Gas mass fraction shape
in high redshift clusters
Rachida Sadat, Alain Blanchard, Sebastien Vauclair, David Lumb, James
Bartlett, A.K. Romer, Jean-Philippe Bernard, Michel Boer, Philippe Marty,
Jukka Nevalainen, et al.
To cite this version:
Rachida Sadat, Alain Blanchard, Sebastien Vauclair, David Lumb, James Bartlett, et al.. XM M
−
N ewton Ω project: III. Gas mass fraction shape in high redshift clusters. Astronomy and Astrophysics
ccsd-00004520, version 1 - 19 Mar 2005
1
Key words. Galaxies: clusters: general-galaxies:intergalactic medium–Cosmology:cosmological parameters – dark matter – X-rays: galaxies: clusters
Astronomy & Astrophysicsmanuscript no. xmm2.hyper2232 March 19, 2005 (DOI: will be inserted by hand later)
The
X M M − Newton Ω
project: III. Gas mass fraction shape in
high redshift clusters
R. Sadat
1, A. Blanchard
1, S.C. Vauclair
1, D.H. Lumb
2, J. Bartlett
3, A.K. Romer
4, J.-P. Bernard
5, M. Boer
6,
P. Marty
7, J. Nevalainen
8, D.J. Burke
8, C.A. Collins
9, R.C. Nichol
101 Laboratoire d’Astrophysique de Tarbes et Toulouse, OMP, CNRS, UMR 5572, UPS, 14 Avenue. E. Belin, F–31400
Toulouse, France
2 Advanced Concepts and Science Payloads Office, European Space Agency, ESTEC, 2200AG Noordwijk, The Netherlands 3 Laboratoire de Physique Corpusculaire et Cosmologie, Coll`ege de France, 11 pl. Marcelin Berthelot, F-75231 Paris Cedex
5, France
4 Astronomy Center, Department of Physics and Astronomy, University of Sussex Falmer, Brighton BN19QH, United
Kingdom
5 Centre d’´etude spatiale des rayonnements, OMP, UPS, 9, Av. du Colonel Roche, BP4346, 31028 Toulouse, France 6 Observatoire de Haute Provence, F - 04870 Saint Michel l’Observatoire, France
7 Institut d’Astrophysique Spatiale, bˆat 121, Universit´e Paris Sud XI, 91 405 Orsay cedex, France 8 Harvard-Smithsonian Center for Astrophysics, 60 Garden street, Cambridge, MA 02138, USA
9 Astrophysics Research Institute, Liverpool John Moores University, Twelve Quays House, Egerton Wharf, Birkenhead CH41
1LD, UK
10 Physics Department, Carnegie Mellon University, Pittsburgh, PA 15213, USA
Received / accepted
Abstract. We study the gas mass fraction behavior in distant galaxy clusters observed within the X M M − Newton Ω project. The typical gas mass fraction fgasshape of high redshift galaxy clusters follows the global shape inferred at low redshift quite
well, once scaled appropriately : the gas mass fraction increases with radius and flattens outward. This result is consistent with the simple picture in which clusters essentially form by gravitational collapse, leading to self similar structures for both the dark and baryonic matter. However, we find that the mean gas profile in distant clusters shows some differences to local ones, indicating a departure from strict scaling. Assuming an Einstein-de Sitter cosmology, we find a slight deficit of gas in the central part of high-z clusters. This result is consistent with the observed evolution in the luminosity-temperature relation. We quantitatively investigate this departure from scaling laws by comparing fgasfrom a sample of nearby galaxy clusters (Vikhlinin,
Forman & Jones, 1999) to our eight high-z clusters. Within the local sample, a moderate but clear variation of the amplitude of the gas mass fraction with temperature is found, a trend that weakens in the outer regions. Taking into account these variations with radius and temperature, the apparent scaled gas mass fractions in our distant clusters still systematically differ from local clusters. This reveals that the gas fraction does not strictly follow a scaling law with redshift. This provides clues to understand the redshift evolution of the L − T relation whose origin is probably due to non-gravitational processes during cluster formation. An important implication of our results is that the gas fraction evolution, a test of the cosmological parameters, can lead to biased values when applied at radii smaller than the virial radius. From our X M M clusters, as well as Chandra clusters in the same redshift range, the apparent gas fraction at the virial radius obtained by extrapolation of the inner gas profile is consistent with a non-evolving universal value in a high matter density model while in a concordance, model high redshift clusters show an apparent higher fgasat the virial radius than to local clusters.
1. Introduction
Clusters of galaxies are unique cosmological probes whose sta-tistical properties represent major sources of information for understanding the history of structure formation as well as for the determination of the cosmological parameters. X-ray ob-servations are particularly relevant in this perspective as they
Send offprint requests to: R.Sadat Correspondence to: [email protected]
allow one to estimate the distribution of both the baryonic and total mass components, a rather unique situation when studying structures in cosmology. In the simplest picture of purely gravitationally-driven formation of virialized systems like galaxy clusters, it is expected that such objects exhibit self-similarity (Kaiser 1986). In this model physical properties of galaxy clusters obey scaling laws which naturally emerge from the fact that there is no preferred scale and therefore two clus-ters of different masses should have identical internal structure
Sadat & al.: Gas mass fraction in distant clusters 3 when normalized to the virial radius. Furthermore, such
inter-nal structure should be independent of redshift. Self-similarity applies to both the dark matter component and to the hot X–ray emitting intra-cluster medium (ICM). As clusters of different masses arise from fluctuations of different amplitude (relative to the r.m.s. value), such a scaling is not expected to hold ex-actly. Furthermore, in cosmological models different from the Einsten-de Sitter model, the strict self-similarity of the expan-sion of the universe might be broken. Nevertheless numeri-cal simulations have shown that the relations between physi-cal quantities expected from the sphysi-caling laws hold very well (Bryan & Norman 1998). Comparison of expected relations to observations is therefore expected to provide key information on their formation processes.
The observed properties of clusters are different from the scaling predictions, for example the observations lead to a luminosity-temperature relation which scales as L ∝ T3 while theoretical models predict L ∝ T2. Such deviations from scaling laws are interpreted as due to non-gravitational processes such as preheating by early galactic winds (e.g. Kaiser 1991; Evrard & Henry 1991, David et al. 1995, Cavaliere, Menci, & Tozzi 1998) or to radiative cooling (Pearce et al. 2000; Muawong et al. 2002) and feedback from star formation or AGN (Voit & Bryan 2001, Valageas & Silk 1999). The excess of entropy (the so-called ”entropy floor”) in cold system, provides further evidence of the importance of non-gravitational processes (Ponman et al. 1999; Lloyd-Davis et al. 2000). Although some numerical simulations including radiative cooling and/or pre-heating were able to reproduce the observed steepening in the LX–T relation consistent with the observations (Bialek et al. 2001, Borgani et al. 2001), it is yet unclear whether the relevant physics has been properly identified and implemented.
Self-similar models also make predictions on the evolution of cluster properties. In particular the LX–T relation should scale as (z + 1)Γwhere Γ should be equal to 3/2 in an Einstein de Sitter (EdS) universe. Several studies have found evidence of a weak evolution in the LX–T relation (Sadat et al. 1998; Reichart et al. 1999). However, the luminosity estimates de-pend on the assumed cosmological parameters as does the con-straint on the amount of evolution. From the analysis of recent X MM − Newton data of high-z clusters it has been found that
Γ ∼ 0.65 in an EdS Universe while in a concordance model
this value is close to 1.5, close to the value expected accord-ingly to standard scaling laws (Lumb et al. 2004). This result is consistent with previous investigations based on ASCA and Chandra data (Sadat et al. 1998; Novicki et al. 2002; Vikhlinin et al. 2002). The cosmological implication of such evolution has been presented in Vauclair et al. (2003). The aim of the present study is to better understand the evolution of the gas mass fraction with redshift. We will show that understanding these properties is important to put constraints on the cosmo-logical parameters by requiring that the gas mass fraction re-mains constant with look-back time. Indeed, comparing the profiles of clusters at different redshifts provides more infor-mation than simply considering global quantities such as the total X-ray luminosity.
We base our analysis on the XMM data obtained on a sam-ple of eight distant clusters observed as part of the X MM − Newton Ω project, a systematic X MM − Newton guaranteed time follow-up of the most distant SHARC clusters (Bartlett et al. 2002). The high sensitivity of X MM − Newton allows us to investigate emissivity in high redshift clusters beyond half the virial radius, a remarkable result (Arnaud et al. 2002). Our sample represents an homogeneous sample of eight bona fide clusters with median luminosities between 2 and 15 1044 erg/s (in an Einstein de Sitter cosmology with a Hubble con-stant of 50 km/s/Mpc) with redshifts in a relatively restricted range, between 0.45 and 0.65. This sample is therefore ex-pected to be fairly representative of the cluster population at high redshift, allowing a systematic analysis of the gas mass profiles and therefore allowing us to address the issue of gas mass fraction self-similarity and its implications in constrain-ing the cosmological parameters. Moreover, the high sensitivity of X MM − Newton makes possible a statistical investigation of the outer gas distribution in this sample, a key aspect as we will see. The detailed data reduction and analysis of this sample is presented in Lumb et al. (2004). The present paper is organized as follows. In section 2 we discuss the expectation of the gas mass fraction from scaling arguments as well as the results of the comparison of gas mass fraction in distant clusters to low redshift ones. In section 3, we discuss the consequence of our findings for the use of clusters as cosmological probes. Finally, our conclusions are given in section 4. We used a Hubble con-stant of 50 km/s/Mpc unless the dependence is explicitly given (with H0= 100hkm/s/Mpc).
2. Scaling properties
Self-similar assumptions imply that the radial profile of any physical quantity should exhibit a similar shape independently of the cluster mass and at any redshift, once normalized to the virial radius. Numerical simulations in which only gravi-tational physics is taken into account indicate that halos of dif-ferent masses follow a universal density profile, the so-called NFW profile (Navarro, Frenk & White 1996). On the observa-tional side, the X-ray emissivity profiles in hot galaxy clusters have been also found to be very similar, at least in the outer part (Ponman et al. 1999; Neumann & Arnaud 1999, Arnaud, Neumann & Aghanim 2001). Furthermore, evidence has been found that radial profiles of the fgas , as well as the baryon fraction fb, are similar and seem to follow a roughly universal
shape (Roussel et al. 2000, hereafter RSB00). It has been found that such a universal profile is in reasonable agreement with the predictions of numerical simulations (Sadat & Blanchard 2001; hereafter SB01). This supports the idea that the gas structure has not been strongly disturbed by non-gravitational processes and supports the principle of using their properties to constrain cosmological parameters.
Previous studies of the baryonic content in clusters indicated that baryons contribute 15-20% of the total cluster mass (for h = 0.5); if the baryon fraction fb = Mb/M is representative
of the universe as a whole and, provided that the actual baryon abundance is known, the cosmological matter density parame-ter ΩMshould lie in the range Ωb/fb = 0.2 − 0.5 (White et al.
4 Sadat & al.: Gas mass fraction in distant clusters
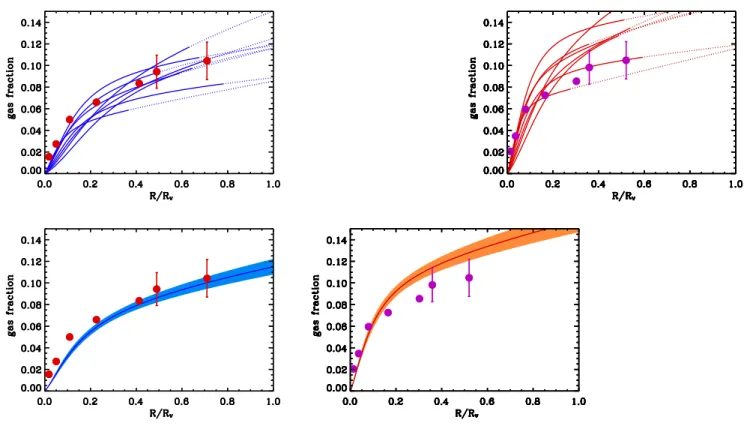
Fig. 1. Apparent fgasplotted versus radius normalized to the virial radius R/RV. The left side corresponds to fgasin an Einstein-de Sitter model and the right side to the concordance model. In the upper graphs, the lines show the individual clusters fgasup to the maximum radius of detection (see Lumb et al. 2004), dots correspond to extrapolated fgas. The data (red and purple circles) are the fgasin local sample (from RSB00 for the inner part and from VFJ99 in the outer parts) in an Einstein de Sitter cosmology and in a flat low density model. The error bars correspond to the typical dispersion in the VFJ99 sample. In the lower graphs, the average apparent fgasand its uncertainty are plotted (filled area).
1993, David et al. 1995, Evrard 1997). However, although the gas mass fraction profile follows quite well the self-similarity assumption (RSB00), the density parameter derived from the baryon fraction estimation might be corrupted by different ef-fects that are related to the internal structure of the gas and that could alter the inferred value (SB01).
2.1. Estimation of the cluster
f
gasunder the scalinghypothesis
As already mentioned, the self-similarity hypothesis implies that the spatial variation of any physical quantity depends solely on R/Rv; the virial radius Rv can be obtained from its definition Mv = 4/3πρ(1 + z)3(1 + ∆v)R3v: Rv= 1.34M1/315 (Ω0(1 + ∆v)/179)1/3h −2/3 (1 + z)−1 (h−1 Mpc) (1) where ∆v is the virial contrast density compared to the uni-verse. In an Einstein-de Sitter universe, one has ∆v = 18π2. In other cosmological models, there is some ambiguity as to how to define the proper reference radius for scaling relations. Commonly, the virial radius is defined from the spherical top-hat model (see for instance Bryan & Norman, 1998; note ttop-hat these authors provide useful fits to compute ∆v with formu-lae involving ∆c, the contrast density, compared to a critical
universe of density ρc(z) = 3H(z)2/8πG). The scaling of the
mass-temperature relation is then obtained from T ∝ GM/Rv:
T = AT MM152/3(Ω0(1 + ∆v)/179)1/3h2/3(1 + z)keV (2)
The normalization AT M can be obtained from numerical
sim-ulations (Evrard, Metzler, Navarro 1996, Bryan & Norman 1998) or inferred from observations. In the following, we use the same calibration as in SB01, AT M = 5.86, allowing a
di-rect comparison with their results. Several studies have been performed in order to test the MV–T relation as predicted from numerical simulations by means of X-ray observations (see e.g. Horner et al. 1999, Nevalainen et al. 2000, Finoguenov et al. 2001, Sanderson et al. 2003). Disagreements have been found concerning both the normalization AT M and the slope (steeper
than the predicted 1.5) for cooler systems (TXless than 4 keV). Note however that different normalizations AT M of the MV–T relation are not expected to make a difference in the compari-son between local and high redshift samples, therefore the fgas test is essentially based on the assumption that scaling of the Mgas−T relation is correct.
Sadat & al.: Gas mass fraction in distant clusters 5
Mgas(r)/Mtot(r) is computed for each cluster. The gas mass
pro-file follows directly from the electron number density propro-file:
Mg(r) = 4π mp 1 − Y/2. r Z 0 ne(r) r2dr. (3)
where Y is the helium mass fraction (hereafter Y = 0.25). We assume a fully ionized gas, spherically distributed, and a β– model for its distribution, which is known to provide a good representation of the gas out to the outer regions (VFJ99):
ne(r) = ne(0) 1 + r rcX !2 −3 2β (4) where rcX end β corresponding to the best fit values derived in Lumb et al. (2004). The central gas density ne(0) was derived
from the normalization K of the XSPEC Mekal model defined by K = 10 −14 4π(Da∗(1 + z))2 Z nenpdV. (5)
where neand npare respectively the electron and proton
num-ber densities and Dais the angular distance to the cluster. We
assume np = 0.82ne in the ionized intra-cluster plasma. The emission integral EI ∝R nenpdV was evaluated assuming that
the x-ray emission extends up to the virial radius, in order to be fully consistent with Lumb et al. (2004). There is some arbitrariness in the assumption of the radius up to which the emission has to be taken into account, ranging from the largest radius at which the emission is detected up to infinity. For our sample, the contribution to the flux of the emission, esti-mated by extrapolation of the fitted profile, beyond the detec-tion radius is less than 1%, and therefore represents a negligible source of uncertainty on our derived gas masses.
The normalization K value of each cluster was taken from Table 2 of Lumb et al. (2004).
The dark matter profile was assumed to follow the NFW an-alytical profile (Navarro et al. 1996) with a concentration pa-rameter c = 5 in order to allow direct comparison with RSB00 (again, changing the value of the concentration parameter is not expected to modify the relative comparison of local and distant clusters). In this study we will consider two cosmologies: an Einstein-de-Sitter (EdS) Universe (Ωm= 1) and a concordance
model (ΛCDM) Universe with (Ωm= 0.3, Ωλ= 0.7). The
ap-parent fgasvalues of our X MM − Newton clusters estimated at r500are given in Table 1 for both cosmologies. The mean fgas value at r500is fgas= 0.095 in an EdS model and fgas= 0.14 in a ΛCDM model.
2.2. The shape of the apparent gas mass fraction
In order to investigate the global shape of fgasprofile we have followed the procedure similar to RSB00. We compute fgas up to the maximum radius of detection (published in Lumb et al. 2004). Beyond this limit, this limit fgas is obtained by extrapolating up to the virial radius. The radial distribution in the local sample is derived using the published fgas val-ues up to the X-ray limiting radius RX lim (RSB00), upward
of this radius we computed fgas at the two fiducial radii R1000 and R2000defined by Vikhlinin, Forman & Jones (1999, here-after VFJ99) for which they published the gas masses (Mg = 4/3πρg(1 + ∆)R3∆(1 + z)3), allowing a comparison in the most
outer regions. For this comparison we do not correct for clump-ing (Mathiesen et al. 1999) as the radial variation of this quan-tity is unknown. Moreover, if the scaling holds, the emission of both local and distant clusters should be biased by the same amount by this effect, still allowing a meaningful direct com-parison.
The scaled fgasradial profiles of the individual high-z clus-ters and the mean fgas profile of the local sample derived for both EdS and ΛCDM models are displayed in Fig. 1. For a given value of the normalization AT M, the virial radius (for a
given temperature) depends on the cosmology through equa-tion 1 and 2. However, in practice for a NFW profile the masses inferred in a fixed physical radius for low redshift clusters are very similar in both cosmologies. As expected, a noticeable difference in the amplitude of fgas in distant clusters appears, depending on the cosmological model. For both cosmological models, the scaled fgasprofile of distant clusters is globally in good agreement with what has been inferred for clusters at low redshift by SB01: the apparent mean gas profile of our dis-tant clusters increases from the center to outer shells follow-ing roughly a universal gas mass fraction shape. Interestfollow-ingly, these fgasexhibit a level of dispersion consistent with what has been found previously (RSB00, VFJ99). In the EdS model the most central values of fgasseem smaller in high redshift clus-ters. Such a deviation is consistent with the measured evolu-tion of the LX–T relation, weaker than expected if the scaling strictly hold. Conversely, in the low density flat model, fgas val-ues in the central parts of distant clusters seem to agree more with the scaling, again in agreement with the evolution of the LX–T relation in this cosmology. However, in the outer regions the mean fgasin the X MM − Newton distant sample seems not to match the local one very well. Examination of the average fgascompared to the local one more clearly reveals a systematic difference: the inner mean gas mass fraction in distant clusters does not rise in as rapidly as in the local sample. It is unclear whether this difference is real, given the various origins of clus-ters used in the local sample.
2.3. fgas–Tx correlation
In order to understand whether the above difference is mean-ingful, an accurate knowledge of the gas mass fraction is needed. By examination of the RSB01 sample, restricted to clusters for which the actual X-ray extension was known, we found a clear trend of fgas increasing with temperature (this trend is much less clear in the global sample). However, this sample was not designed to offer a uniform sample for X-ray studies, therefore it has been used only as a guideline in the present study. To examine in a more systematic and uniform way whether fgas varies with temperature, we have computed fgasof nearby clusters at the two fiducial radii R2000, R1000used in VFJ99 as well at the virial radius. The gas mass fraction in our high-z cluster sample has been estimated at the same
aver-6 Sadat & al.: Gas mass fraction in distant clusters Cluster name RXJ0337.7 RXJ0505.3 RXJ0847.2 RXJ1120.1 RXJ1325.5 RXJ1334.3 RXJ1354.2 RXJ1701.3 z 0.577 0.51 0.56 0.60 0.445 0.62 0.551 0.45 T (keV) 2.6 2.5 3.62 5.45 4.15 5.2 3.66 4.5 +0.4 −0.3 ±0.3 +0.8 −0.3 ±0.3 +0.4 −0.3 +0.30 −0.32 +0.6 −0.5 +1.5 −1. r500(EdS) 0.723 0.757 0.867 1.024 1.041 0.982 0.879 1.079 fgas(EdS) 0.0782+0.009−0.010 0.0987 +0.011 −0.009 0.0959 +0.005 −0.015 0.1054 +0.006 −0.005 0.0703 +0.005 −0.005 0.095 +0.005 −0.005 0.1162 +0.014 −0.013 0.1016 +0.025 −0.023 r500(ΛCDM) 1.315 1.358 1.572 1.87 1.843 1.799 1.591 1.911 fgas(ΛCDM) 0.1109+0.014−0.015 0.1500 +0.018 −0.014 0.1431 +0.021 −0.025 0.1495 +0.009 −0.007 0.1007 +0.007 −0.008 0.1446 +0.009 −0.007 0.1825 +0.025 −0.022 0.1424 +0.038 −0.034
Table 1. Apparent gas mass fractions at r500in both EdS and ΛCDM cosmologies with h = 0.5, uncorrected for clumping, with uncertainties from temperature uncertainties. Temperature measurements are taken from Lumb et al. (2004) without cooling flow excision.
Radius Gas fraction Gas fraction (Ωm= 1) (Ωm= 0.3)
R2000 0.061T0.31±0.06(17%) 0.063T0.32±0.06(16%)
R1000 0.075T0.23±0.06(17%) 0.075T0.24±0.06(17%)
Virial 0.090T0.14±0.07(18.8%) 0.097T0.095±0.08(22%) Table 2. Least square fit of the gas fraction to the local sample
of x-ray clusters. Uncertainty in the normalization constant is 4-5%. The dispersion around the fit is also given in percent.
age radii (in units of the virial radius) allowing a direct com-parison between the local and distant fgasvalues. In our distant clusters, X-ray emission is detected up to a radius comparable to R1000 so direct comparison is meaningful. Emission has to be extrapolated up to Rv; it was extrapolated in both samples in similar ways. For further comparison we have also computed the baryon fraction for clusters within the same redshift range from Chandra data obtained by Vikhlinin et al. (2002) whose x-ray detection extends typically up to the virial radius.
For a fixed value of the normalization AT M of the mass–
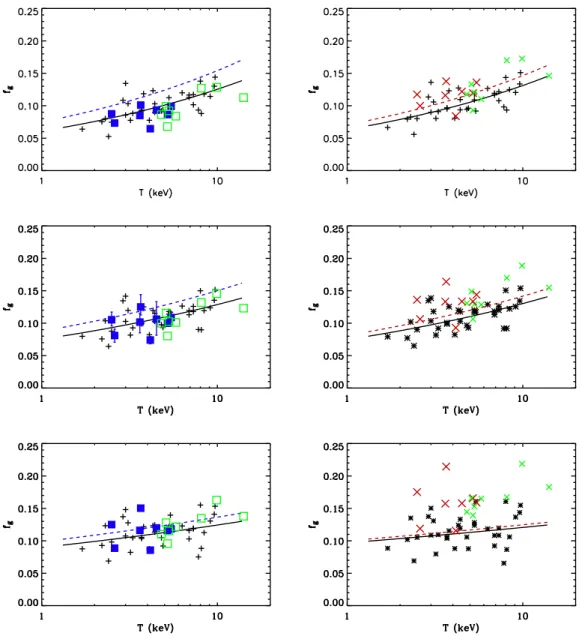
temperature relation, the virial radius and the total mass en-closed in a given physical radius depend on the cosmological model. In Figure 2, we have plotted fgas in the local and high redshift clusters versus temperature for the two cosmological models. Results from least square fits of the local data are given in Table 2, as well as dispersions around the best fit line. fgas values derived from the local sample reveal a clear trend with temperature: the gas mass fraction at a fixed scaled radius in-creases with temperature. This trend is stronger in the inner radius (R2000) than at the outer radius (R1000). At the virial ra-dius, the inferred gas fractions are marginally consistent with gas mass fractions being independent of temperature (∼ 2.5σ in the Einstein–de Sitter model and ∼ 1.5σ in the concordance model). This shows that the apparent fgasin local clusters pos-sesses internal structure variations correlated with temperature, therefore the scaling in local clusters is only approximate. The origin of these variations is unclear: it might either be an
ac-tual variation of fgas in clusters, but it might also be due to a variation of the clumping of the gas with temperature. The X MM distant sample does not reveal any clear trend with tem-perature, due to its limited temperature range. However, when combined with Chandra clusters, a sequence appears similar to the one observed in local clusters. Comparison of the high-z fgasat R1000and R2000radii reveals that this internal structure also varies with redshift: the observed mean fgasprofile of dis-tant clusters seems to increase toward the outer part less rapidly than in local clusters. This introduces an additional degree of complexity when it comes to the description of the scaling pre-dictions. Indeed if the gas mass fraction varies with T , scaling would imply:
fg(R/Rv,T, z) = fg(R/Rv,T × T∗(0)/T∗(z), z = 0) (6)
where T∗(z) is the characteristic temperature associated
with a characteristic mass scale at the epoch z (defined by σ(M∗,z) = constant). Therefore, we plot the predicted
variations of fgas under this scaling assumption. Comparing predictions from this scaling scheme at the three different radii shows that the variations with redshift of the internal structure do not follow the scaling either. This is a clear indication that clumping arising from hierarchical building of clusters in a purely gravitational picture is not the only origin of the observed complexity. Rather, it is likely to originate from non-gravitational heating processes, whose modifications of the internal structure of clusters are not expected to follow standard scaling. It is interesting that at the virial radius, the fgas values we obtained for X MM and Chandra clusters are
consistent and suggest that the gas fraction may not vary any longer with temperature. As our gas quantities are extrapolated beyond emission detection (although not by much, especially in the case of the Chandra clusters), it would be important to have deeper observations of the outer regions of clusters to confirm this result, both for local and distant clusters.
Finally we have also considered another possibility. Vauclair et al. (2003) have shown that the concordance model
Sadat & al.: Gas mass fraction in distant clusters 7
Fig. 2. fgas versus temperature at three different radii R2000 (top), R1000 (middle) and Rv (bottom) in the outer parts of the X MM − Newton distant clusters (blue squares and red crosses) in Einstein de Sitter model (on the left) and in a concordance model (crosses on the right side) compared to the same quantity (plus symbols) evaluated at the same scaled radii from the local sample by VFJ99. Open (green) squares and small (green) crosses are the same quantities evaluated for clusters in the Vikhlinin’ sample (Vikhlinin et al., 2002) within the same redshift range (0.4 < z < 0.62). Errors bars (coming from the uncertainty on the temperature) have been drawn in one case (R1000). In the concordance case, standard scaling of the mass–temperature relation leads to gas fractions represented by the (red) crosses. Dashed (colored) lines are the expected fgasat the fiducial redshift of the X MM − Newton clusters from scaling relations.
when properly normalized to local cluster abundances, could not reproduce the observed numbers counts of distant clusters unless the mass temperature scaling with redshift is modified: T = AT MM152/3(Ω0(1 + ∆v)/179)1/3h2/3keV (7) (i.e. the (1 + z) term in Eq. 2 has been removed). This changes the apparent gas mass fraction in distant clusters as well as the predictions of the scaling model. The gas mass fractions on both low and high redshift clusters were recomputed, as was the expected scaled variation of fgaswith temperature. The results are shown as green symbols and lines in the colored version
of Figure 3. Again, the scaling hypothesis seems not to work well under this scheme, perhaps not surprisingly given that the scaling has been already abandoned.
3. Cosmological application
The idea that the actual fgasin clusters should be universal is the starting point of an interesting cosmological test that has been proposed based on the apparent evolution of fgaswith redshift (Sasaki 1996; Pen, 1997; Cooray 1998). The principle of this test is based on the fact that the inferred gas mass fraction from
8 Sadat & al.: Gas mass fraction in distant clusters
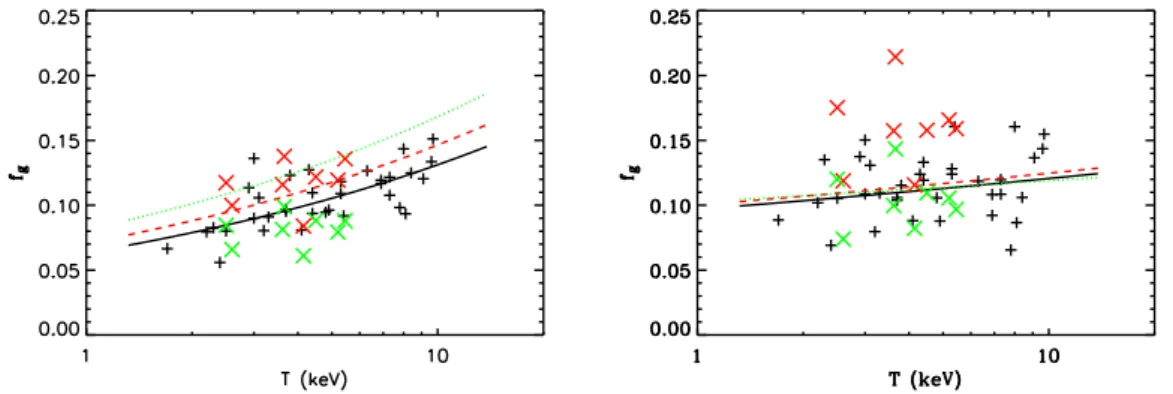
Fig. 3. Same quantities as in Figure 2. Light grey (green) crosses were obtained for a concordance model assuming the
non-standard scaling MV–T relation from Vauclair et al (2003), Eq. 4. The dotted (green) line is the expectation from scaling in this case. Left side is at (R2000), right side is at the virial radius.
X-ray data depends on the assumed cosmology through the an-gular distance. Comparing the high redshift value to what is inferred from local clusters provides us in this way with a new test to constrain the cosmological parameters.
However, from our study, it appears that there are several sources of complexity when applying this test. A first fact that should be taken into account is that fgas varies with ra-dius inside clusters. This variation can be accommodated if the shapes are self-similar, by working at identical scaled radius, i.e. R/Rv = constant (or in a nearly equivalent way, at simi-lar density contrast). Clearly, in order to prevent any bias one should compare fgasat identical radii (in units of virial radius) up to which gas emission is detected. The second problem is that the apparent fgashas been found to vary with temperature (mass). There has been some debate on the strength of this ef-fect (David et al 1995, Arnaud & Evrard 1999, Mohr et al 1999, RSB00), but such a possibility should be kept in mind when ap-plied to cosmological purposes. What we have obtained from the analysis of the VFJ99 sample is that in the inner part of clus-ters both the shape and the amplitude of the gas mass fraction varies with temperature. In such a regime, it is unclear whether arguments based on the scaling hypothesis are valid. However, our result are consistent with the hypothesis that the gas frac-tion is constant at the virial radius. It is therefore vital to have better data on the fgasbehavior in clusters in their outer part, in order to reach conclusions of cosmological relevance.
The fact that the dispersion in fgas measurements in our distant sample is similar to that obtained in local clusters is very positive. Indeed, uncertainties on fgas(from uncertainties on temperature and flux) in our distant clusters are signifi-cantly smaller than the intrinsic scatter (see Fig 2). From our study it appears that although the global fgas shape in distant clusters is similar to the shape obtained at low redshift, the complex internal structure, i.e. the variation of the gas mass fraction with radius, with temperature and with redshift reveals differences that cannot be described in a simple scalable scheme. The observed variations in the central parts are clear indications that fgasevolution argument cannot be used in this regime, given the present (lack of) understanding of the gas physics in clusters. However, the fact that fgas appears to be
almost constant against temperature at the virial radius is an important piece of information indicating that the argument of a non-evolving fgas could be valid at this radius. From Fig. 2, we can see that fgasderived from X MM − Newton clusters as well as from Chandra clusters are consistent with the values obtained in low redshift clusters for the EdS model, while we observe a clear offset between fgas values in distant and nearby clusters computed in the case of a ΛCDM model. The concordance model under the assumption of standard scaling has been found to be ruled out at a level of significance of more than 4 σ from the XMM data (6 σ when combined with Chandra measurements) while the Einstein–de Sitter model lies at better than 1 σ.
Several aspects however make the direct cosmological inter-pretation difficult. First our sample is quite small and it would be invaluable to have an extended version with a significantly larger number of clusters. However, the fact that similar results are obtained from the Chandra data is very encouraging. As a trend has been found with temperature, it is possible that similar trends exist with luminosity. Therefore meaningful statistical comparisons require data from X-ray selected cluster samples and as much as possible from comprehensive analysis. The second point is that a clear trend with temperature exists and could be a source of confusion: temperatures in our sample are lower than in the local sample and therefore expected average fgas values are smaller (for the same R/Rv < 1). Comparing fgas in our clusters with the hottest local cluster, would have led to a systematic bias, at least for the inner regions. Indeed, it is expected that the brightest clusters (at a fixed temperature and at a given redshift) would have a higher inner baryon fraction than the average population. Therefore it is natural that the trend observed with temperature is also present with luminosity. Finally, we showed that the internal structure of the gas is not strictly identical in high and low redshift clusters, declining faster in the central part of high redshift clusters. This is consistent with what seems already to emerge from Fig. 1. This complex internal structure is probably the result of non-gravitational (pre) heating of the gas which is currently advocated to explain the observed LX–T relation, but might also result from more fundamental
Sadat & al.: Gas mass fraction in distant clusters 9 departure of scaling laws in the dark matter, for instance if c
evolved with redshift. These systematic variations with radius, temperature and redshift imply that the baryon fraction test should be performed with caution and probably only at the virial radius, although one expects that outer regions are more affected by clumping and it is not clear that clumping should follow simple scaling relations in a low density universe.
4. Conclusion
The observations of distant clusters with X MM − Newton offer an unique possibility to investigate the outer emissivity of the gas distribution in distant X-ray clusters. These observations have revealed for the first time the existence of a complex inter-nal structure which does not follow simple scaling laws but still does show some regularities. The X MM −Newton observations of the distant SHARC clusters reveal some interesting results on this issue: the shape of the apparent fgas derived for these clusters is in good agreement with the shape inferred by SB01 for local clusters. This is an independent confirmation that the scaled shape of the gas mass fraction in clusters is in rough agreement with numerical simulations. However, our analysis reveals some deviations from the standard scaling in the fgas profile of high redshift clusters. Furthermore, by comparing our distant clusters to a sequence of local clusters, we found a clear variation of the internal structure with temperature and redshift which cannot be described by simple scaling relations. This im-plies that the baryon fraction evolution, or lack thereof, cannot be used as a reliable cosmological test without better under-standing of the internal structure of clusters. Nevertheless, at the virial radius the gas fraction seems to be independent of temperature in the low redshift sample and therefore that the high-redshift clusters might be used to apply the cosmological test based on the assumption that fgas at the virial radius has a universal value independent of redshift, although existing data do not allow a firm statement about this hypothesis. From our sample of high redshift clusters at the virial radius the data are found to be roughly consistent with a non-evolving fgas in an Einstein-de Sitter model, but not within the standard concor-dance model in which the inferred apparent fgas appears sys-tematically higher than in local clusters, unless a non-standard scaling with redshift of the M − T relation (Vauclair et al. 2004) is used. However, the complex internal structure of the gas re-vealed by the present analysis of X MM − Newton clusters pre-vents us from drawing definitive conclusions on cosmological parameters, as the relevant quantities were extrapolated at the virial radius. In the concordance model the mean fgasvalue es-timated inside the radius of detections, is still found to lie at 4 σ above the mean gas mass fraction of nearby clusters with similar temperature.
Acknowledgements. This research made use of the X-Ray
Clusters Database (BAX) which is operated by the Laboratoire d’Astrophysique de Toulouse-Tarbes (LATT), under contract with the Centre National d’Etudes Spatiales (CNES). We acknowledge useful comments from the referee which contributed improving the content of this paper.
References
Arnaud, M., Neumann, D. & Aghanim, N. 2001, A&A 365, 80 Arnaud, M., Majerowicz, S., Lumb, D. H, Neumann, D. M., Aghanim
N., Blanchard, A., Boer, M., Burke, D., Collins, C., Giard, M., Nevalainen, J., Nichol, R. C., Romer, K. & Sadat, R. 2002, A&A 390, 27
Arnaud, M. & Evrard, A. E. 1999, MNRAS 305, 631
Bartlett, J. G. et al., 2001, proceedings of the XXI rencontres de Moriond, astro-ph/0106098
Bialek, J.J., Evrard, A.E. & Mohr, J.J. 2001, ApJ, 555, 597 Borgani, S., Governato, F., Wadslay, J. et al., 2001, ApJ 559, L71 Bryan, G.L. & Norman, M.L. 1998, ApJ 495, 80
Cavaliere, A., Menci, N. & Tozzi, P. 1998, ApJ 501, 493 Cooray, A. R., 1998, A&A 337, 71
David, L. P., Jones, C. & Forman, W. 1995, ApJ 445, 578 Evrard, A. E, 1997, MNRAS 292, 289
Evrard, A. E. & Henry, J. P. 1991, ApJ, 383, 95
Evrard, A. E, Metzler, C. A., & Navarro, J. F., 1996 ApJ 469, 494 Finoguenov, A., Reiprich, T. H. & Bohringer, H. 2001, A&A 368,
749
Horner, D. J., Mushotzky, R. F. & Scharf, C. A. 1999, ApJ 520, 78 Kaiser, N. 1986, MNRAS 222, 323
Kaiser, N. 1991, ApJ 383, 104
Lloyd-Davies, E. J., Ponman, T. J. & Cannon, D. B. 2000, MNRAS 315, 689
Lumb, D. H., Bartlett, J. G., Romer, K., Blanchard, A., Burke, D., Collins, C., Nichol, R. C., Giard, M., Marty, P., Nevalainen, J., Sadat, R. & Vauclair, S. 2004, A&A 420, 853
Mathiesen, B., Evrard, A. E. & Mohr, J. J. 1999, ApJ 520, L21 Mohr, J. J., Mathiesen, B. & Evrard, A. E., 1999, ApJ 517, 627 Mohr, J. J., Mathiesen, B. & Evrard, A. E. 1999, ApJ 517, 627 Muanwong, O., Thomas, Peter A. K., Scott T. P. & Frazer R. 2002,
MNRAS 336, 527
Navarro, J. F., Frenk, C. S. & White, S. D. M. 1997, ApJ 490, 493 Nevalainen, J., Markevitch, M. & Forman, W. 2000, ApJ 532, 694 Novicki, M. C., Sornig, M. & Henry, J. P. 2002, AJ 124, 2413 Neumann, D. & Arnaud, M. 1999, A&A 348, 711
Pearce, F. R., Thomas, P. A., Couchman, H. M. P. & Edge, A. C. 2000, MNRAS, 317, 1029
Pen, Ue-Li 1997, NewA, 2, 309
Ponman, T.J., Cannon, D. B. & Navarro, J. F. 1999, Nature 397, 135 Reichart, D. E., Castander, F. J. & Nichol, R. C. 1999, ApJ 516, 1 Roussel, H., Sadat, R. & Blanchard, A. 2000, A&A 361, 429 Sadat, R., Blanchard, A. & Oukbir, J. 1998, A&A 329, 21 Sadat, R. & Blanchard, A. 2001, A&A 329, 21
Sanderson, A. J. R., Ponman, T. J., Finoguenov, A., Lloyd-Davies, E. J. & Markevitch, M. 2003, MNRAS 340, 989
Sasaki, S. 1996, PASJ 48, 119
Vauclair, S. C., Blanchard, A., Sadat, R., Bartlett, J. G., Bernard, J.-P., Boer, M., Giard, M., Lumb, D. H., Marty, P. & Nevalainen, J. 2003, A&AL, 412, L37
Valageas, P. & Silk, J. 1999, A&A, 347, 1
Vikhlinin, A., Forman, W. R. & Jones, C. 1999 (VFJ99), ApJ 525, 47 Vikhlinin, A., Van Speybroeck, Markevitch, M., Forman, W. R. &
Grego, L. 2002, ApJ 578, L107
Voit, G. M.& Bryan, G. L. 2001, Nature, 414, 425
White, S. D. M., Navarro, J. F., Evrard, A. E. & Frenk, C. 1993, Nature 366, 429