DETECTING PROBLEMATIC EXECUTION PATTERNS THROUGH AUTOMATIC KERNEL TRACE ANALYSIS
GABRIEL MATNI
D ´EPARTEMENT DE G ´ENIE INFORMATIQUE ET G ´ENIE LOGICIEL ´ECOLE POLYTECHNIQUE DE MONTR ´EAL
M ´EMOIRE PR ´ESENT ´E EN VUE DE L’OBTENTION DU DIPL ˆOME DE MAˆITRISE `ES SCIENCES APPLIQU ´EES
(G ´ENIE INFORMATIQUE) AVRIL 2009
c
´ECOLE POLYTECHNIQUE DE MONTR ´EAL
Ce m´emoire intitul´e:
DETECTING PROBLEMATIC EXECUTION PATTERNS THROUGH AUTOMATIC KERNEL TRACE ANALYSIS
pr´esent´e par: MATNI Gabriel
en vue de l’obtention du diplˆome de: Maˆıtrise `es sciences appliqu´ees a ´et´e dˆument accept´e par le jury d’examen constitu´e de:
M. ROY Robert, Ph.D., pr´esident
M. DAGENAIS Michel, Ph.D., membre et directeur de recherche Mme BOUCHENEB Hanifa, Doctorat, membre
To my mom, Nadia whose infinite love,
ACKNOWLEDGEMENT
I would like to thank my beloved parents Nadia and Michel for their endless support, love and care. I thank my sisters Eva and Mirna who were always there to listen and advise.
I would also like to thank my research director, professor Michel Dagenais, for giving me the chance to acquire a very enriching experience in one of the most interesting fields in Computer Engineering. His advices were indispensable for the realization of this project.
Last but not least, I thank my laboratory collegues, Mathieu Desnoyers, Parisa Heidari, Pierre-Marc Founier and Benjamin Poirier for their technical support.
R ´ESUM ´E
Les processeurs multicoeurs, les syst`emes distribu´es et la virtualisation deviennent de plus en plus r´epandus, rendant ainsi le d´ebogage des syst`emes en production plus diffi-cile, surtout quand les probl`emes rencontr´es ne sont pas facilement reproductibles. Cette complexit´e architecturale a introduit une nouvelle gamme de probl`emes potentiels qu’on devrait pouvoir d´etecter `a l’aide de nouvelles m´ethodologies efficaces et extensibles. En effet, en trac¸ant le noyau d’un syst`eme d’exploitation, on est capable d’identifier les goulots d’´etranglement, les failles de s´ecurit´e, les bogues de programmation ainsi que d’autres genres de comportements ind´esirables. Le trac¸age consiste `a collecter les ´ev´enements pertinents se produisant sur un syst`eme en production, tout en ayant un impact minimal sur la performance ainsi que sur le flot normal d’ex´ecution. La trace g´en´er´ee est typiquement inspect´ee en diff´er´e, n’introduisant aucun impact sur le syst`eme trac´e.
Ce travail pr´esente une nouvelle approche bas´ee sur les automates pour la mod´elisation de patrons de comportements probl´ematiques sous forme d’une ou plusieurs machines `a ´etats finis ex´ecutables. Ces patrons sont ensuite introduits dans un analyseur qui v´erifie leur existence simultan´ement et efficacement dans des traces de plusieurs giga-octets. L’analyseur fournit une interface de programmation offrant des services essentiels aux automates.
Les patrons impl´ement´es touchent `a diff´erents domaines incluant la s´ecurit´e, le test de logiciels et l’analyse de performance. Les r´esultats de l’analyse fournissent suffisamment d’information pour identifier pr´ecis´ement la source du probl`eme ce qui nous a permis d’identifier une s´equence de code dans le noyau Linux pouvant g´en´erer un inter-blocage. La performance de l’analyseur est lin´eaire par rapport `a la taille de la trace. Les autres facteurs affectant sa performance sont discut´es. En outre, la comparaison entre la perfor-mance de l’analyseur par rapport `a celle d’une approche d´edi´ee, sugg`ere que le surcoˆut de l’utilisation des machines `a ´etats pour l’ex´ecution et non seulement pour la
mod´elisa-tion, est acceptable surtout lors d’une analyse diff´er´ee.
La solution impl´ement´ee est facilement parall´elisable et pourrait bien s’appliquer `a des analyses en-ligne. Le m´emoire se conclut par une liste de suggestions d’optimisations possibles pouvant encore am´eliorer la performance de l’analyseur.
ABSTRACT
As multi-core processors, distributed systems and virtualization are gaining a larger share in the market, debugging production systems has become a more challenging task, especially when the occurring problems are not easily reproducible. The new architec-tural complexity introduced a large number of potential problems that need to be detec-ted on live systems with adequate, efficient and scalable methodologies. By tracing the kernel of an operating system, performance bottlnecks, malicious activities, program-ming bugs and other kinds of problematic behavior could be accurately detected. Tra-cing consists in monitoring and logging relevant events occurring on live systems with a minimal performance impact and interference with the flow of execution. The generated trace is typically inspected remotely with no overhead on the system whatsoever. This work presents an automata-based approach for modeling patterns of undesired be-havior using executable Finite State Machines. They are fed into an offline analyzer which efficiently and simultaneously checks for their occurrences even in traces of se-veral gigabytes. The analyzer provides an Application Programming Interface offering essential services to the Finite State Machines. To our knowledge, this is the first attempt that relies on describing problematic patterns for kernel trace analysis.
The implemented patterns touch on several fields including security, software testing and performance debugging. The analysis results provide enough information to preci-sely identify the source of the problem. This was helpful to identify a suspicious code sequence in the Linux kernel that could generate a deadlock.
The analyzer achieves a linear performance with respect to the trace size. The remaining factors impacting its performance are also discussed. The performance of the automata-based approach is compared with that of a dedicated implementation suggesting that the overhead of using Finite State Machines for execution and not just for modeling is acceptable especially in post-mortem analysis.
matching. The thesis concludes by suggesting a list of possible optimizations that would further improve the analyzer’s performance.
CONDENS ´E EN FRANC¸ AIS
Les syst`emes informatiques ´evoluent tr`es rapidement, et se distinguent par un niveau de complexit´e sup´erieur `a celui de la g´en´eration pr´ec´edente. Parmi ces nouvelles tech-nologies, la virtualisation, s’ex´ecutant possiblement sur des processeurs multi-coeurs, offre des int´erˆets de plus en plus visibles, tel que l’utilisation optimale des ressources et la s´ecurit´e. Cependant, la complexit´e architecturale introduite pr´esente une nouvelle gamme de probl`emes difficiles `a cibler surtout quand ils apparaissent occasionnelle-ment sur des machines en production, et ne sont pas facileoccasionnelle-ment reproductibles. En ef-fet, le premier d´efi consiste `a d´eterminer `a quel niveau le probl`eme s’est produit : au niveau d’un processus s’ex´ecutant par-dessus la machine virtuelle, ou de la machine virtuelle elle-mˆeme, ou bien au niveau de la machine physique, pour en citer quelques-uns. ´Evidemment, les outils de d´ebogage traditionnels ne sont pas adapt´es `a l’analyse du comportement global du syst`eme et visent surtout un seul processus en particulier. Le manque d’outil ad´equat a donn´e naissance au trac¸age du noyau du syst`eme d’ex-ploitation. Le trac¸age consiste `a surveiller et enregistrer les ´ev´enements pertinents se produisant sur un syst`eme en production. Le but principal est de d´eterminer pr´ecis´ement ce que le syst`eme fait `a chaque instant.
Trac¸age du noyau Pr´esentement, de nombreux efforts visent `a extraire les ´ev´enements du noyau tout en ayant un impact minimal sur la performance du syst`eme (Bligh et al., 2007), (Cantrill et al., 2004) et (Eckmann et al., 2002). Ces ´ev´enements, typiquement g´en´er´es par l’ordonnanceur, les syst`emes de fichiers, les protocoles r´eseau, la communi-cation inter-processus, les appels syst`emes etc., donnent une vue globale et d´etaill´ee du fonctionnement du syst`eme. Le trac¸age peut ˆetre constamment activ´e pour une longue p´eriode de temps, g´en´erant ainsi plusieurs milliards d’´ev´enements ; il peut aussi ˆetre activ´e et d´esactiv´e par intermittence selon les conditions sp´ecifi´ees par l’utilisateur. Il peut ˆetre constamment activ´e mais sans sauvegarder les donn´ees sur le disque ; les
´ev´enements sont ´ecrits dans des tampons circulaires en m´emoire o`u les donn´ees les plus anciennes sont ´ecras´ees par les plus r´ecentes. L’´ecriture des ´ev´enements sur le disque ne s’effectue que lorsqu’un probl`eme se produit. Cette approche est particuli`erement utile pour investiguer des probl`emes se produisant accidentellement sur des machines en production.
Analyse de traces Une fois que la trace est g´en´er´ee, la prochaine ´etape consiste `a l’analyser `a l’aide d’outils de base, afin de d´eduire la source du probl`eme. Les outils les plus populaires constituent les filtres et les visualisateurs de traces. Les filtres permettent d’identifier tous les ´ev´enements satisfaisant un certain nombre de contraintes. Les visua-lisateurs tel que le diagramme de Gantt (LTTng, 2009), permettent au d´eveloppeur de se d´eplacer `a travers la trace afin de d´eterminer visuellement toutes sortes de compor-tements inattendus. Malgr´e l’utilisation de ces outils, l’analyse reste relativement ma-nuelle, inefficace et dans certain cas, impossible. En effet, il serait tr`es difficile et inef-ficace de d´etecter visuellement une mauvaise utilisation des verrous ou bien des signes d’attaques de d´eni de service. Notre travail consiste donc `a automatiser cette ´etape pour aboutir `a une analyse de trace plus pr´ecise et efficace. La trace est typiquement inspect´ee en diff´er´e, n’introduisant ainsi aucun impact sur le syst`eme trac´e.
Objectifs et m´ethodologie Notre objectif consiste `a d´etecter automatiquement la pr´esence d’anomalies dans des traces d’ex´ecution ce qui pr´esente les trois d´efis suivants :
1. Fournir un moyen simple, flexible et non-ambigu pour repr´esenter des comporte-ments probl´ematique.
2. Recueillir efficacement du noyau les ´ev´enements pertinents pour l’analyse. 3. `A partir d’un seul parcours `a travers la trace, valider l’existence des patrons
si-multan´ement et efficacement. Ensuite, `a la fin de l’analyse, fournir suffisamment d’information ciblant la source du probl`eme.
Pour ce faire, nous avons commenc´e par collecter un ensemble de sc´enarios probl´ema-tique touchant `a diff´erents domaines tels que la s´ecurit´e, l’analyse de performance et le test de logiciels. Ceci nous a permis de d´efinir les crit`eres de s´election qu’un lan-gage de description de patrons devrait satisfaire. Ensuite, nous avons ´etudi´e les prin-cipaux langages utilis´es dans divers domaines (tels que la d´etection d’intrusion et le d´ebogage de performance dans les applications r´eparties), que nous avons regroup´es en trois cat´egories : les langages sp´ecifiques au domaine, les langages g´en´eriques et les langages `a base d’automates. En se basant sur les crit`eres de s´election ´etablis, nous avons justifi´e notre choix du langage de description de patrons. L’analyseur ainsi que les diff´erents patrons collect´es ont ´et´e alors impl´ement´es, tout en ajustant selon les besoins, l’interface de programmation offerte par l’analyseur.
Crit`eres de s´election Les crit`eres de s´election sur lesquels nous nous sommes bas´es pour choisir le langage de description de patrons le plus convenable se r´esument comme suit :
– Simplicit´e et Expressivit´e : Le langage devrait fournir un ensemble minimal d’op´era-teurs suffisant pour d´ecrire les divers patrons d´ej`a collect´es. En mˆeme temps, il devrait ˆetre assez expressif pour exprimer des patrons non consid´er´es.
– Aucune ambigu¨ıt´e : La syntaxe du langage devrait ˆetre rigoureusement d´efinie, ne permettant qu’une seule interpr´etation de la description.
– Ind´ependance du traceur : Le langage ne devrait pas d´ependre du format interne de la trace. En effet, nous voudrions ´eviter d’utiliser un langage sp´ecifique au domaine pour plusieurs raisons : premi`erement, pour ´eviter le coˆut de maintenance d’un tel lan-gage. Ensuite, les langages sp´ecifiques au domaine sont g´en´eralement plus difficiles `a d´eboguer. Finalement, si le format de la trace varie, c’est uniquement l’analyseur qui devrait le supporter, ainsi tous les patrons d´ej`a d´efinis resteront intacts.
– Support de patrons `a plusieurs ´ev´enements : certains langages fournissent unique-ment des op´erateurs touchant `a un seul ´ev´eneunique-ment `a la fois. Ceci est `a ´eviter car
les comportements probl´ematiques consid´er´es d´ependent tr`es souvent d’une s´equence d’´ev´enements bien d´efinie.
– Distinction entre une analyse en ligne et hors-ligne : la description des patrons ne doit pas d´ependre du mode en ligne ou hors-ligne de l’analyse.
Taxonomie des langages Les langages sp´ecifiques au domaine constituent le pre-mier groupe que nous subdivisons en deux cat´egories comprenant les langages des-criptifs et imp´eratifs. Dans la premi`ere cat´egorie, on ´etudie le langage utilis´e par Snort (SNORT, 2009), un syst`eme de d´etection d’intrusion tr`es populaire `a base de r`egles. Dans la deuxi`eme cat´egorie, on ´etudie les langages de DTrace (Cantrill et al., 2004) et de SytemTap (Eigler, 2006) qui sont deux traceurs de noyau, permettant avec leurs lan-gages, d’effectuer une analyse en ligne. On ´etudie aussi RUSSEL (Habra et al., ), un langage de description de r`egles de s´ecurit´e.
Le deuxi`eme groupe comprend les langages g´en´eriques. On identifie dans ce groupe EXPERT (Wolf et al., 2004), un syst`eme de d´etection de probl`emes de performance dans des traces OpenMP et MPI. EXPERT emploie le language g´en´erique Python pour d´ecrire les propri´et´es de performance.
Dans le troisi`eme groupe, on d´ecrit et compare les principaux langages `a base d’au-tomates. Les langages de ce groupe offrent un haut niveau d’abstraction permettant de d´efinir des ´ev´enements synth´etiques `a partir de plusieurs ´ev´enements primitifs. On identifie dans cette cat´egorie Ragel (RAGEL, 2009), un langage souvant utilis´e dans les analyses syntaxiques. De mˆeme, on ´etudie STATL (Eckmann et al., 2002), un lan-gage qui permet de d´ecrire des sc´enarios d’attaque sous forme de machines `a ´etats finis. Finalement, on ´etudie le compilateur SMC (Compiler, 2009), un projet accessible et open-source. Ce dernier fournit un langage offrant des fonctionnalit´es et caract´eristiques le rendant tr`es extensible. En effet, le compilateur convertit le langage en 14 langages g´en´eriques support´es, et donc le code g´en´er´e est capable de profiter d’une interface de programmation fournie par un autre langage. Pour ces raisons, nous avons utilis´e SMC
pour d´ecrire les patrons capables de s’interfacer avec notre analyseur.
L’utilisation d’un langage `a base d’automates pour la description de patrons consiste `a mod´eliser le comportement probl´ematique sous forme d’une machine `a ´etats. La pr´esence d’un ´ev´enement particulier dans la trace va d´eclencher une transition d’un ´etat vers un autre, si la garde de transition est ´evalu´ee `a Vrai. `A ce moment-l`a, les actions d´efinies pour cette transition sont ex´ecut´ees. Les actions servent typiquement `a mettre `a jour les structures de donn´ees locales ou globales, `a s’interfacer avec l’analyseur ou `a g´en´erer des alertes.
Ensemble de patrons consid´er´es Avant d’´etablir les crit`eres de s´election d’un lan-gage convenable, il ´etait indispensable d’avoir une liste de patrons probl´ematiques et repr´esentatifs, touchant `a diff´erents domaines et qu’on regroupe en trois cat´egories :
Patrons de s´ecurit´e
1. L’attaque SYN flood : Le SYN flood est une attaque de d´eni de service qui consiste `a inonder un serveur avec un grand nombre de connexions TCP semi-ouvertes. Les indices d’une telle attaque sont visibles dans une trace du noyau si les ´ev´enements pertinents sont instrument´es. Il est tr`es inefficace de d´etecter manuellement ce genre de patrons, d’o`u l’int´erˆet de notre approche.
2. Prison chroot : S’´echapper d’une prison chroot est un autre type d’attaque qu’on peut d´etecter. L’appel syst`eme chroot() est parfois utilis´e quand un processus pri-vil´egi´e veut restreindre l’acc`es `a un sous-arbre du syst`eme de fichier. Si ce proces-sus essaie d’ouvrir un fichier avant d’appeler chdir(”/”), alors une faille de s´ecurit´e se pr´esente. En effet, l’attaquant peut toujours sortir d’une prison chroot en tru-quant le programme pour ouvrir le fichier ../../../../etc/shadow par exemple. Res-treindre l’acc`es `a un sous-arbre n’est pas accompli par un appel unique `a chroot. La bonne fac¸on de proc´eder serait d’appeler chdir(”/”) imm´ediatement apr`es l’appel syst`eme chroot().
3. Les virus Linux : Malgr´e qu’ils soient difficiles `a trouver, les virus s’ex´ecutant sous Linux existent et peuvent ˆetre d´etect´es `a l’aide d’une trace d’ex´ecution. L’ap-proche qu’on propose diff`ere de celles utilis´ees dans les logiciels anti-virus. Lors-qu’un nouveau virus est d´ecouvert, il suffit de l’ex´ecuter sur une machine virtuelle roulant un noyau Linux instrument´e afin d’ˆetre capable d’enregistrer toutes ses interactions avec le syst`eme d’exploitation. Ces interactions d´efinissent le com-portement du virus que nous encodons sous forme de patron afin de d´etecter sa pr´esence `a partir d’une trace d’ex´ecution.
Patrons de test de logiciels
1. Utilisation des verrous : Les ressources partag´ees n´ecessitent une prise de verrou avant d’y acc´eder pour ´eviter les situations de comp´etition. Dans le noyau Linux, le verrouillage est plus d´elicat qu’en mode utilisateur `a cause des diff´erents ´etats possibles (pr´eemption activ´ee/d´esactiv´ee, traitement d’IRQ, etc.). Par exemple, un verrou tournant pris quand les interruptions sont activ´ees, ne doit jamais ˆetre pris dans un gestionnaire d’interruption. La raison est simple : l’interruption peut ar-river `a n’importe quel moment, particuli`erement lorsque le verrou est d´ej`a pris, inter-bloquant ainsi le processeur correspondant. Il est possible de s’assurer au moment de l’ex´ecution que toute prise de verrou est valide et de signaler celles qui ne le sont pas. Cependant, cette option requiert la recompilation du noyau et ajoute un impact en performance continu au syst`eme. Par cons´equent, nous encodons un sous-ensemble des r`egles d’utilisation des verrous sous forme d’une machine `a ´etats par CPU, et nous proc´edons `a leur validation dans des traces d’ex´ecutions. Ceci nous a permis d’identifier une s´equence de code dans le noyau Linux qui pourrait g´en´erer un inter-blocage.
2. Utilisation des descripteurs de fichiers : Un autre bogue de programmation d´etectable `a partir d’une trace, consiste `a acc´eder `a un descripteur de ficher apr`es l’avoir ferm´e. L’ouverture, l’acc`es et la fermeture d’un descripteur de fichier doivent
suivre un ordre bien d´efini. Ceci repr´esente une plus grande classe d’erreurs de pro-grammation o`u deux ou plusieurs ´ev´enements sont logiquement et temporellement reli´es.
Patrons de d´ebogage de performance
1. Inefficacit´es I/O : Certaines inefficacit´es dans les logiciels peuvent ˆetre d´etect´ees `a partir des ´ev´enements d’entr´ee et de sortie I/O. Par exemple, un processus qui ef-fectue de fr´equentes ´ecritures de tr`es peu de donn´ees au disque pourrait consid´erablement affecter la performance du syst`eme. De mˆeme, la lecture des donn´ees qui viennent d’ˆetre ´ecrites, ou bien deux lectures cons´ecutives des mˆemes donn´ees, ou l’´ecrasement des donn´ees qui viennent d’ˆetre ´ecrites, sont toutes des signes d’inefficacit´e vi-sibles dans une trace du noyau.
2. Contraintes temporelles : Les applications multim´edia, et plus g´en´eralement les applications temps-r´eel, sont caract´eris´ees par leurs contraintes temporelles. En supposant que le trac¸age de l’ordonnanceur du noyau a un surcoˆut n´egligeable, on v´erifie que les contraintes temporelles (telles que la p´eriode d’ordonnancement et la tranche de temps allou´ee) sont satisfaites et si elles ne le sont pas, on montre ce que le syst`eme faisait durant ce temps.
Impl´ementation LTTng (LTTng, 2009), un traceur noyau open-source, `a faible im-pact, a ´et´e choisi pour instrumenter les ´ev´enements requis pour notre liste de patrons. Le compilateur SMC a ´et´e utilis´e pour g´en´erer du code C `a partir des machines `a ´etats d´ecrites par le langage SM (voir section 3.4.2). Pour chaque ´ev´enement pertinent, l’ana-lyseur enregistre des fonctions de rappel avec le programme de lecture et de visualisation de trace LTTV. Ce programme lit la trace s´equentiellement en une seule passe. L’analy-seur maintient une liste de toutes les instances des machines `a ´etats (mod´elisant le mˆeme comportement probl´ematique) qu’il invoque s´equentiellement. Lorsqu’un ´ev´enement pertinent est rencontr´e, l’analyseur appelle les transitions correspondantes pour chaque
machine `a ´etats. Le flot de contrˆole est alors transf´er´e `a la machine `a ´etats qui, `a son tour, ´evalue les gardes de la transition et si elles sont ´evalu´ees `a Vrai, les actions sp´ecifi´ees sont ex´ecut´ees. L’´etat courant de la machine devient alors l’´etat destination de la tran-sition et le flot de contrˆole revient `a l’analyseur. Ce dernier invoque la machine `a ´etats suivante et ainsi de suite.
Dans certains cas, lorsqu’une transition est d´eclench´ee, une duplication de la machine `a ´etats est n´ecessaire. Par exemple, si le patron consiste `a d´etecter un acc`es erron´e `a un descripteur de fichier, une machine `a ´etats existerait pour chaque processus acc´edant `a un descripteur particulier. L’analyseur offre une interface de programmation API fournis-sant des services tels que la duplication et la destruction des machines `a ´etats. Certains patrons, tel que celui qui mod´elise une utilisation erron´ee des verrous, requiert une seule machine `a ´etats par CPU. Dans ces cas, l’analyseur d´etermine sur quel CPU l’´ev´enement est apparu, et appelle la transition de la machine `a ´etats de ce CPU.
L’approche `a base d’automates offre une grande flexibilit´e pour la mod´elisation, la mise `a jour et l’optimisation des patrons. En effet, lorsqu’on a instrument´e les ´ev´enements pertinents pour le patron qui consiste `a d´etecter les mauvaises utilisations des verrous, il a ´et´e remarqu´e que les ´ev´enements qui d´efinissent l’entr´ee et la sortie d’une interruption ne sont pas n´ecessaires vu que cette information peut ˆetre recueillie `a partir du site de prise du verrou. `A ce point-l`a, un ´etat et deux transitions de l’automate ont pu ˆetre ´elimin´es.
Performance En ex´ecutant l’analyseur pour valider des traces de diff´erentes tailles, il a ´et´e constat´e que le temps d’ex´ecution de l’analyseur est lin´eaire par rapport `a la taille de la trace. Cependant, trois autres facteurs affectent la performance de l’analyseur : le nombre de machines `a ´etats coexistantes durant l’analyse (section 3.6), leur complexit´e (consommation en m´emoire et temps de calcul) et la fr´equence d’´ev´enements pertinents dans la trace.
La performance de l’analyseur a aussi ´et´e compar´ee `a celle d’une version d´edi´ee. Cette derni`ere est impl´ement´ee en C et effectue les mˆemes validations que celles d´efinies
dans l’automate qui valide l’utilisation des verrous (voir section 3.4.3). La performance de l’analyseur est uniquement 4.5% plus lente que la version d´edi´ee, sugg´erant que le surcoˆut d’utilisation des automates pour l’ex´ecution, et non juste pour la mod´elisation, est acceptable surtout lors d’une analyse en diff´er´e.
La taille de la trace a ´et´e fix´ee alors que le nombre de clients dbench (un benchmark qui g´en`ere un grand nombre d’´ev´enements d’entr´ee et de sortie) ex´ecut´es sur la machine trac´ee varie. Pour le patron qui valide les utilisations des descripteurs de fichiers, le nombre de machines `a ´etats coexistantes augmente proportionnellement avec le nombre de clients dbench. On ´etudie alors le surcoˆut caus´e par le fait d’invoquer les machines `a ´etats. Le ralentissement est proportionnel au nombre de machines trait´ees simultan´ement par l’analyseur. Ceci est attendu car, pour chaque ´ev´enement pertinent, l’analyseur in-voque successivement toutes les machines `a ´etats coexistantes, mˆeme si l’´ev´enement est non pertinent dans l’´etat courant de l’automate. Si l’´ev´enement cause un d´eclenchement d’une transition dans une machine `a ´etats, on dit alors que l’´ev´enement a ´et´e consomm´e par cette derni`ere. Dans plusieurs cas, un ´ev´enement ne peut ˆetre consomm´e que par une seule machine `a ´etats. Pour cela, on a introduit une fonction API qui force l’analyseur `a sortir de sa boucle principale qui it`ere sur tous les automates, pour passer `a l’´ev´enement suivant ; une am´elioration non n´egligeable en termes de performance a ´et´e obtenue.
Travaux Futurs En premi`ere priorit´e, nous voudrions supporter les ´ev´enements syn-th´etiques. En exprimant un ´ev´enement synth´etique `a partir de plusieurs ´ev´enements pri-mitifs, il serait possible de d´ecrire des patrons plus complexes efficacement et d’une fac¸on modulaire. Le temps de calcul par ´ev´enement pertinent atteint 20 microsecondes pour un nombre total de machines `a ´etats coexistantes ´egal `a 516. Par cons´equent, si la fr´equence d’´ev´enements pertinents, se produisant sur un syst`eme en production, est inf´erieure `a 50kHz, les CPUs non-exploit´es compl`etement pourraient tr`es bien ˆetre uti-lis´es pour effectuer la validation des patrons en ligne. La solution propos´ee est facilement parall´elisable et il serait int´eressant d’´etudier le gain en performance r´esultant, dans le
TABLE OF CONTENTS
DEDICACE . . . . iii
ACKNOWLEDGEMENT . . . . iv
R ´ESUM ´E . . . . v
ABSTRACT . . . vii
CONDENS ´E EN FRANC¸AIS . . . . ix
TABLE OF CONTENTS . . . xix
LIST OF TABLES . . . xxii
LIST OF FIGURES . . . xxiii
LIST OF NOTATIONS AND SYMBOLS . . . xxiv
INTRODUCTION . . . . 1
CHAPTER 1 PATTERN DESCRIPTION LANGUAGES . . . . 6
1.1 Language Criteria . . . 6
1.2 Taxonomy of pattern description languages . . . 7
1.2.1 Domain Specific Languages . . . 8
1.2.2 Imperative DSLs . . . 11
1.2.3 General Purpose Programming Languages . . . 19
1.2.4 Automata-Based Programming Languages . . . 20
CHAPTER 2 TRACE ANALYZERS . . . . 33
2.1.1 EXPERT’s Architecture . . . 33
2.1.2 Performance Properties . . . 34
2.2 Frequent Pattern Mining . . . 36
2.2.1 System Architecture . . . 37 2.2.2 Discussion . . . 37 2.3 ASAX . . . 38 2.3.1 ASAX Features . . . 38 2.3.2 Discussion . . . 39 2.4 STAT . . . 39 2.4.1 STAT Features . . . 40 2.4.2 Discussion . . . 41 2.5 DTrace . . . 41 2.5.1 Discussion . . . 42 2.6 Discussion . . . 43
CHAPTER 3 ARTICLE: SCENARIO-BASED APPROACH FOR KERNEL TRACE ANALYSIS . . . . 46
3.1 Abstract . . . 46
3.2 Introduction . . . 47
3.2.1 Motivations and Goals . . . 47
3.2.2 Related Work . . . 48 3.3 Faulty Behavior . . . 50 3.3.1 Security . . . 50 3.3.2 Software Testing . . . 51 3.3.3 Performance Debugging . . . 52 3.4 Automata-Based Approach . . . 53 3.4.1 SM Language . . . 53
3.4.3 Locking Validation . . . 56
3.4.4 Real-time Constraints Checking . . . 58
3.5 Implementation . . . 59
3.6 Performance . . . 60
3.7 Conclusion . . . 63
3.7.1 Future Work . . . 64
CHAPTER 4 METHODOLOGICAL ASPECTS AND COMPLEMENTARY RESULTS . . . . 65
4.1 General Methodology . . . 65
4.2 Performance Analysis and Scalability . . . 68
4.2.1 Optimization . . . 68
CHAPTER 5 GENERAL DISCUSSION . . . . 71
5.1 Current Limitations . . . 71
5.2 Proposed Solution . . . 71
5.2.1 High-level Pattern Description . . . 72
5.2.2 Exhaustive Trace Analysis . . . 72
5.2.3 Offline/Online Analysis . . . 72 5.2.4 Maintenance . . . 73 5.2.5 Parallelization . . . 73 5.3 Promising Results . . . 74 CONCLUSION . . . . 75 REFERENCES . . . . 78
LIST OF TABLES
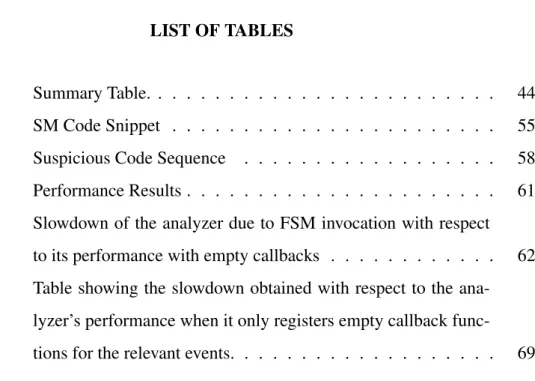
Table 2.1 Summary Table. . . 44 Table 3.1 SM Code Snippet . . . 55 Table 3.2 Suspicious Code Sequence . . . 58 Table 3.3 Performance Results . . . 61 Table 3.4 Slowdown of the analyzer due to FSM invocation with respect
to its performance with empty callbacks . . . 62 Table 4.1 Table showing the slowdown obtained with respect to the
ana-lyzer’s performance when it only registers empty callback func-tions for the relevant events. . . 69
LIST OF FIGURES
Figure 1.1 Russel Rule: Activates another rule upon detection of a failed login . . . 12 Figure 1.2 RUSSEL Rule: Counts the number of failed logins . . . 13 Figure 1.3 DTrace: Compute the time spent per thread in the read system call 15 Figure 1.4 DTrace: Output obtained upon running Example 1.3 . . . 15 Figure 1.5 DTrace: using the count aggregating function . . . 16 Figure 1.6 SystemTap: using the aggregation operator . . . 18 Figure 1.7 Example illustrating the Ragel syntax . . . 21 Figure 1.8 Example of State Declaration in STATL . . . 25 Figure 1.9 Example of Transition Declaration in STATL . . . 26 Figure 1.10 Example of Scenario Declaration in SM . . . 28 Figure 1.11 Example of State Actions Declarations in SM . . . 29 Figure 2.1 The EXPERT architecture . . . 35 Figure 2.2 System Architecture . . . 36 Figure 2.3 DTrace Architecture . . . 42 Figure 3.1 Detecting half-open TCP connections . . . 54 Figure 3.2 Escaping the chroot jail . . . 55 Figure 3.3 Locking Validation . . . 56 Figure 3.4 Real-Time Constraints Checking . . . 58 Figure 3.5 Fixing trace size to 500MB, varying the number of dbench clients 63 Figure 4.1 Fixing trace size to 500 MB, varying the number of dbench clients. 70 Figure 4.2 Fixing trace size to 500 MB, varying the number of dbench
LIST OF NOTATIONS AND SYMBOLS
AP I : Application Programming Interface DSL : Domain Specific Language
F SM : Finite State Machine - Machine `a ´etats finis IDS : Intrusion Detection System
LT T ng : Linux Trace Toolkit next generation LT T V : Linux Trace Toolkit Viewer
MP I : Message Passing Interface
NIDS : Network-Based Intrusion Detection System OpenMP : Open Multi-Processing
INTRODUCTION
Context The development and operation of embedded systems, multi-core proces-sors, multi-threaded and distributed applications with real-time constraints present new challenges that need to be overcome with adequate, efficient and scalable methodologies. The biggest challenge is to understand what the system is doing at any given time, with a minimal interference, in order to avoid an impact on the performance or the system behavior. To achieve this goal, the kernel of an operating system needs to be efficiently instrumented either statically in the source code or dynamically at runtime, enabling ex-perts to diagnose a large set of problems touching on several fields such as performance debugging and security.
Currently, many efforts are targetting data aggregation from the kernel and user-space at the lowest possible cost. This field is known as kernel and user-space tracing. Systems exhibiting an undesirable behavior are put under monitoring to generate a trace of rel-evant information, containing the sequence of events that happened on the system just before the time when the problem occurred.
Eventhough it is a relatively new field, open source kernel tracing has rapidly gained a wide popularity among kernel and driver developers. It became an essential tool to exactly understand what the system is doing at any given time and at a high level of granularity. However, analyzing the trace would require system experts to manually identify any suspicious sequence of events that is causing the undesired behavior, and this process is generally very time consuming. Instead, it would be beneficial to encode a list of problematic patterns and look for them efficiently in a trace maximizing therefore the chances of finding problems in a trace.
it could be activated and disactivated intermittently on specific user-defined conditions. It could also be constantly activated but without writing the data to disk; there, the events are kept in cyclic memory buffers where the oldest data is overwritten by the newest. When the problematic condition occurs, the buffers are dumped to disk for analysis. This approach is analogous to the data flight-recorder found in airplanes and is very useful for accident investigation whenever the problem is hard to reproducible.
When tracing is completed, the next step requires experts to look at the data using basic tools and infer the main cause of the problem. Depending on the nature of the prob-lem, this step may be very time-consuming and inefficient; and in some cases almost impossible.
Our work aims at automating the trace examination process whenever useful, enabling a precise, more efficient and faster data analysis. Problems we try to diagnose relate to different fields and we aim at looking for all problem types simultaneously in one or several large per-cpu traces.
Objectives Trace files of several gigabytes are generated at run-time. We would like to inspect the presence of anomalies in traces automatically. The lack of adequate tools for this purpose motivated us to develop a pattern detection trace analyzer which leaves us in front of three challenges:
1. Provide a simple, flexible and unambiguous way to represent patterns of problem-atic behavior.
2. Collect relevant events efficiently from production systems with a minimal perfor-mance impact.
3. Scan traces in one pass to validate them simultaneously against numerous patterns efficiently.
The project should enable us to encode undesirable properties into patterns which can later be used to automatically validate traces generated from production systems. Once a pattern is found, enough information should be supplied so that measures could be taken to eliminate the occurring problem.
Scientific Methodology The steps we took to reach this goal are summarized as fol-lows:
1. Typical patterns: the work started by collecting a set of problematic patterns that would be typically looked for in a kernel trace, by performance and security engi-neers. This step is essential since we would like to provide a generic framework, supporting new pattern descriptions touching on different fields. This has greatly helped us understand the problem requirements and therefore determine the appro-priate mechanism to express and validate multiple hybrid patterns. These patterns are described in Chapter 4.
2. Analogy with other systems: Eventhough pattern matching is new in the ker-nel field, it is not the case in the intrusion detection nor in the parallel computing fields. Many scenario-based intrusion detection systems provide a mechanism to describe security threats or rules, which are then used for validation when analyz-ing network traffic, whether live or offline. The logged network packets waitanalyz-ing to be processed could consume several gigabytes in storage, and therefore provide the same challenges as in large kernel trace. When a rule triggers a security vio-lation, the security engineers are alerted, and measures are taken to deal with the problem. Similarly, in the parallel computing field, there is a wide interest in auto-matic performance debugging. Parallel programs may exhibit inefficient behavior especially when the message passing between different processes running on dif-ferent CPUs don’t occur in the right order. It was important to study the difdif-ferent
systems because of the tight similarity of their objective with ours. We didn’t find a unique and common pattern description language used among the different sys-tems we studied. However, we came up with a criteria list for a pattern description language based on the typical patterns we collected in the previous step. The main features as well as limitations of the different studied languages are summarized in Chapter 1. We divided the studied languages into 3 seperate categories: the Do-main Specific Languages which are further divided into imperative and declarative DSLs, the General Purpose Languages and the Automata-Based Languages. 3. Automata-Based Approach: Based on the study we lead on the different
pat-tern description languages which was summarized in Chapter 1, as well as the criteria list described in the previous step (details in Chapter 1), an automata-based approach for pattern description seemed the most convenient. We studied and compared some of the most important automata-based lanugages including STATL (Eckmann et al., 2002), RAGEL (RAGEL, 2009) and SMC (Compiler, 2009). We show how the automata-based approach is applicable by actually using it to implement the collected patterns.
4. Implementation: The implementation is divided into two parts. The patterns im-plementation using the automata-based approach and the analyzer’s implementa-tion. The different patterns described in Chapter 4 are implemented as well as the analyzer which checks for their existence in large traces. Since the analyzer needs to be very efficient, and capable of processing multiple traces while validating a set of patterns simultaneously, we studied a set of popular trace analyzers in Chap-ter 2. Our main inChap-terest was basically to study their overall system artchitecture as well as the optimization approaches, if any, they adopt.
5. Testing: Once the implementation phase is done, we proceed by testing the per-formance of the analyzer. The main goal is to study the scalability of the appoach and whether it may be possible to define a large pool of patterns for automatic
validation in reasonable amounts of time.
Thesis Organization The thesis is organized as follows. In Chapter 1, the different pattern description languages used in the Intrusion Detection and Parallel Computing fields, are studied. Furthermore, their main features and limitations are summarized after dividing them into 3 seperate categories. We also argument on the reasons behind adopting an automata-based language instead of an imperative or declarative DSL. Then, in Chapter 2, we study some of the popular trace analysis tools, where our main interest is to identify their optimization techniques as well as their overall system architecture. The core of our work is thouroughly described in Chapter 3. It is a journal article sub-mitted to the Journal of Computer Systems, Networks, and Communications in which a quick litterature review is provided, followed by the explanation and implementation of our approach. Four patterns are implemented using a state machine language and fed to the analyzer for a successive testing phase. Results are presented, highlighting the performance of the analyzer as well as a potential problem it was able to detect. In Chapter 4 we provide some complemantary results that were not included in the Chapter 3 article. In Chapter 5 we provide a general discussion of our work touching on both the scalability and performance of the analyzer. The last Chapter concludes our work.
CHAPTER 1
PATTERN DESCRIPTION LANGUAGES
Analyzing kernel traces for pattern matching requires a non-ambiguous, easy to use pattern description language. It should be possible to express using this language a wide variety of patterns touching on several fields of interest such as security, performance debugging and software testing. We first define the language selection criteria based on the nature of patterns we would be typically looking for in a kernel trace. Then we study a wide variety of languages used in various fields for detecting problematic behavior in traces.
In intrusion detection, languages are used to describe security rules and attack scenarios for validation in audit trails (some of those languages are also used for lexical and syn-tactic analysis). Furthermore, in parallel computing, other languages are used to express performance-based properties to be be validated in MPI and OpenMP traces. Similarly, kernel tracers such as DTrace and SystemTap provide languages dedicated to perform run-time trace analysis.
1.1 Language Criteria
We first started by collecting a large set of typical patterns of problematic behavior to look for in a kernel trace. We summarize our findings in chapter 3 and based on them we come up with a criteria list that covers the most important aspects we are looking for in a pattern description language. They are:
to describe the variety of patterns.
2. Expressiveness: It should be possible to describe using the language all sorts of known problematic patterns as well as new ones which may be defined in the future.
3. Tracer-independent: The language shouldn’t depend on the internal format of the kernel trace. Whether the kernel events are collected using one tracer or another, the pattern description should not vary at all.
4. Unambiguous: The language should have a rigorously defined syntax and seman-tics allowing only one clear interpretation of a described pattern.
5. Multi-event-based patterns support: Some languages, such as the one used to write Snort rules, provide operators that are useful to process only one event, whereas in many cases, the patterns are composed of multiple events. It should be possible to describe such patterns including the ordering between the events.
6. On-line/Off-line distinction: the language should not make any apriori assump-tions of whether the analysis is performed on-line or off-line.
1.2 Taxonomy of pattern description languages
We divide the languages to be studied into three seperate categories: Domain Specific Languages, General Purpose Languages and Automata-Based Languages. Domain Spe-cific Languages are further divided into Declarative Domain SpeSpe-cific Languages and Imperative Domain Specific Languages. The languages studied in this chapter can be good candidates for event-based programming and we study how applicable they could be for us to describe problematic patterns that can be found in a kernel trace.
1.2.1 Domain Specific Languages
Domain specific languages DSLs, previously known as special purpose programming languages, are usually dedicated to solve a particular problem or implement a well-defined domain specific task as opposed to general-purpose programming languages such as C or Java. Examples of domain specific languages include VHDL, a hardware description language, Csound, a language for creating audio files, and DOT, an input language for GraphViz, a graph visualization software. We divide DSLs further into two more categories: Declarative DSLs and Imperative DSLs.
DSL Advantages The need for a new DSL is often justified whenever the introduced language helps formulating a particular problem or solution more clearly and more eas-ily than by using preexisting languages. For instance, it should support the level of abstraction of the specific domain, hiding all the low-level complexity and implementa-tion, so that the field experts can easily understand, maintain, update and develop new DSL-based programs.
1.2.1.1 Declarative DSLs
Declarative programming, in contrast with imperative programming, consists in describ-ing what is to be done rather than how to do it. In other words, the logic of a computation is described rather than the control flow of the program. A popular intrusion detection system called Snort employs a declarative DSL to describe a large number of security related rules which are validated by inspecting the network packets. The language will be studied in this chapter.
Declarative DSLs for IDS DSLs are widely used in the intrusion detection field. Snort and Panoptis are both good examples of intrusion detection systems that use domain specific languages for threats detection. The introduced DSLs provide a number of ad-vantages. First, they provide a domain-specific high-level of abstraction facilitating their use by domain experts. Second, the code is generally self-documenting, reducing the required time to generate the script documentation as well as the time needed to under-stand the code. Third, by being declarative, they remove the burden of specifying the full solution implementation including the control flow of the program. However they incur an additional cost for the design, implementation and maintenance of the language. Furthermore, the DSL-based programs can be hard to debug.
Snort Snort (SNORT, 2009) is a free, open source, extensible, intrusion prevention and detection system that can be used as a packet sniffer, a packet logger or a network-based intrusion detection system (NIDS). It can operate by validating a database of security rules against the network packets. Rules are used to capture malicious packets before they can cause any damage to the system.
Snort Rules Snort employs a declarative DSL for rules descriptions. Packet networks are inspected by Snort IDS based on the specified rules. As an example, a rule could state that any packet directed to port 80 and containing the string “cmd.exe” is consid-ered malicious and therefore measures could be taken to deal with it. Snort rules are a set of declarative instructions designed to express a pattern to look for in the network packets. Many parts of the packet could be inspected such as the source and destina-tion IP addresses, the source and destinadestina-tion port numbers, the protocol opdestina-tions and the packet payload. Rules are composed of two parts: the rule header and the rule options. The header contains the rule’s action, protocol, source and destination IP addresses and netmasks and the source and destination ports numbers. The rule options are used for
many operations such as content matching, TCP flags testing or payload size checking, etc. Below is an example illustrating a simple Snort rule:
alert tcp any any -> 192.168.1.0/24 111 (content:“|000186a5|”; msg:”mountd access”;)
Rule Headers The text outside of the parentheses forms the rule header. The differ-ent fields that form a rule header are: Rule actions, protocols, IP addresses, and port numbers. In the first part of the header, we can specify one of the three possible actions:
• Log action: logs the packet that caused the rule to fire.
• Alert action: logs the packet that caused the rule to fire and generates an alert using the selected alert method.
• Pass action: drops the packet.
The next field in the rule header is the protocol. The three protocols that Snort supports are TCP, UDP and ICMP. Then, the source and destination IP addresses are specified in the header. The keyword “any” is used to define any IP address. The Direction oper-ator “->” is used to differentiate between the source and the destination of the packet. Furthermore, the netmask could be specified to designate a block of addresses for the destination. In the last part of the header, port numbers are specified. One or a range of port numbers can be specified either directly or by negation.
Rule Options Snort provides 15 different rule options that are used for operations such as pattern matching or testing the IP and TCP fields. For instance, one can test the TCP flags or the TTL for certain values. All rule options deal with one packet at a time. So basically, writing a Snort rule would consist in defining a set of constraints on the fields of every occurring packet. Snort validates the packets one at a time, and doesn’t allow
one rule to be fired based on constraints touching on two seperate packets. This is mainly due to the fact that Snort was designed to process packets online while incurring a low impact on the system’s performance. By expressing more complex rules, the run-time packet inspection would significantly impact the system’s performance.
Snort for pattern description The language used for Snort rules is a good example of a declarative DSL. The rule writer doesn’t have to worry about the implementation details, such as accessing the fields pointers in the packet headers in order to perform the tests, or opening a file to log the packet. Providing a DSL for kernel trace analysis such as Snort language, would enable programmers to develop patterns at a high level of abstraction. However, the major limitation we found in Snort rules is that they don’t allow us to express relationships between different events. In fact, many problematic patterns could only exist upon the occurrence of two or more events. For instance, detecting a potential deadlock by analyzing a kernel trace cannot be achived using a one-level, Snort-like rule, and therefore we consider other alternatives.
1.2.2 Imperative DSLs
According to the definition found in Wikipedia, imperative programming is a program-ming paradigm that describes computations in terms of statements that change a pro-gram state. In fact, imperative languages, in contrast with declarative languages, provide a mean to specify “how” something should be done rather than simply “what” should be done. Procedural programming for instance, is considered imperative by its nature, and is possible when the imperative language supports structuring statements into pro-cedures. Furthermore, object-oriented programming such as in C++ and Java is also considered as being an imperative programming at their core but not Domain Specific. They are general purpose programming languages. Imperative Domain Specific
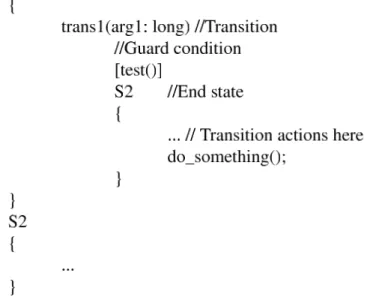
Lan-Figure 1.1 Russel Rule: Activates another rule upon detection of a failed login guage are found in Intrusion Detection Systems such as ASAX. ASAX is an IDS that uses RUSSEL, a rule-based imperative DSL designed specifically for audit-trail analy-sis. In addition to RUSSEL, we study in this category SystemTap and Dtrace scripting languages which are also considered as imperartive DSLs.
1.2.2.1 RUSSEL
The RUle-baSed Sequence Evaluation Language RUSSEL (Habra et al., ), is an impera-tive, rule-based DSL that is used for audit-trail analysis as a part of the ASAX Intrusion Detection project. It is specifically designed to allow queries to be processed in one pass over the trace. Unlike the limitation found in Snort rules, RUSSEL provides a mecha-nism for one rule to trigger another. This can greatly enhance the flexibility of describing more complex rules based on simpler ones.
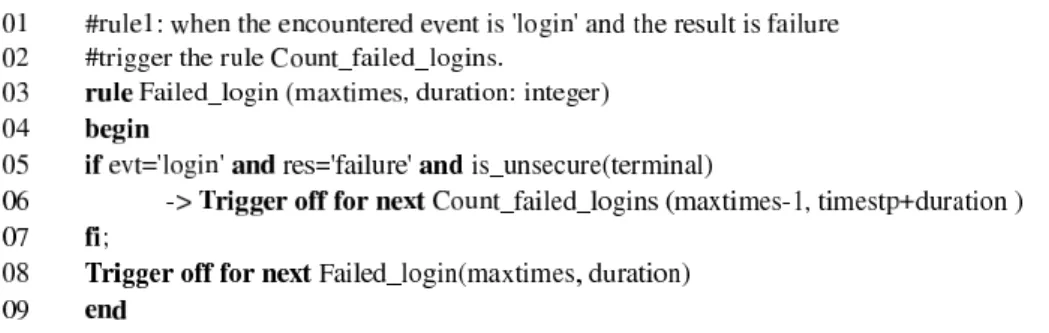
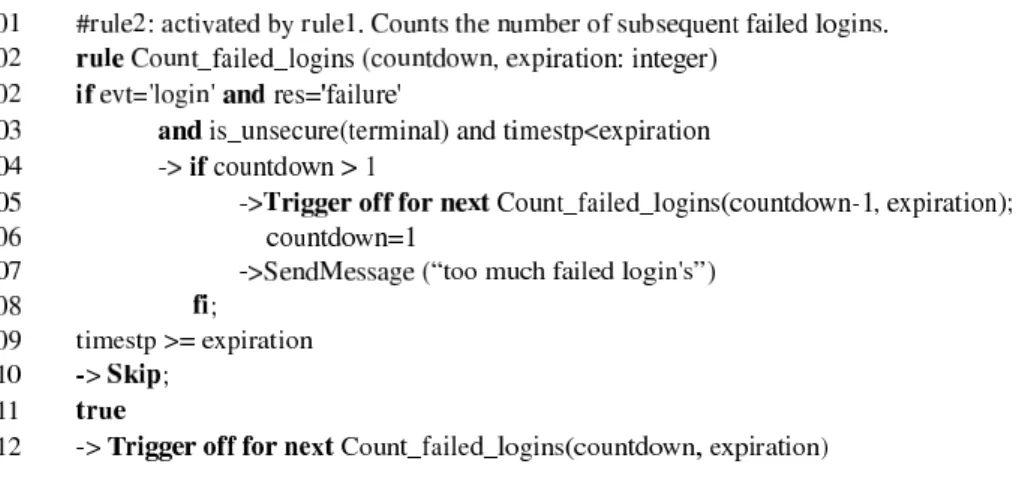
In the example shown in Figures 1.1 and 1.2, two rules are described. The first one tries to detect a failed login in the trace. Whenever it does, it activates another rule which counts the number of subsequent failed logins. When the maximum number of failed logins is reached (i.e. countdown reaches zero), the rule sends an alert message.
When the condition at line 5 is true, the rule Failed login triggers off the Count failed logins rule. Then at line 8 the rule triggers itself unconditionally, keeping itself active during
Figure 1.2 RUSSEL Rule: Counts the number of failed logins
the whole analysis time. This is not the case for Count failed logins rule shown in Figure 1.2 where the self-triggering is skipped whenever the condition timestp >= expiration is true.
RUSSEL for Pattern Description RUSSEL is a good example of a DSL that is flex-ible enough and doesn’t have the limitation found in Snort rules. The idea is that one rule can trigger another and therefore any pattern composed of a succession of events may be expressed by dedicating one rule per event. While the rule triggering mechanism is interesting, complex patterns composed of multiple threads of events, which can also be interconnected, can quickly become very hard to express in the language. Consider for instance a pattern described using the following set of rules r1, r2, r3. Suppose that r1 triggers r2 upon the occurrence of a particular event in the trace satisfying a certain condition. Similarly, r2 triggers r3. Now, if the same pattern can occur simultaneously for different user-space processes, then it may not be possible to detect the two occur-rences since even if every active rule has its local variables, it is not possible to have two active rules of the same type each having its own local variables. Furthermore, the rule triggering mechanism can be easily ported into a general purpose language by imple-menting it in a dynamic library for example. This would remove the maintenance cost
of the language and the resulting code may possibly run faster, and be easier to debug.
1.2.2.2 DTrace D Language
DTrace (Cantrill et al., 2004) is a dynamic and static instrumation framework for both kernel and user-space tracing. It runs under Solaris 10, Mac OS X 10.5 and FreeBSD. Recent work aims at porting DTrace for Linux. Dynamic instrumentation consists in adding instrumentation sites dynamically (i.e. at runtime) in contrast with static instru-mentation where the source code is modified for the same purpose. DTrace employs a C-like language called D, that is used to specify probe points (instrumentation sites) in the kernel and to implement their associated handlers. These handlers could be used to perform run-time trace analysis such as pattern matching. The D language supports all of the ANSI C operators and data types as well as the struct, union and enum types.
D variables
Thread-local variables D supports the declaration of thread-local variables, where every thread gets its own copy of the variable. The per-thread variable can later be used in any probe handler.
A small example illustrating the declaration and use of a thread-local variable via the prefix self-> is shown in Figure 1.3. The example was taken from (DTrace., 2009). At line 1, a probe handler is defined which is to be called at every entry of a read system call. A probe description has the following form: “provider:module:function:name”. Inside the handler, the event time stamp is saved in a thread-local variable accessed using the special operator self->. Every user-space thread issuing a read system-call will get its own copy of the t variable. At line 5, another handler is defined which is to
Figure 1.3 DTrace: Compute the time spent per thread in the read system call
Figure 1.4 DTrace: Output obtained upon running Example 1.3
be called just before returning from every read system call. Inside the handler, the time spent serving the system call is computed and the variable t is reinitialized to 0.
An example of the output is shown in Figure 1.4.
D Clause-Local Variables The D language also supports the declaration of clause-local variables which are only active during the execution of the probe handler. Their values remain persistent across handlers enabling the same probe.
Figure 1.5 DTrace: using the count aggregating function
External Variables Since the D probe handlers are executed at run-time, it is possi-ble to access types and symbols from the kernel or the kernel modules. For instance, the Solaris kernel has a global variable called kmem flags. It can be accessed in a D program by using the backquote character (‘) as a prefix before the variable name (i.e. ‘kmem flags).
Aggregating functions The DTrace aggregating functions provide a mechanism for performing a set of predefined computations in a probe handler and are mainly used for data aggregation. As an example, the script shown in Figure 1.5 counts the number of times the write system call has been entered by storing the results per executable.
D For Pattern Description The D programming language is considered an imperative C-like language and provides at the same time new mechanisms dedicated for kernel trace analysis such as probe site definition, support for thread-local variables and a set of aggregating functions. This is why we placed the D language in the category of the imperative DSLs. There are many features of the language that are not covered here. We only cover those features that could be useful for our offline pattern recognition trace analysis.
The D language’s new features are very well adapted for online analysis. They include probes activation, accessing kernel variables and aggregating only the relevant data at run-time to minimize the amount of information to store. However we see two major limitations in terms of applicability to our problem. First, many features of the D
lan-guage are only applicable for online analysis such as activating probe points in the kernel or accessing the live kernel data. Second, the D language does not provide an easy way to describe complex patterns of problematic behavior. For example, the programmer would still have to manually encode the pattern in question across the different probe handlers, using an imperative C-like language.
1.2.2.3 SystemTap
SystemTap is a dynamic tracer for Linux that uses the kprobes infrastructure to dynam-ically instrument the kernel. It is an open source project with contributors from IBM, Red Hat, Intel, Hitachi, Oracle and others. Unlike the D script files which are interpreted, SystemTap scripts are translated into C code, compiled as kernel modules and inserted into the Linux kernel. As in DTrace, SystemTap scripts are used to activate probe points in the kernel and to implement their associated handlers. Furthermore, Systemtap scripts can have global variables, conditional statements, while and for loops. However the Sys-temTap language lacks types and declarations but adds associative arrays and simplified string processing.
Extraction functions As in Dtrace’s aggregating functions, SystemTap has the extrac-tion funcextrac-tions. The aggregaextrac-tion operator (<<<) is used to keep track of the values of interest. An example using the aggregation operator is shown in Figure 1.6.
At line 2, the probe point is defined. Probe definition has the following syntax: probe P ROBEP OIN T [, P OBEP OINT ] [ST MT...]
The global variable reads declared at line 1, can be seen as an array storing all the values and their number of occurrence, that are assigned to the array using the aggregation
op-Figure 1.6 SystemTap: using the aggregation operator
erator (<<<) as shown at line 3. Then, at the end of the analysis, the extractor functions could be used to perform some operations over the aggregated data. For example, the avg() extractor function shown at line 6 is used to compute the average of all values ac-cumulated into reads. Similarly, other functions can compute the minimum, maximum, sum or count the number of accumulated values. Other statistical functions could be called to show the distribution of values in text based histograms at the output.
SystemTap has many other features. For instance, it performs safety and security check-ing in order not to allow the runncheck-ing kernel module in which the probe handlers are running from performing unsafe operations which may lead to a kernel crash or data corruption. We are mainly interested in the features that could be applicable in our work.
Systemtap for Pattern Description SystemTap scripts can enable the programmer to perform many computations at runtime similarly to DTrace. Both offer specialized functions to visualize the distribution and statistics of relevant data. We considered the Systemtap language as being procedural and imperative due to the similarities it has with the C language. It is also a DSL because it allows the programmer to define probe points in the kernel and to perform specialized functions for data aggregation or for accessing the kernel data structures. The main features for both Systemtap and DTrace are well oriented towards online analysis putting less the emphasis on pattern description. They
don’t provide a simple mechanism to describe a pattern composed of several events where multiple instances of the same pattern type could be alive simultaneously at certain periods during the analysis. The task of manually encoding such patterns across the different probe handlers could be a rather challenging task.
1.2.3 General Purpose Programming Languages
General purpose programming languages (such as C, C++ and Java) in contrast with Domain Specific Languages, are used to solve a wide variety of problems not necessarily related to a particular field. General purpose programming languages could be further divider into several other categories but they are out of the scope of our work. General purpose programming languages, particularly object-oriented languages could very well be used for patterns description. They actually provide a number of advantages over Domain Specific Languages. First, the code is easily debugged using sophisticated and dedicated debuggers. Second, since the programmer has the full control over the control flow of the program, he may be able to better optimize his code for his well-defined problem and therefore, achieve a faster program execution. However, using general purpose programming languages for patterns description may result in a larger number of lines of code, possibly making the program less trivial to undestand. Furthermore, field experts will have to learn the programming language in order to maintain or update the patterns in question.
Under this category, we identify the EXPERT analyzer tool discussed in 2.1. In our work, we will be using a general purpose programming language for patterns description in order to evaluate the performance of the dedicated approach and therefore be able to compare it with our approach.
1.2.4 Automata-Based Programming Languages
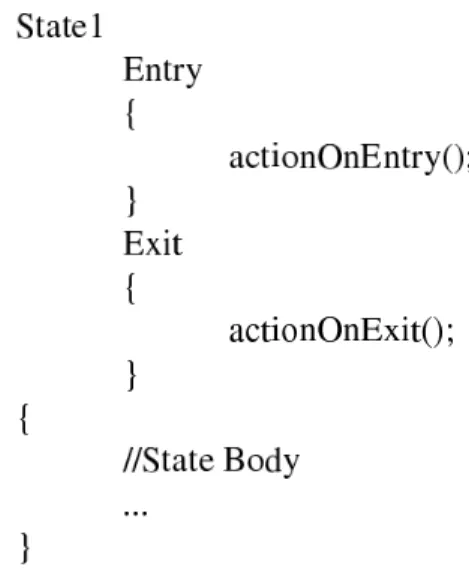
Automata-based programming, particularly finite state machine programming, consists in describing the problem to solve in the form of a state machine composed of a finite number of states, transitions and actions. The program evolves by transitioning from one state to another depending on both, the current state and the input. This may enable one or several actions to take place. Actions could take place when a transition is triggered or when a state is entered or left.
A problem described in the form of a state machine can be represented by a state dia-gram which is visually friendly. Furthermore, it is often easy to update such prodia-grams where the modification usually involves adding or removing states and/or transitions. Automata-based programming is used in many fields such as lexical and syntactic anal-yses, modeling real-time applications for formal verifications, and intrusion detection. In this chapter, we study Ragel, a state machine language and compiler, STAT an in-trusion detection system based on FSM description of security patterns and the State Machine Compiler SMC which is used in many fields and can compile the state machine SM language into 14 different general purpose programming languages.
1.2.4.1 Ragel
Ragel (RAGEL, 2009) is a language for specifying state machines that can recognize regular string expressions. It has a compiler that converts the state machine definitions into six different target languages which are: C, C++, Objective-c, D, Java and Ruby. The generated code tries to match patterns to the input favouring longer patterns over shorter ones. Ragel can also generate the state machines in Graphviz’s Dot file format for visualization. Ragel can optionally employ a state minimization algorithm which reduces the number of states in a FSM by merging equivalent states. The algorithm runs
Figure 1.7 Example illustrating the Ragel syntax
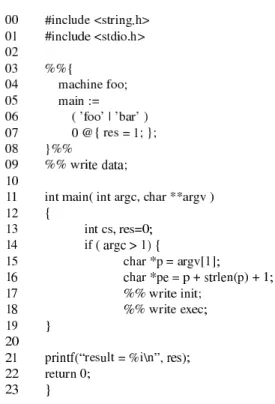
at O(n log(n)) where n is the number of states and requires O(n) memory storage. A simple example that highlights the Ragel syntax is shown in Figure 1.7
The Ragel code is placed between double percent signs and braces, i.e. %%{ Ragel code here... }%%. A single Ragel statement should be preceeded by double percent signes. The machine shown in the example recognizes the two strings ’foo’ and ’bar’ and whenever one of them is detected, the variable res is set to 1. The variable res can be later be accessed by the program written in one of the target languages supported by Ragel. The main program passes to the FSM a pointer to the beginning of the data to be processed and one pointing to the end of the buffer.
Language Operators Only the language operators which are relevant for our work will be covered in this section. The language includes manipulation operators that allow
the programmer to specify the actions of the state machine (i.e. transition actions and state actions) and to assign priorities to transitions. By assigning priorities to transitions, the nondeterminism problem is eliminated. For instance, if two transitions are possible for a given character, then the one with the higher priority will take precedence.
Finie State Machine’s Actions Actions are block of code that could be fired by an FSM. The actions can be triggered by four different transition types identified by four different action embedding operators:
1. Entering transition operator: > 2. Finishing transition operator: @ 3. All transition operator: $
4. Leaving transition operator: %
The “entering transition” operator is used to specify the actions to be triggered by any transition leaving the starting state. For instance, when the first character of a sequence is encountered, a transition originating from the starting state is fired. Therefore, the entering transitions, if any are specified, are executed.
The “finishing transition” operator is used to specify the actions to be triggered by any transition leading into a final state. For instance, when the full character sequence is matched, the state machine transitions to its final state. At this point, the finishing transition action is executed. Finishing transition actions can be executed more than once if the state machine has any internal transitions out of a final state.
The “all transition” operator is used to specify the actions to be triggered by any taken transition in the finite state machine. For instance, for every character in the sequence being matched, the “all transition” action is executed.
The “leaving transition” operator is used to specify the actions to be triggered when the state machine leaves its final state.
Ragel has other types of operators that help create new machines from previous ones. These operators include: the Union operator which produces a machine that matches any string in machine 1 or machine 2; the Intersection operator which produces a machine that matches only the strings that are both in machine 1 and machine 2; the Difference operator which produces a machine that matches the strings in machine 1 but are not in machine 2.
Ragel for Pattern Description While Ragel provides many features such as FSM op-timization and visualization, it does not allow us to specify different actions on different transitions. In fact, the four types of transition actions it supports are mentioned pre-viously in this section and none of them allows us to explicitly assign different actions for different transitions. This is a major limitation for us since we may need to assign different actions triggered by the occurrence of different kernel events in the trace. Not only that, we sometimes need to assign two or more different actions triggered by the occurrence of the same kernel event where the action to be executed will depend on the current state of the FSM.
1.2.4.2 STATL
The State Transition Analysis Technique (STAT) (Eckmann et al., 2002) is a scenario-based, intrusion detection system (IDS). STATL is the language it uses to describe the attack scenarios which will be used by the STAT core to detect possible ongoing intru-sions in a stream of events. We study in this section the STAT language and show how applicable their approach could be for kernel trace analysis.
States and Transitions The language provides constructs to define the states and tran-sitions of a given attack scenario. Since any security breach is usually composed of one or more steps, STAT maps every step of a given attack into a state in a finite state ma-chine (FSM) representing the full attack scenario. Transitions between states represent the evolution of the attack. A critical state could therefore be reached if the attack was successful, or at least imminent. At this point, the notification action already specified by the pattern writer will be triggered so that system administrators take the necessary measures to solve the problem.
Scenario Definition A STATL scenario is an attack definition encoded into a finite state machine description. A scenario is identified by its name and can have parameters when being loaded. Scenario parameters are very useful when the user wants to set cer-tain variables when loading the scenario, avoiding therefore the recompilation process. Since more than once instance of the same scenario could coexist, the parameters are accessible by the different instances as global constants.
Variable Declaration Inside the body of a scenario declaration, the language supports the declaration of local, global variables and constants. Global variables are shared by all the instances of the same scenario. As for local variable, each instance has its own copy of it.
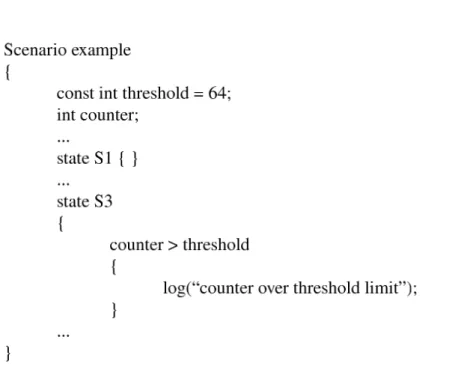
State Declaration Only one state has to be set as the initial state. When a new scenario is loaded, it is created in its initial state. States can have optional assertions which are tested prior to state entry. Only when the assertion - if present - is evaluated to true, the state would be entered. Assertions can access the event fields, the local and global variables. They cannot however affect their values. The affectation is performed only inside the code blocks. Figure 1.8 illustrates the declaration of an initial state S1, and
Figure 1.8 Example of State Declaration in STATL
another state S3 for which a state assertion is declared (counter > threashold). For the same state S3, a code block is defined in which the action to take when the assertion is evaluated to true, is specified. The code block is delimited by braces in which statements are executed in order and can include regular assignments, for and while loops, if-then-else conditions as well as procedure calls.
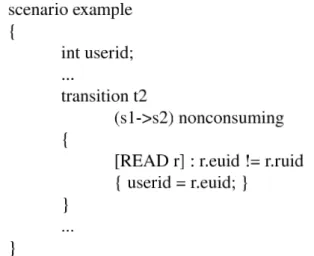
Transition Declaration Transistions are identified by their name and the pair of states they connect together. The source and destination states could be the same and in this case, the transition is called a loop transtition. Transistions are triggered when a partic-ular event occurs in the trace. This event on which the transition is sensitive, needs to be specified in the definition of the transition. In the example shown in Figure 1.9, the transition t2 joins state S1 with state S2, and is sensitive on the event READ. As in the case of states definition, transitions can have assertions as well as code blocks (actions). The assertion above states that the euid and ruind fields of the event must differ. In that case, the transition is fired and the state s2 is reached. The userid variable gets updated
Figure 1.9 Example of Transition Declaration in STATL as a result.
Evaluation Order Since transitions and states have assertions as well as code blocks (actions to take) an execution order is needed and is as follows:
1. Evaluate the tranition assertion. If True, then 2. Evaluate the state assertion. If True, then
3. Execute transition code block, possibly modifying local and global environments; 4. Execute state code block, possibly modifying local and global environments;
Timers STATL supports the definition of timers which are initialized inside the code block of a transition or a state. As in the case of regular variables, timers could be either local or global. The timer is started at the current event time stamp. A timeout t is specified and will be fired t seconds after the event time stamp. A transition needs to be defined to be triggered upon the timer expiration. The timer will be reset if restarted in another state code block.