Financial Literacy and Retirement Planning in Canada
31
0
0
Texte intégral
(2) CIRANO Le CIRANO est un organisme sans but lucratif constitué en vertu de la Loi des compagnies du Québec. Le financement de son infrastructure et de ses activités de recherche provient des cotisations de ses organisations-membres, d’une subvention d’infrastructure du Ministère de l'Enseignement supérieur, de la Recherche, de la Science et de la Technologie, de même que des subventions et mandats obtenus par ses équipes de recherche. CIRANO is a private non-profit organization incorporated under the Québec Companies Act. Its infrastructure and research activities are funded through fees paid by member organizations, an infrastructure grant from the Ministère de l'Enseignement supérieur, de la Recherche, de la Science et de la Technologie, and grants and research mandates obtained by its research teams. Les partenaires du CIRANO Partenaire majeur Ministère de l'Enseignement supérieur, de la Recherche, de la Science et de la Technologie Partenaires corporatifs Autorité des marchés financiers Banque de développement du Canada Banque du Canada Banque Laurentienne du Canada Banque Nationale du Canada Bell Canada BMO Groupe financier Caisse de dépôt et placement du Québec Fédération des caisses Desjardins du Québec Financière Sun Life, Québec Gaz Métro Hydro-Québec Industrie Canada Intact Investissements PSP Ministère des Finances et de l’Économie Power Corporation du Canada Rio Tinto Alcan Ville de Montréal Partenaires universitaires École Polytechnique de Montréal École de technologie supérieure (ÉTS) HEC Montréal Institut national de la recherche scientifique (INRS) McGill University Université Concordia Université de Montréal Université de Sherbrooke Université du Québec Université du Québec à Montréal Université Laval Le CIRANO collabore avec de nombreux centres et chaires de recherche universitaires dont on peut consulter la liste sur son site web. Les cahiers de la série scientifique (CS) visent à rendre accessibles des résultats de recherche effectuée au CIRANO afin de susciter échanges et commentaires. Ces cahiers sont écrits dans le style des publications scientifiques. Les idées et les opinions émises sont sous l’unique responsabilité des auteurs et ne représentent pas nécessairement les positions du CIRANO ou de ses partenaires. This paper presents research carried out at CIRANO and aims at encouraging discussion and comment. The observations and viewpoints expressed are the sole responsibility of the authors. They do not necessarily represent positions of CIRANO or its partners.. ISSN 2292-0838 (en ligne). Partenaire financier.
(3) Financial Literacy and Retirement Planning in Canada. *. David Boisclair†, Annamaria Lusardi‡, Pierre-Carl Michaud§. Résumé/abstract Financial literacy and Canadians’ capacity to plan for retirement is of primary importance for the policy debate over pension system reform in Canada. In this paper, we draw on internationally comparable survey evidence on financial literacy and retirement planning in Canada to investigate how financially literate Canadians are and who does plan for retirement. We find that 42 percent of respondents are able to correctly answer three simple questions measuring knowledge of interest compounding, inflation, and risk diversification. This is consistent with evidence from other countries, and Canadians perform relatively well in comparison to Americans but worse than individuals in other countries, such as Germany. Among Canadian respondents, the young and the old, women, minorities, and those with lower educational attainment do worse, a pattern that has been consistently found in other countries as well. Retirement planning is strongly associated with financial literacy; those who responded correctly to all three financial literacy questions are 10 percentage points more likely to have retirement savings. Mots clés/keywords : Financial literacy, retirement planning, international comparisons.. *. We thank the Canadian Securities Administrators and the Quebec Autorité des marchés financiers for granting access to the data, and Innovative Research for providing us with the data files and documentation. Michaud thanks the Fonds de recherche du Québec - Société et culture (NC 145848) for funding this research. We also thank Thomas Lalime for excellent research assistance and Audrey Brown for editorial assistance. Findings and conclusions do not necessarily represent the views of the organizations involved. † Alliance Research Chair on the Economics of Demographic Change, École des sciences de la gestion, Université du Québec à Montréal (UQAM), Montreal, QC, Canada and CIRANO. ‡ The George Washington University School of Business, Washington, DC, USA. § Corresponding author: [email protected], ESG UQAM, Economics Department, P.O. Box 8888 Downtown Station, Montreal, QC, H3C 3P8, Canada. Alliance Research Chair on the Economics of Demographic Change, École des sciences de la gestion, Université du Québec à Montréal (UQAM), Montreal, QC, Canada and CIRANO..
(4) 1. Introduction Research from many countries around the world shows not only that individuals display low levels of financial literacy but also that financial illiteracy can be linked to lack of financial planning and insufficient resources in retirement (Lusardi and Mitchell, 2011a, 2014). Using data recently collected via a questionnaire especially designed to be comparable to surveys administered in a number of other countries (Australia, France, Germany, Italy, Japan, the Netherlands, New Zealand, Romania, Russia, Sweden, Switzerland, and the United States), this paper aims to assess how Canadians fare in terms of financial literacy and retirement planning. The Canadian case is important for many reasons. For decades, Canada has had some of the lowest levels of poverty among seniors (see, e.g., OECD, 2011). Although old-‐age poverty seems to be changing according to recent and forecasted trends (Fréchet, 2012; OECD, 2013; Clavet et al., 2013), public retirement programs provide a high income replacement ratio, typically from 60 percent to 90 percent or more, for workers with earnings below the median.4 For those individuals, retirement planning may be relatively simple.5 On the other hand, retirement planning can be particularly important for Canadians earning above the median income. Income floor programs (the so-‐called 1st pillar) in combination with compulsory public savings plans (the 2nd pillar) do not guarantee a sufficiently high replacement ratio. Indeed, these programs provide retirement income 4 Median earnings were about CA$30,000 in 2011, or CA$48,000 for full-‐year full-‐time workers (Statistics . Canada, 2014). 5 There are, however, exceptions to this statement. Such exceptions relate for instance to households breaking . up prior to retirement, and to the fact that means-‐tested programs for the elderly interact in differing ways with various savings vehicles (e.g., the Guaranteed Income Supplement and the Tax-‐Free Savings Account vs. the Registered Retirement Savings Plan). . . 2 .
(5) capped at approximately CA$19,000 per year in 2014, meaning that replacement ratios decline to well below 50 percent for those earning above the median. Hence, workers in these earnings brackets need to put aside additional savings (the so-‐called 3rd pillar) to ensure that their retirement income adequately replaces earnings, for example through an employer-‐sponsored pension plan or tax-‐sheltered vehicles. In recent years, much of the policy debate has evolved around the question of whether or not middle-‐ and high-‐income Canadians are saving enough for retirement. Other important trends are also taking place, including a shift from defined-‐benefit (DB) to defined-‐contribution (DC) pension plans, though this has been more limited in Canada than elsewhere (Gougeon, 2009),6 and a decline in the coverage of private-‐sector employer-‐sponsored plans, which may have stabilized (Milligan and Schirle, 2014). Proposed reforms have followed two strands. The first strand has focused on expanding the 2nd pillar (the contributory Canada Pension Plan and its sister Quebec Pension Plan; see for instance Wolfson, 2011 and 2013, and Milligan and Schirle, 2014, for an overview), and sometimes the 1st and 3rd pillars (see, respectively, Townson, 2009, and Ambachtsheer, 2008, for examples). One argument often made is that Canadians have low levels of financial literacy and thus expansion of relatively simple mandatory programs may be advantageous. The second strand focuses on voluntary savings plans. One change to the 3rd pillar is currently being gradually implemented at the federal level and in some provinces: Pooled Retirement Pension Plans (PRPPs), which are being legislated under various names in each province. PRPPs are individual accounts with “group investment options,” offered by 6 Whether “group RRSPs” are taken into account may alter this statement, but exhaustive coverage figures for . these DC-‐type plans are difficult to obtain. . . 3 .
(6) private financial institutions. Accounts include additional features such as automatic enrollment and default options, and the inclusion of these options can be linked to the notion that purely voluntary savings programs are unlikely to be effective due, among other factors, to lack of financial knowledge. The Task Force on Financial Literacy recommended in its 2010 report “that employers offer automatic saving programs and tools to facilitate increased lifelong saving by Canadians, drawing on international best practices in this area” (Task Force on Financial Literacy, 2010). The report also emphasized the importance of financial literacy—not merely for retirement planning but for other reasons as well—and recommended “the appointment of a Financial Literacy Leader to coordinate efforts in the implementation of a national strategy for financial literacy in Canada” (FCAC, 2014). Legislation was adopted in 2013 to appoint such a person within the Financial Consumer Agency of Canada (FCAC), thus expanding for the third time since 2007 the mandate of this federal agency, which “was created in 2001 to protect and educate consumers of financial services” (ibid.).7 Existing evidence revealed low levels of financial literacy in Canada (Task Force on Financial Literacy, 2010; MacKay, 2011; Mullock and Turcotte, 2012; Lalime and Michaud, forthcoming). However, this evidence drew mostly from the 2009 Canadian Financial Capability Survey, which did not use questions comparable to those used in other countries. Comparisons can be useful as they highlight similarities and differences across countries. They can also draw attention to important features of the data, for example the groups that consistently display the lowest levels of financial literacy, irrespective of institutional setting, and the effects of financial illiteracy. 7 Jane Rooney was appointed to the position on April 15, 2014. . . 4 .
(7) In section 2, we discuss the survey and data collection method. In section 3, we present the empirical evidence on the level of financial literacy and retirement planning. We then compare results to those obtained from other countries and discuss the implications of our findings for public policy. 2. The Survey In Canada, securities regulation and oversight is done at the provincial level. Consequently, there are 13 provincial and territorial securities administrators, collectively known as the Canadian Securities Administrators (CSA). In 2012, the CSA sponsored a third edition of a survey that had been fielded in 2006 and 2009, mainly aimed at investigating and measuring various aspects of investment knowledge and behavior among Canadians. The survey was conducted over the Internet between May 17 and May 31, 2012, in both French and English, using a national panel run by Innovative Research. Respondents were drawn from nationally representative samples and were offered a chance to win CA$1,000. Data were weighted to ensure the sample was representative of the Canadian population.8 A total of 6,911 Canadians were interviewed. Important for our purpose is that 2012 was the first year in which the survey included the three specific questions designed to measure financial literacy that have been used in more than twelve other countries.9 8 We used the 2008 Survey of Household Spending to construct weights based on age, sex, region of residence, . and education level. Details on the construction of these weights are provided in Appendix A. 9 While the questions are the same or very similar across countries, the mode of interview varies across . surveys fielded in different countries. For example, some countries use telephone-‐based surveys (U.S.), whereas some (Germany) used paper and pencil. Also, some differences exist in terms of the year in which the survey was fielded. However, the financial literacy landscape is unlikely to have changed over a horizon of a few years. 5 .
(8) 3. Empirical Evidence 3.1. How financially literate are Canadians? 3.1.1. Measurement of financial literacy We report below the wording of the three questions—taken from the questionnaire originally designed by Lusardi and Mitchell (2011b)—that were used to measure financial literacy among Canadian respondents. Understanding of Interest Rates “Suppose you had $100 in a savings account and the interest rate was 2% per year. After 5 years, how much do you think you would have in the account if you left the money to grow? More than $102; Exactly $102; Less than $102; Don’t know.” Understanding of Inflation “Imagine that the interest rate on your savings account was 1% per year and inflation was 2% per year. After 1 year, how much would you be able to buy with the money in this account? More than today; Exactly the same; Less than today; Don’t know.” Understanding of Risk and Diversification “Is the following statement true or false? [...]Buying a single company’s stock usually provides a safer return than a stock mutual fund. True; False; Don’t know.” The first question measures numeracy/interest compounding, or the capacity to do a simple calculation related to interest rates. The second question measures understanding of inflation, again in the context of a simple financial decision. The third question is a joint test 6 .
(9) of knowledge about stocks and stock mutual funds and of risk diversification, since knowing the answer to this question requires knowledge of what a stock is and that a mutual fund is composed of many stocks. These questions are relevant for most respondents in Canada, albeit with different degrees of salience for different age groups. For instance, only older individuals (40 or 50 years and older at the time of survey) are likely to have experienced inflation, since the last inflationary episode took place in the early 1980s (during that period, inflation was at 10– 12 percent). Since 1991 the Bank of Canada has followed a monetary policy based on a 2 percent inflation target. Older respondents may also have the most experience with the power of interest compounding, as individuals over 40—and even more so, those over 60— will likely remember the high mortgage rates of the same period. Topics such as compound interest, inflation, and the stock market have been taught in varying ways across Canada over the years, and many middle-‐aged individuals are likely to have had some exposure to these topics in school. In Quebec, for instance, these topics were taught for several decades as part of a mandatory 12th grade economics course; however, this course was dropped from the curriculum in 2009, meaning that individuals under 20 in 2012 will not have been exposed to it. On the other hand, a new optional course beginning in 2015 is being contemplated; British Columbia introduced a mandatory course in 2004; and Ontario specifically introduced financial literacy elements into its curricula in 2011. Moreover, since Canada—Quebec in particular—performs well in mathematics on PISA (Programme for International Student Assessment; see Knighton et al., 2010), one may expect a relatively high level of financial literacy among the adult population (Jappelli, 2010; Jappelli and Padula, 2013). . 7 .
(10) From the early 1990s onwards, incentives for individuals to contribute to retirement savings plans have been enhanced with the expansion of tax-‐deferred vehicles and other initiatives (for example, indexation of the contribution ceiling for the Registered Retirement Savings Plan, or RRSP,10 and creation of the Tax-‐Free Savings Account, or TFSA11). As a result, the value of households’ direct investments in financial markets—as opposed to those held through a collective vehicle, such as a pension plan—has risen significantly as a multiple of earnings over the last 30 years (Horner, 2009). The proportion of households owning direct equity is now among the highest in the world (Grout et al., 2009), so Canadians should be rather familiar with concepts related to risk and portfolio diversification. 3.1.2. Evidence on financial literacy In Table 1, we present the distribution of answers to each of the three financial literacy questions as well as the distribution of answers to all three questions. Over three-‐quarters of survey respondents correctly answered the compound interest question and more than one in ten got this question wrong. About two-‐thirds correctly answered the question about inflation and more than 17 percent of respondents got this question wrong. The question that elicited the lowest number of correct answers was the question about risk diversification: 59 percent of respondents answered this question correctly. Moreover, the pattern of responses changes when looking at risk diversification; more than 30 percent of . 10 The RRSP is similar to an IRA in the U.S. “Group RRSPs” are individual accounts set up by employers, usually . with matching contributions, and are similar to 401(k) plans in the U.S. RRSP contributions are tax deductible, and withdrawals are fully taxable at the beneficiary’s marginal income tax rate. As mentioned above, group RRSPs also have a new—and very similar—“competitor” savings vehicle: Pooled Registered Pension Plans, which Quebec launched in 2014 under the name Voluntary Retirement Savings Plans (VRSPs). 11 The TFSA is similar to a Roth IRA in the U.S. “Group TFSAs” are individual accounts set up by employers, . usually with matching contributions, and are similar to Roth 401(k) plans in the U.S. TFSA contributions are not tax deductible and withdrawals are not taxable; like Roth plans in the U.S., the TFSA is therefore said to be “tax prepaid”. . . 8 .
(11) respondents indicated they did not know the answer to this question, while the proportion of “do not know” answers was much lower for the questions on interest rates and inflation (9 and 16 percent, respectively). Results are very similar whether looking at individuals of working age (age 25 to 64) or at the population as a whole. Considering all questions together, only about 42 percent of respondents correctly answered all three questions and more than 37 percent of respondents answered with at least one “do not know” response. These findings are strikingly similar to those from other countries. For example, studies from the U.S., Germany, and Japan—to mention but a few countries that are geographically diverse but have similar financial markets—report similar findings, with a higher rate of correct responses to the interest rate and inflation questions, but a lower one for the risk diversification question. Moreover, the question about risk diversification is the one that elicits the highest number of “do not know” responses across countries. For example, “do not know” responses are 34 and 32 percent in the U.S. and Germany, respectively, and as high as 56 percent in Japan. In many countries, the number of respondents who can correctly answer all questions is rather low; for example 30 percent in the U.S. and 45 percent in the Netherlands.12 Percentages are somewhat higher in Germany, with 53 percent of respondents able to answer all three questions correctly. . 12 For more detail and discussion about the international comparison across twelve countries, see Lusardi and . Mitchell (2014). . . 9 .
(12) Table 1. Summary statistics on the three financial literacy questions . . Full sample (%) . Age 25-‐64 (%) . . . . . > $ 102 . 77.92 . 79.04 . . = $ 102 . 7.04 . 7.12 . . < $ 102 . 6.20 . 6.10 . . DK . 8.84 . 7.74 . . . . . More . 8.14 . 8.10 . . Exactly the same . 9.55 . 9.91 . . Less . 66.18 . 66.92 . . DK . 16.13 . 15.07 . . . . . Correct (false) . 59.35 . 61.26 . . Incorrect (true) . 9.36 . 8.13 . . DK . 31.29 . 30.62 . . . . . Correct: Interest and Inflation . 58.12 . 58.83 . . All correct . 42.46 . 43.93 . . None correct . 10.27 . 9.46 . . At least 1 DK . 37.23 . 35.60 . . All DK . 5.96 . 5.60 . . Number of observations . 6,805 . 4,950 . . (A) Interest question . (B) Inflation question . (C) Risk question . (D) Cross-‐question consistency . Note: Distribution of responses to the financial literacy questions in full sample and for those age 25–64. All figures are weighted. DK indicates respondent does not know the answer. Italics indicate the correct answer to each question. . 3.2. Who knows the least? Table 2 shows the distribution of responses to the financial literacy questions across demographic groups. To be able to compare with other countries, we considered the distribution of responses across age, sex, educational attainment, and employment status. Although in a single cross-‐section we cannot distinguish between age and cohort effects, . 10 .
(13) there is an inverse U-‐shaped pattern of responses across age, with the young normally having the lowest percentage of correct answers, and the rate of correct answers again showing a (small) decline with age. In all cases, however, individuals younger than 35 performed worse than older individuals. Women performed worse than men on all three questions. Not only is the proportion of correct answers lower for women, but for each question, women were more likely than men to have selected the “don’t know” option, with the proportion particularly high for the risk diversification question, to which more than 40 percent of women replied “do not know.” There is also a strong education gradient, with individuals with greater educational attainment displaying a higher level of financial literacy. The proportion of respondents answering with “do not know” decreases as education level increases. Retired respondents had the highest proportion of correct answers to the inflation question. But on the other questions, the self-‐employed performed best. These two groups performed somewhat better than employed respondents on inflation and overall, but on interest and risk, employed individuals were more knowledgeable than retirees. Individuals who were not working (students, homemakers, and the unemployed) performed worst on all questions. These findings are again very consistent with the evidence from other countries; the young, women, those with low educational attainment, and individuals who are not working are consistently found to display low levels of financial literacy internationally. In particular, there are striking similarities in the gender differences in financial literacy; the pattern that is found in Canada very closely mirrors the evidence from other countries. These patterns are one reason why international comparisons can be quite informative. . 11 .
(14) Table 2. Distribution of responses to financial literacy questions by age, sex, education level, and employment status . Interest . Correct . Inflation . Risk . Overall . DK . Correct . DK . Correct . DK . 3 Correct . >= 1 DK . Age . . . . . . . . . < 35 . 74.12 . 10.01 . 46.58 . 23.78 . 50.61 . 34.31 . 29.73 . 43.58 . 35-‐54 . 79.80 . 7.59 . 66.84 . 14.86 . 61.84 . 29.58 . 45.06 . 34.27 . 55-‐64 . 78.51 . 7.75 . 75.11 . 12.73 . 62.67 . 31.90 . 46.31 . 36.31 . 65+ . 76.82 . 11.89 . 75.77 . 14.79 . 58.99 . 31.44 . 45.66 . 38.56 . Sex . . . . . . . . . Male . 81.69 . 6.97 . 72.15 . 11.02 . 66.76 . 22.71 . 51.36 . 27.71 . Female . 73.85 . 10.86 . 59.72 . 21.65 . 51.34 . 40.56 . 32.85 . 47.52 . . . . . . . . . < High school . 63.21 . 16.21 . 54.28 . 26.48 . 40.24 . 49.32 . 23.50 . 57.45 . High school graduate . 71.29 . 12.36 . 53.50 . 22.25 . 50.84 . 36.71 . 30.33 . 45.20 . Technical & vocational . 79.34 . 7.69 . 65.62 . 15.81 . 58.80 . 31.70 . 40.50 . 37.07 . CEGEP or Some college . 82.40 . 6.26 . 69.70 . 12.91 . 64.57 . 26.35 . 48.00 . 31.50 . College Graduate . 86.79 . 4.36 . 78.66 . 8.37 . 73.68 . 19.83 . 58.70 . 23.89 . Post Graduate . 90.62 . 3.61 . 82.51 . 6.37 . 75.78 . 16.48 . 63.85 . 19.85 . . . . . . . . . Not working . 68.56 . 13.64 . 48.86 . 27.04 . 42.98 . 44.63 . 25.88 . 50.63 . Employed for wage . 80.93 . 6.74 . 65.82 . 13.76 . 63.26 . 27.64 . 44.90 . 33.39 . Self-‐employed . 83.39 . 4.24 . 75.07 . 11.52 . 67.35 . 24.29 . 52.29 . 29.75 . Retired . 77.19 . 10.75 . 76.39 . 14.36 . 61.05 . 30.90 . 46.62 . 37.31 . Education . Employment status . Note: All figures are weighted. DK indicates respondent does not know the answer. “Not working” includes students, homemakers, and the unemployed. . Given the regional differences that have been found in Italy, Russia, and the United States, we looked at financial literacy differences by Canadian province/region.13 We also looked at . . 13 We report statistics by region instead of individual province mostly for convenience. Differences between . provinces within each region (Newfoundland and Labrador, Prince Edward Island, Nova Scotia and New Brunswick in the Atlantic; Manitoba, Saskatchewan and Alberta in the Prairies) were not significant. . . 12 .
(15) differences by self-‐reported visible minority status, and according to the language in which the respondent took the survey. Results are shown in Table 3. There are slight differences in financial literacy across regions: respondents in Quebec and the Atlantic provinces performed poorly on the interest and inflation questions, while respondents on the coasts (British Columbia and Atlantic) did worse on risk diversification. Overall, respondents from Ontario and the Prairies performed best, while those from the Atlantic provinces did the worst. Differences were not very large, however; there was no single question on which the difference between the “most literate” and the “least literate” region exceeded 10 percentage points. The picture is somewhat different when looking at the results according to language (i.e., whether the survey was taken in French or English).14 French respondents in Quebec do worse than English respondents in Quebec. French respondents in the rest of Canada do better than French respondents in Quebec and even than English respondents in Quebec and the rest of Canada, apart from the question on risk diversification. The picture is also different when comparing language minorities (English in Quebec vs. French in other provinces) and majorities (French in Quebec vs. English elsewhere). Among the minorities, English respondents do better on risk and overall, while their results are similar to French respondents on interest and inflation. English respondents from outside Quebec do better than French respondents from Quebec, except on risk. In all cases except on risk, English respondents from Quebec fare best, while French respondents from Quebec fare worst. These are only univariate statistics, not controlling for the other differences that are mentioned earlier in the table. Given the importance of this finding, we also perform a 14 The sub-‐sample of French respondents outside Quebec is very small. . . 13 .
(16) multivariate analysis. Interestingly, regional and language differences apparent in Table 3 all but disappear when controlling for educational attainment in a regression framework.15 Hence, the gap is almost entirely explained by differences in education across regions. Table 3. Distribution of responses to financial literacy questions by region, language, and self-‐reported visible minority status . Interest . Inflation . Risk . Overall . Correct . DK . Correct . DK . Correct . DK . 3 Correct . >= 1 DK . . . . . . . . . Atlantic . 74.55 . 10.79 . 64.29 . 20.48 . 53.75 . 38.56 . 36.93 . 45.37 . Quebec . 74.68 . 9.19 . 62.76 . 16.87 . 60.17 . 30.48 . 39.43 . 37.91 . Ontario . 79.65 . 8.50 . 67.81 . 14.73 . 61.11 . 29.41 . 44.69 . 34.74 . Prairies . 78.83 . 8.83 . 67.66 . 16.06 . 58.86 . 31.43 . 45.06 . 36.73 . British Columbia and Territories . 79.97 . 8.05 . 67.30 . 16.36 . 56.55 . 33.93 . 41.79 . 39.07 . Language (N=6,805) . . . . . . . . . French (Quebec) . 73.86 . 9.53 . 61.45 . 17.60 . 59.72 . 30.82 . 38.08 . 38.61 . French (ROC) . 79.23 . 0.00 . 78.69 . 3.57 . 70.57 . 12.95 . 53.43 . 15.65 . English (Quebec) . 85.06 . 4.73 . 79.53 . 7.47 . 65.89 . 26.23 . 56.76 . 29.01 . English (ROC) . 79.03 . 8.76 . 67.28 . 15.94 . 59.01 . 31.66 . 43.45 . 37.11 . . . . . . . . . Yes . 69.24 . 9.78 . 56.93 . 16.55 . 53.04 . 29.76 . 31.79 . 35.43 . No . 82.09 . 7.15 . 70.56 . 13.58 . 64.32 . 27.86 . 47.99 . 33.40 . Region (N=6,805) . Visible minority (N=6,198) . Note: All figures are weighted. DK indicates respondent does not know the answer. ROC refers to Canada outside Quebec (“rest of Canada”). . . 15 This conclusion was reached by regressing the variable indicating that an individual had correctly answered . all three financial literacy questions on age, sex, region of residence, and an interaction dummy indicating French survey-‐takers from Quebec, and subsequently adding education level (these are OLS regressions). The latter operation wiped out regional and language differences. The subsequent introduction of income and employment status into the regression lowered the educational effect, but did not change the statistical significance of region, language and education’s coefficients. Results are available upon request. . . 14 .
(17) Finally, self-‐declared “visible minority status” seems to be strongly correlated with lower financial literacy. Respondents who identify themselves as belonging to a visible minority fare much worse, on average, than those who do not. The success rate is much lower on all questions (by 11–15 percentage points) as well as overall (16 percentage points). Contrary to the regional/language differences, this result does not go away when controlling for income, employment status and, most importantly, educational attainment. 3.3. Does financial literacy matter? We turn next to examining the link between financial literacy and retirement planning. Planners are defined as those who have any type of voluntary savings. This is a broad measure, but the wording of the survey question makes it appropriate as far as retirement planning is concerned (we label as planners respondents who select answers #1, #2 or #3 to the question below):16 Do you personally have any savings or investments set aside for the future? This could be either in or outside of an RRSP (Registered Retirement Savings Plan), RRIF (Registered Retirement Income Fund) or TFSA (Tax-‐Free Savings Account). Check all that apply. 1. Savings or investments IN an RRSP, RRIF or pension plan 2. Savings or investments IN a TFSA 3. Savings or investments OUTSIDE an RRSP, RRIF, pension plan or TFSA 4. Currently do not have any savings or investments set aside for the future . 16 One might argue that only individuals with savings in tax-‐sheltered vehicles should be labelled "planners”, . but it can be similarly argued that other forms of savings are also linked to planning—for retirement and other purposes. About 200 individuals, out of more than 4,000 in our regression sample, report having savings only outside of tax-‐sheltered vehicles, i.e., answer #3. . . 15 .
(18) As did the studies in other countries, we restrict our sample to non-‐retired respondents age 25 to 64. 17 Table 4 shows the relationship between retirement planning and financial literacy. Results indicate that higher levels of financial literacy are associated with a higher likelihood that the respondent plans for retirement. The fraction who correctly answered all questions is much higher at 53.5 percent among planners versus 29.0 percent among non-‐planners, and the fraction who answered with at least one “don’t know” is much lower among planners at 26.0 percent versus 49.2 percent among non-‐planners. Table 4. Financial literacy of planners and non-‐planners . Non-‐planners . . . . . Correct . 84.63 . 71.29 . . DK . 4.96 . 11.40 . . . . . Correct . 73.60 . 53.88 . . DK . 9.01 . 24.11 . . . . . Correct . 71.08 . 46.53 . . DK . 21.23 . 43.76 . . . . . Correct: Interest and Inflation . 67.11 . 44.52 . . All correct . 53.45 . 29.00 . . None correct . 5.53 . 15.46 . . At least 1 DK . 26.00 . 49.17 . . All DK . 2.86 . 9.20 . . Number of observations . 2,368 . 1,713 . (A) Interest question . (B) Inflation question . (C) Risk question . (D) Summary . Planners . . Note: Sample consists of non-‐retired respondents age 25–64. DK indicates respondent does not know the answer. Planners are individuals who have any voluntary savings. . 17 Eight hundred and seventy-‐three retired respondents are under age 65. . 16 .
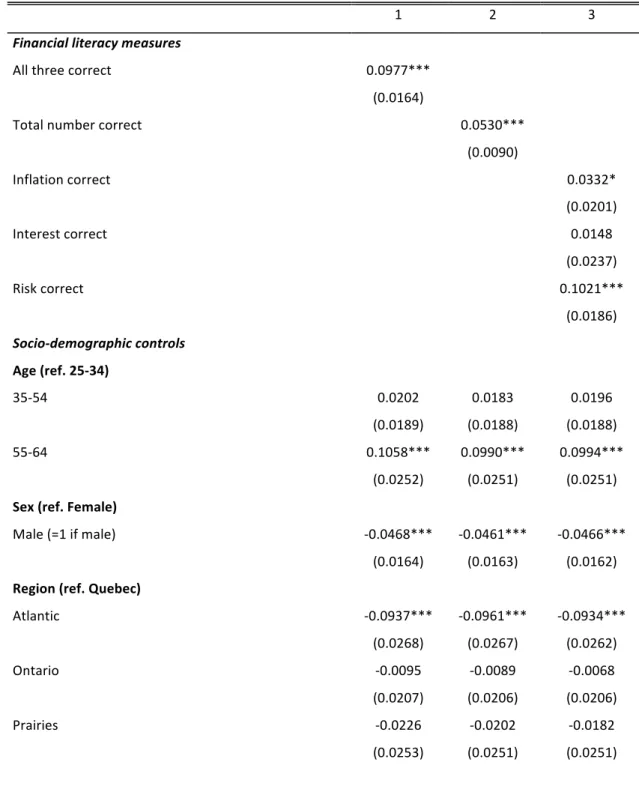
(19) In Table 5 we show the results of regressions to assess the impact of financial literacy on retirement planning—this time controlling for a rich set of demographic characteristics and income.18 As in the studies in other countries, we use three different specifications for financial literacy: (1) whether the respondent answered all three questions correctly; (2) the number of questions the respondent answered correctly; and (3) dummies for each of the questions the respondents answered correctly. Income information is reported using eight broad categories, rather than as a continuous variable. These categories are coded using dummy variables (one dummy for each income category).19 The same is true for age, which is represented as a set of dummies for age groups rather than as a continuous variable. We do not use visible minority status as a control because of the large number of “don’t know/prefer not to say” responses (almost 10 percent; i.e., as many as the number of individuals who identify themselves as belonging to a visible minority). The survey does not provide information regarding marital status and, as a result, we cannot use this variable in our regressions.20 Even after controlling for many demographic characteristics, including income, Table 5 shows there continues to be a strong link between financial literacy and retirement planning. Specifically, those who answered all three questions correctly are about 10 percentage points more likely to have savings, including in an RRSP, RRIF, pension plan, or TFSA. Similarly, those who can answer one extra financial literacy question have an 18 Logit marginal effects were very similar to OLS estimates. Here we use the linear probability model to . compare results with other countries . 19 About 15 percent of respondents did not report their income. To be able to rely on the full sample, we . imputed the missing observations on income as described in Appendix B. 20 Appendix C provides descriptive statistics for the full sample and the sample used in the regressions. . . 17 .
(20) increased probability (5.3 percentage points) of having savings. The concept that matters the most for retirement planning is risk diversification: those who correctly answered the risk diversification question have a 10.2-‐percentage-‐point-‐higher probability of having savings. Table 5. Linear probability models for retirement planning . 1 . 2 . 3 . . . . 0.0977*** . . . 0.0530*** . . Financial literacy measures All three correct . (0.0164) Total number correct . . (0.0090) Inflation correct . . . 0.0332* (0.0201) . Interest correct . . . 0.0148 (0.0237) . Risk correct . . . 0.1021*** (0.0186) . Socio-‐demographic controls . . . . Age (ref. 25-‐34) . . . . 0.0202 . 0.0183 . 0.0196 . (0.0189) . (0.0188) . (0.0188) . 0.1058*** . 0.0990*** . 0.0994*** . (0.0252) . (0.0251) . (0.0251) . Sex (ref. Female) . . . . Male (=1 if male) . -‐0.0468*** . -‐0.0461*** . -‐0.0466*** . (0.0164) . (0.0163) . (0.0162) . . . . -‐0.0937*** . -‐0.0961*** . -‐0.0934*** . (0.0268) . (0.0267) . (0.0262) . -‐0.0095 . -‐0.0089 . -‐0.0068 . (0.0207) . (0.0206) . (0.0206) . -‐0.0226 . -‐0.0202 . -‐0.0182 . (0.0253) . (0.0251) . (0.0251) . 35-‐54 55-‐64 . Region (ref. Quebec) Atlantic Ontario Prairies . . 18 .
(21) British Columbia and Territories . -‐0.0258 . -‐0.0261 . -‐0.0214 . (0.0274) . (0.0275) . (0.0277) . . . . 0.1221*** . 0.1159*** . 0.1138*** . (0.0401) . (0.0401) . (0.0400) . 0.1618*** . 0.1530*** . 0.1516*** . (0.0401) . (0.0402) . (0.0401) . 0.1878*** . 0.1790*** . 0.1774*** . (0.0414) . (0.0416) . (0.0416) . 0.2314 . 0.2207*** . 0.2187*** . (0.0403) . (0.0407) . (0.0407) . . . . 0.1472*** . 0.1392*** . 0.1404*** . (0.0366) . (0.0363) . (0.0362) . 0.2266*** . 0.2162*** . 0.2178*** . (0.0371) . (0.0371) . (0.0368) . 0.3423*** . 0.3352*** . 0.3358*** . (0.0366) . (0.0366) . (0.0366) . 0.3643*** . 0.3555*** . 0.3565*** . (0.0368) . (0.0368) . (0.0368) . 0.4087*** . 0.4014*** . 0.4017*** . (0.0371) . (0.0370) . (0.0370) . 0.3828*** . 0.3707*** . 0.3723*** . (0.0452) . (0.0451) . (0.0453) . 0.3929*** . 0.3857*** . 0.3881*** . (0.0386) . (0.0386) . (0.0384) . . . . -‐0.0770*** . -‐0.0774*** . -‐0.0774*** . (0.0291) . (0.0289) . (0.0291) . -‐0.1841*** . -‐0.1799*** . -‐0.1780*** . (0.0252) . (0.0251) . (0.0250) . 0.2934*** . 0.2431*** . 0.2539*** . (0.0491) . (0.0478) . (0.0485) . 0.2434 . 0.2449 . 0.2480 . Education (ref. <High School) High School Technical, Vocational Post-‐Secondary School CEGEP or Some University College and Post Graduate Income (ref. under $20,000) $20,000 to under 40,000 $40,000 to under $60,000 $60,000 to under $80,000 $80,000 to under $100,000 $100,000 to under $125,000 $125,000 to under $150,000 $150,000 or more Employment status (ref. Empl. for wage) Self-‐employed Not working . Constant 2. R . Note: Robust standard errors in parentheses; ***P<0.01; **P<0.05; *P<0.10. Sample consists of 4,082 non-‐ retired respondents age 25–64. “Not working” includes students, homemakers and the unemployed. . . 19 .
Figure


+3
Documents relatifs
Here we study the impact of strong coupling strength, given by the Rabi splitting energy (ħΩ R ), on the thermody- namic parameters associated with the transition state of
Coulaient les heures, fluides et semblables Leur cours léger et bleu portait ma rêverie Entre les herbes folles de leurs rives de sable.. Toutes ces journées,
High level of financial literacy makes a large contribution to the financial well-being of individuals, because financially literate individuals are more likely to plan for
Since Clark’s was the Roepke Lecture in Economic Geography, I expected the article to analyze the geographic differentiation of financial risk, geo- graphic differentiation in levels
ﺚﺤﺒﻤﻟا لوﻷا : ﻢﻠﻋ ةﺄﺸﻧ رﺎﺛﻵا. ﺐﻠﻄﻤﻟا لوﻷا : ﻢﻠﻋ ناﺪﻴﻣو لﺎﳎ رﺎﺛﻵا. ﺐﻠﻄﻤﻟا ﻲﻧﺎﺜﻟا : ﺐﻴﻟﺎﺳأو ﺞﻫﺎﻨﻣ ﻢﻴﻣﱰﻟا. ﺚﺤﺒﻤﻟا ﻲﻧﺎﺜﻟا : ﻲﻧاﺮﻤﻌﻟا ﻦﻳﻮﻜﺘﻟا ﺮﺼﻘﻠﻟ. ﺐﻠﻄﻤﻟا
In Section 1 , we define the Bernoulli numbers attached to mod l Galois characters that appear in the statement of Theorem 1 above and compute the constant term at the various cusps
Ce travail de recherche nous permet de démontrer l’interet d’une regénération qui vise à faire revivre cette interaction entre la fonction patrimoniale et la fonction commerciale
Ces derniers se trouvent confrontés à un choix cornélien : soit assumer un échec social face à leurs familles et proches en Tunisie, soit perdurer dans une situation de sous-
