Cahier de recherche C Coonnttiinneennttaalliissaattiioonn ISSN 1714-7638
THE U.S., ITS RELUCTANT SATELLITES, AND THE ISSUE OF
DEEP INTEGRATION IN THE AMERICAS
DORVAL BRUNELLE
Centre Études internationales et Mondialisation
Institut d’études internationales de Montréal Université du Québec à Montréal
C.P. 8888, succ. Centre-ville, Montréal, H3C 3P8 Tel : (514) 987 3000 # 3910
http://www.ceim.uqam.ca
“The U.S. national security strategy will be based on a distinctly American internationalism…”
The National Security Strategy of the United States of America, September 2002, p. 1.
For over ten years, the North American Free Trade Agreement (NAFTA) has proven to be flexible enough to adapt itself to multiple asymmetrical integrations within the North American continent and sturdy enough to withstand any serious setbacks. This is quite an achievement when one compares it to the floundering of the talks surrounding the Free Trade Area of the Americas (FTAA) or to the standstill now affecting the European Union (EU) integration process since the ''NO'' vote on the European Constitution following the referendums held in France and the Netherlands, in the Spring of 2005.1
Today, NAFTA is still as strong as ever, and negociations within its ambit, particularly in the agricultural sector, are advancing according to the schedule agreed on in 1993, in spite of a mounting social opposition in Mexico.2 In addition, upon entering its second decade since it first came into force, on January 1st 1994, there is now mounting pressure from both Mexico and Canada in favour of upgrading the accord in order to move toward « deep integration ». Incidentally, two observations should be made at this stage concerning this expression : the first pertaining to the fact that, because of differences in size between the NAFTA partners, the notion of « deep integration » has no relevance whatsoever in the US context. The second observation concerns the expression itself which, in the present case, bears little resemblance to the classical definition according to which « deep integration » refers to an economic integration that goes beyond the removal of barriers to trade towards
1 This does not mean that there are no hurdles ahead, since the political situation is quite volatile in Mexico,
where Andres Manuel Lopez Obrador, ex-mayor of Mexico DF, and candidate of the Partido de la Revolucion Democratica (PRD, left), favoured to win the presidential elections in 2006, has come out quite critically, if not directly against NAFTA, at least against its neo liberal agenda. Meanwhile, in Canada, where the Liberal Party of Canada (LPC, center-right) is in a minority position, the government has for the past year been threatened by the Conservative Party of Canada (PCC, right), as well as by the « separatist » Bloc Québécois (BQ, center-left). If the LPC were to lose the next elections, the ensuing political instability could lead to the breakup of the country.
2 See John Skorburg, NAFTA 2003 : What’s on the Horizon?, April 19, 2002, American Farm Bureau
Federation : « All agricultural tariffs between Mexico and the United States will be eliminated by January 1, 2008 ». On line : www.fb.com/issues/analysis/NAFTA_2003.html
the mutual recognition and subsequent harmonization of regulation and norms. In the present instance, deep integration has little to do with harmonization, understood as an agreement between parties to adapt their respective norms to a common rule or principle, but rather with the unilateral adjustment, on the part of both partners, to U.S. norms and standards.
Historically, the push for « deep integration » stemmed in large part from interior forces, and especially from commercial interests and others bent on intensifying integration at all levels between the three partners. In this sense, economic integration in North America was very much an open process compared to that of the EU, for instance. But since the events of September 11, 2001, the push for « deep integration » is spurred on by external factors which are intricately tied to strategic and security concerns. These external factors have come to supersede their internal counterparts and to exert even more pressure in setting up what some analysts have dubbed a « fortress North America », that is to say, in setting up a much more protective, if not protectionist, continental integration in North America.3
The unilateral implementation of requirements coming out of U.S. rule makers has met with greater urgency since September 11, 2001, as the spirit and content of the Trade Act of
2002,4 and the National Security Strategy of the United States of America of September 2002 show all too well. Pressure in this regard has been quite forceful in North America as we shall see. In actual fact, and paradoxically, if these new imperatives go a long way towards explaining the failure of the FTAA negociations, they provide at the same time the major inspiration for the Partnership for Prosperity and Security, agreed to by president Fox of Mexico and prime minister Martin of Canada, when they met at president Bush’s Crawford ranch near Waco, Texas, in April, 2005.
These remarks evoke two related questions which will be examined further on: the first has to do with the terms of economic integration as they are interpreted and applied by the U.S.,
3 One telling example of continental protectionism is the three year imposition by president Bush, on March 20,
2002, under Section 201 of U.S. trade law of temporary safeguard measures on key steel products, measures than did not apply to the other NAFTA partners, Canada and Mexico.
for the U.S., on one hand, and these same terms as they are implemented in Mexico and in Canada, on the other. In this regard, inwardly looking, continental integration is not only an asymetrical process opposing economies of different sizes and levels of development, but continental integration should increase the might and advance the well-being of one to the detriment of the other two. At same time, outwardly looking, economic integration should promote U.S. dominance in world affairs, while restraining Canada’s and Mexico’s international maneuverability.5 The second aspect has to do with the issue of free trade negociations on the part of each of the three governments with partners in the Americas and elsewhere. Here again, we must establish a clear distinction between before and after 9/11 or, better still, between before and after the Miami Summit of 2003, when the U.S. and Brazil failed to reach an agreement regarding further FTAA negociations. For all intents and purposes, as far Canada and Mexico are concerned, this failure impeded progress in their own negociations with other governments in the Americas, with the result that they both sought to negociate FTAs with partners in other parts of the world. In the U.S. case, the government responded with a new strategy and swiftly opened up trade negociations with, in particular, Central America and the Dominican Republic, as well as with three out of five Andean countries, all the while negociating FTAs with governements ouside the Americas. This consequence is all the more interesting as it would allow for the establishment of a connection between deeper continental integration on the part of Mexico and Canada, and their reduced presence in the Americas, a situation that would not apply in the case of the U.S., since continental integration would reap more dividends, and not less. In other words, deeper integration would be a political drain for the former partners, and a boon for the latter.
Our analysis comprises two parts. First, we will examine and explore the multi layered processes of integration within North America and, second, we will offer an succinct overview of bilateral FTAs between the US and other countries in the Americas. Our conclusion will point in the direction of a growing differentiation between a NAFTA-type
5 Arturo Guillen R. uses the expression « subordinate integration » to describe the nature of the relation between
Mexico and the U.S. This is an interesting expression and could, as we shall see, apply to Canada as well. See his : Mexico hacia el siglo XXI. Crisis y modelo economico alternativo, Mexico, Plaza y Valdes, 2001, page 86.
deep integration and integration as it prevails in other regional bilateral or plurilateral contexts.
WHAT IS THE MEANING OF « DEEP INTEGRATION »
IN NORTH AMERICA?
Considering long term and deeply seated anthropological, geographical and historical issues, integration within North America is bound to be a multifaceted process covering a host of collective endeavours and affecting many value systems. But, for our present purpose and in order to shed some light on the extent of the integrative processes now under way within North America, we will cover four aspects or dimensions of integration in the following sections: economic integration, institutional integration, infrastructure integration and, finally, security integration.6 Clearly, not all of these dimensions nor all aspects of each type of integration should be attributed to NAFTA, but nevertheless, NAFTA plays and has played an important role, either directly or indirectly, in reinforcing all of them.
Economic integration
Only two out of the 23 major regional economic agreements actually in force throughout the world have had significant integrative effects : the European Union and NAFTA. Between 1980 and 2001, regional trade as a percentage of total exports grew from 60,8 to 61,2% in the former case and from 33,6% to 54,8% in the latter. None of the other 21 agreements come close to these levels of integration, and even ASEAN or MERCOSUR, the third and fourth in importance in terms of intra-regional trade, saw their internal trade barely pass the 20% mark between these dates. In fact, all nine regional economic agreements in Africa, the six in Latin America and four in Asia, have had at best mitigated results, at worse negative ones.7
6 The first aspect will be given a broader treatement here, whereas we will only provide one example in each of
the three other instances.
7 According to data provided by UNCTAD. See : D. Brunelle, « La cinquième rencontre ministérielle de
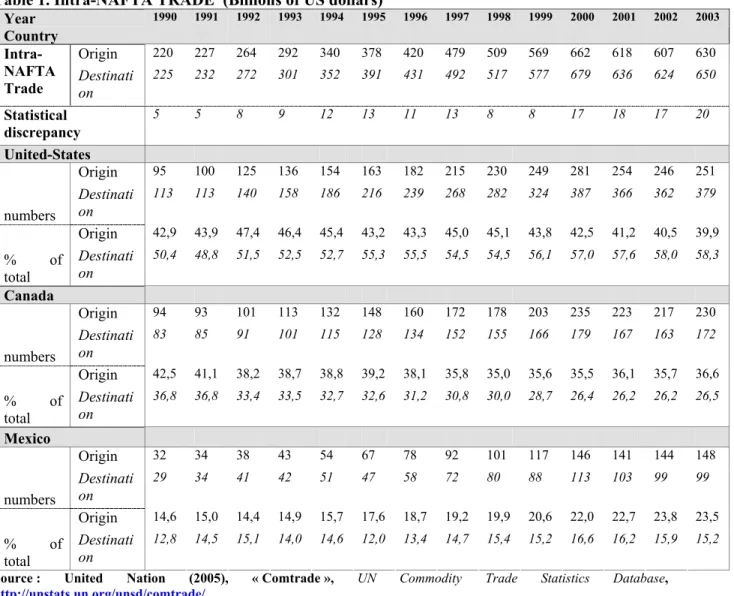
In North America, as Table 1 below shows, intra-zone trade by origin as well as by destination grew by close to 300% between 1990 and 2003. Mexico’s exports to the US accounted for 70,45% of total exports in 1990, and for 88,91% in 2003. Canada’s exports to the US accounted for 75,77% of total exports in 1990, and for 85,88% in 2003. These progressions are even more impressive when one looks at bilateral trade with the US as a percentage of GDP. In the case of Canada, exports to the US stood at 16,5% of GDP in 1990, and at 27,2% in 2003. In Mexico, the corresponding figures are 7% and 23,9%, while in the U.S., exports to Canada and Mexico stood at 1.9% in 1990 and 2.5% of GDP in 2003.
Table 1. Intra-NAFTA TRADE (Billions of US dollars)
Year Country 1990 1991 1992 1993 1994 1995 1996 1997 1998 1999 2000 2001 2002 2003 Origin 220 227 264 292 340 378 420 479 509 569 662 618 607 630 Intra-NAFTA Trade Destination 225 232 272 301 352 391 431 492 517 577 679 636 624 650 Statistical discrepancy 5 5 8 9 12 13 11 13 8 8 17 18 17 20 United-States Origin 95 100 125 136 154 163 182 215 230 249 281 254 246 251 numbers Destinati on 113 113 140 158 186 216 239 268 282 324 387 366 362 379 Origin 42,9 43,9 47,4 46,4 45,4 43,2 43,3 45,0 45,1 43,8 42,5 41,2 40,5 39,9 % of total Destinati on 50,4 48,8 51,5 52,5 52,7 55,3 55,5 54,5 54,5 56,1 57,0 57,6 58,0 58,3 Canada Origin 94 93 101 113 132 148 160 172 178 203 235 223 217 230 numbers Destinati on 83 85 91 101 115 128 134 152 155 166 179 167 163 172 Origin 42,5 41,1 38,2 38,7 38,8 39,2 38,1 35,8 35,0 35,6 35,5 36,1 35,7 36,6 % of total Destinati on 36,8 36,8 33,4 33,5 32,7 32,6 31,2 30,8 30,0 28,7 26,4 26,2 26,2 26,5 Mexico Origin 32 34 38 43 54 67 78 92 101 117 146 141 144 148 numbers Destinati on 29 34 41 42 51 47 58 72 80 88 113 103 99 99 Origin 14,6 15,0 14,4 14,9 15,7 17,6 18,7 19,2 19,9 20,6 22,0 22,7 23,8 23,5 % of total Destinati on 12,8 14,5 15,1 14,0 14,6 12,0 13,4 14,7 15,4 15,2 16,6 16,2 15,9 15,2
Source : United Nation (2005), « Comtrade », UN Commodity Trade Statistics Database,
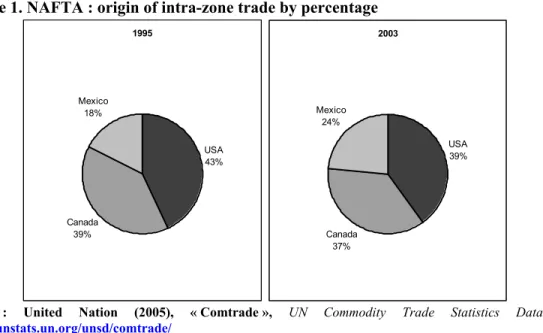
The figure below illustrates the relative importance of intra-zone trade for the three NAFTA partners. Between 1995 and 2003, percentage of intra-zone trade by origin actually fell from 43% to 39% for the US, and from 39% to 37% for Canada, while growing from 18% to 24% in Mexico’s case.
Figure 1. NAFTA : origin of intra-zone trade by percentage
1995 USA 43% Canada 39% Mexico 18% 2003 USA 39% Canada 37% Mexico 24%
Source : United Nation (2005), « Comtrade », UN Commodity Trade Statistics Database,
http://unstats.un.org/unsd/comtrade/
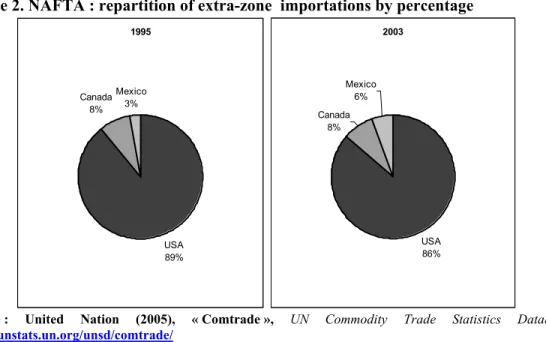
On the other hand, as Figure 2 below shows, if specialization in intra-zone trade has secured greater access, in relative terms, to world markets for Mexico (from 3% in 1995 to 6% in 2003) at the expense of the U.S. (89% in 1995 and 86% in 2003), in this case the increase in extra-zone importations is basically attributable to the strategy applied by U.S. firms in Mexico.
Figure 2. NAFTA : repartition of extra-zone importations by percentage 1995 USA 89% Canada 8% Mexico 3% 2003 USA 86% Canada 8% Mexico 6%
Source : United Nation (2005), « Comtrade », UN Commodity Trade Statistics Database,
http://unstats.un.org/unsd/comtrade/
The two graphics below show the extent of U.S. market dominance for both Mexico and Canada, and give at the same time, in an insert, the evolution of exports to other parts of the world excluding the U.S.
Graph 1. Mexican exports by country and region.
Insert : exports by country and region excluding the U.S. (billions of dollars)
Canada USA
Latin America and C. European Union ASEAN China 0 50 100 150 1984 1986 1988 1990 1992 1994 1996 1998 2000 2002 Canada Latin Am. and C. European Union ASEAN China Japan 0 3 6 1984 1986 1988 1990 1992 1994 1996 1998 2000 2002
ASEAN: Association of Southeast Asian Nations
Source : United Nation (2005), « Comtrade », UN Commodity Trade Statistics Database,
http://unstats.un.org/unsd/comtrade/
As far as the Mexican economy is concerned, exports to Canada have progressed notably under NAFTA, whereas those with the EU did not catch up since their past peak in1996. In Canada’s case, exports are still concentrated on two markets: the U.S. and the EU, even though importations from China are progressing rapidly.
Graph 2. Canadian exports by country and region.
Insert : exports by country and region excluding the U.S. (billions of dollars)
Mexico USA
Latin America and C.
European Union ASEANChina 0 50 100 150 200 250 1984 1986 1988 1990 1992 1994 1996 1998 2000 2002 Mexico
Latin Am. and C.
European Union ASEAN China Japan 0 5 10 15 1984 1986 1988 1990 1992 1994 1996 1998 2000 2002
ASEAN: Association of Southeast Asian Nations
Source : United Nation (2005), « Comtrade », UN Commodity Trade Statistics Database,
http://unstats.un.org/unsd/comtrade/
This being said, the nature of economic integration in North America is quite different from that of economic integration in the EU, and in other contexts as well. Whereas economic integration operates first and foremost through trade between firms and between sectors, in North America, intra firm trade, as well as activities of majority owned foreign affiliates (MOFAs) represent two dominant features of continentalization.8
8 On this issue, see Christian Deblock and Éric Jasmin, Mondialisation et régionalisation des investissements :
les investissements directs des Etats-Unis dans les Amériques, Cahier de recherche Continentalisation 05-03, February 2005. On line : www.ceim.uqam.ca
These elements all point in the same direction to wit, contrary to what some analysts contended at the time, continental integration did not act as a springboard for either Mexico or Canada, since both economies are much more dependent today on U.S. firms and their strategy than they were previously.
Integration through institutions
As is well known, contrary to the EU, integration in North America does not operate through common public institutions, but this does not mean that economic integration is exclusively market based and driven solely by private actors. On the contrary, as far as integration between the US and Canada is concerned, in a host of sectors -from culture, to sports9, to education10- integration is done through regulatory agencies controlled in large part by the US. The energy sector is a particularly interesting case in point because of its sensitivity to issues of security.11
In this sector, electricity supply and distribution between Canada and the US has operated through a body called the North American Electric Reliability Council (NERC). As Figure 3 shows, the NERC has carved out the continent North of the Rio Grande into ten regional commissions, three of which, in the East, the Centre and in the West, integrate adjacent provincial territories. British Colombia and Alberta, together with eleven Western States, form part of the Western Systems Coordinating Council (WSCC), while Saskatchewan and Manitoba, together with six Central States form part of the Mid-continent Area Power Pool (MAPP), and the six remaining provinces, together with seven New England States are part of the Northeast Power Coordination Council (NPCC).12
9 After all, professional hockey teams of the US and Canada have been operating and competing inside an
institution founded in 1917 called the National (sic) Hockey League.
10 These are not the only aspects, since there is also a spill over effect of NAFTA in other fields as well, to wit,
in the social sector. See Bruce Campbell, From Deep Integration to Reclaiming Sovereignty : Managing Canada-U.S. Economic Relations Under NAFTA, Canadian Center for Policy Alternatives, May 2003. On line : http://www.policyalternatives.ca
11 See Joseph M. Dukert, « The Evolution of the North American Energy Market », Center for Strategic and
International Studies, Policy Papers on the Americas vol. X, Study 6, Oct. 19, 1999. On line : www.csis.org/americas/pubs/
12 The Northeast Power Coordination Council is an organism which has the mandate to promote the reliability
ECAR : East Central Area Reliability Coordination Agreement ERCOT : Electricity Reliability Council of Texas
FRCC : Florida Reliability Coordinating Council MAAC : Mid-Atlantic Area Council
MAIN : Mid-America Interconnected Network MAPP: Mid-Continent Area Power Pool
NERC North American Electric Reliability Council NPCC : Northeast Power Coordinating Council SERC : Southeastern Electric Reliability Council SPP : Southwest Power Pool
WSCC : Western Systems Coordinating Council Source : Dukert (1999).
The geographical delimitation of these boundaries reflect an inescapable reality, e.g. the carving up of the Canadian economic union according to the requirements of U.S. major
council is responsible for the establishment of policies and regulations concerning the planning, the exploitation and the maintenance of the electrical networks. Hydro-Québec, a publicly owned utility, is member of the NPCC through its intermediary, TransÉnergie. See on line : www.hydroquebec.com
economic hubs. In turn, these forces consolidate North-South axis of development within Canada to the detriment of the East-West patterns of exchanges that have been the backbone of Canadian developement since Confederation. For the time being, as far as Mexico is concerned, only the State of Baja California del Norte is integrated into the NERC.
When it was originally set up, in 1965, the NPCC was a purely voluntary organization, but in recent years, pressures have been applied in favour of the creation of a full-fledged regulatory agency, the North American Electric Reliability Organization (NAERO) with powers to compel members to respect their obligations and commitments, particularly those entered into under the Canada U.S. Free Trade Agreeement (CUFTA) of 1989.13 The rationale behind this change is well spelled out in the following excerpt by two analysts :
Federal legislation is required to establish an independent, industry-led self-regulatory electric reliability organization (ERO) to ensure the continued reliability of the interconnected, high-voltage transmission grid in North America. The existing scheme of voluntary compliance with industry reliability rules is no longer adequate for today's competitive electricity market. The grid is now being used in ways for which it was not designed, and there has been a quantum leap in the number and complexity of transactions. The users and operators of the transmission system, who used to cooperate voluntarily on reliability matters, are now competitors without the same incentives to cooperate with each other or to comply with voluntary reliability rules. As a result, there has been a marked increase in the number and seriousness of violations of voluntary reliability rules. All of these changes are jeopardizing the very stability of the electric system upon which our economy and our society depends. There is little or no effective recourse today under the current voluntary system to correct such behavior. Not a single bulk-power system reliability standard can be enforced effectively today by either NERC or FERC. (…) Finally, FERC has no jurisdiction over the portions of the interconnected grid that extend into Canada and Mexico. Reliability rules must be made mandatory and enforceable, and they must be applied fairly to all participants in the electricity marketplace. To meet this need, NERC and a broad coalition of industry, state, and consumer organizations have agreed on a legislative proposal that would create an ERO to develop and enforce mandatory reliability rules. (…)The proposal follows the model of the Securities and Exchange Commission in its oversight of securities industry
13 According to the Hydro-Québec web site, the setting up of the NAERO is basically tied to the issue of
self-regulatory organizations (the stock exchanges and the National Association of Securities Dealers).14
As the above quotation makes quite clear, the central issue here is the substitution of mandatory and enforceable reliability rules to voluntary reliability rules, on the one hand, and the need to create a broad coalition, on the other. These dimensions are, rightly so, intimately tied to one another, since both legality and legitimacy play a foundational role in the establishment of the validity of a mandatory rule or norm or law. But at the same time, this raises the question of what role, if any, a foreign political entity, or a foreign consumer organization, can play in supporting the validity of a norm adopted under a jurisdiction with which it has no dealings. We see here at play, once more, the lopsided effect of an integration process which relies basically on the needs and exigencies of a partner who occupies such a dominant position in relation to the other two, that the legitimacy of the norm as seen from their own point of view occupies a blind spot in the eyes of the dominant power in question. This inescapable conclusion is the direct result of the overspill or of the extension of a national democratic process into an international arena without international political and social accountability.
Integration through infrastructure
The idea here is to draw attention to the fact that the advent of NAFTA has consolidated a major shift in the development of transportation infrastructure within North America, a shift that affects primarily both road and rail transports. Whereas, historically, national integration in the three countries relied on the development of transportation facilities e.g.
14 The article by David R. Nevius, NERC Vice President, and David N. Cook, NERC General Counsel, goes on
to say : « On April 25, 2002, the United States Senate passed a comprehensive electricity bill (H.R. 4) that contains the NERC consensus reliability proposal. The bill will ensure that a new North American electricity reliability organization operates fairly and effectively. The language expressly protects the important roles of the states and regions, while authorizing the creation of an industry-based, North America-wide organization with FERC providing oversight in the United States while ensuring that Canadian and Mexican interests in the reliability of the interconnected North American electric grid are also maintained. Senate and House conferees are meeting to resolve differences between Senate and House-passed energy bills. We expect them to pass a final energy bill that includes NERC's reliability provisions before year-end ». On line : NAERO.com
roads, trains, and waterways, in an East-West axis, recent exchange patterns now call for the implementation of transportation corridors in a North-South axis.
In 2002, the number of crossings of individuals at the Canada-U.S. border stood at 200 million, over half a million each day. The same year, 11 million trucks crossed the border, or 30 000 each day. On the Mexico-U.S. border, there are 540 million crossings per year, or 1,5 million a day.
A recent study on the subject came to the following conclusion :
The pace of growth is such that market forces, by themselves, cannot deal effectively with transportation as a system. Public-private partnerships are springing up, and government at all levels has an important role to play. Just what this role should be is still unclear, because the problems of rapid transportation growth are so multi-faceted, complex and incompletely understood.15
The North American Forum on Integration defines the issue in these terms :
Following the implementation of NAFTA, coalitions of interest have been formed in order to promote specific transport channels, to develop the infrastructures of these channels and to propose jurisdictional amendments to facilitate the crossing of borders. These coalitions include businesses, government agencies, civil organizations, metropolitan areas, rural communities and also individuals, wishing to strengthen the commercial hubs of their regions.16
The solution that is being contemplated, as far as road transportation is concerned at least,17 is the creation of trade corridors. One such corridor, in the East, proposes to draw the three countries closer together :
The central eastern region has two trade corridors, one urban, which passes through the largest North American cities and the industrial basins of the central eastern region, and another which is rural and which passes through the Great Plains in the U.S. and through the Canadian Praries.
15 John D. Wirth, Trade Corridors in North America, Symposium Report, October 1-3. 1999.
(northamericaninstitute.org).
16 From the North American Forum on Intergration (NAFI/FINA) website :
http://www.fina-nafi.org/eng/integ/corridors.asp?langue=eng&menu=integ#est
The urban corridor of NAFTA brings half of the North American population to within a single day’s journey by highway between Montréal, Canada, and Mexico. The corridor passes through the industrial stronghold of Canada and its largest market. It enters the United States at Port Huron and at Windsor, where it crosses the Ambassador bridge, the busiest bridge in North America, to join Detroit, Michigan, where the giants of the automobile industry are located. In the United States, the urban corridor follows “Corridor 18”, which extends to the lower Rio Grande valley in Texas, through Indianapolis, Indiana and Memphis, Tennessee.18
Some projects are even more ambitious since they would implement a complete integration of different means of transportation in a single infrastructure.
Interstate 69, for example, is a planned 1600 mile national highway connecting Mexico, the U.S., and Canada. Eight states are involved in the project: Once completed, I-69 will extend from Port Huron, Michigan to the Texas/Mexico border.
In Texas, I-69 will be part of the Trans-Texas Corridor (TTC) project – a 4000 mile network of existing and new toll roads – which will create the largest private highway system in America. Interstate 35, also called the Oklahoma to Mexico/Gulf Coast element, will be developed as part of the TTC.
Plans call for the TTC to be 1200 feet wide with 10 vehicle lanes (three passenger vehicle lanes in each direction), truck lanes (two in each direction), six rail lines (three in each direction), two tracks for high-speed passenger rail, two for commuter rail and two for freight. The corridor will include a 200 feet right-of-way for oil, gas, electric and water lines.19
In fact, traffic congestion is a permanent concern since the implementation of a just-in-time production and distribution model spurred on by the extension of intra-firm trade on both
18 See the NAFI/FINA website, op. cit.
19 Internationalization of U.S. Roads Has Begun, by Phyllis Spivey, News With Views, June 10, 2005. On line :
sides of the North and South borders. This issue, in particular, as well as the other two presented above, go a long way towards explaining the level of sensitivity that the continental economy as a whole experienced following the events of September11, 2001, and the subsequent closing down of both U.S. borders. This shutting of the borders, and the subsequent formation of long queues of trucks extending to 30 kilometers inland, and more, had a traumatic effect on businesses and business organizations both in Canada and in Mexico.
Integration and security
Since 9/11, security concerns have gained more urgency and tend to either impregnate or to trump each and every other issue. This new approach was clearly spelled out in The
National Security Strategy of the United States of America of September, 2002, and it has
been repeatedly taken up since, as former Canadian diplomat, John J. Noble, reminded the Standing Committee on Foreign Affairs and International Trade:
The US Ambassador to Canada has stated recently that US security concerns trump Canadian economic concerns. The challenge for Canadian policy makers is how to find a way to mesh these two objectives in a manner which both sides find acceptable.20
Canada rose quickly to the challenge and committed itself to maintaining a secure infrastructure as outlined in the Smart Border Declaration and Action Plan, signed December 12, 2001. The following year, Thomas d’Aquino, president of the Canadian Council of Chief Executives (CCCE), launched the North American Security and Prosperity
Initiative. This was followed by the setting up of a trilateral task force,21 which later issued a Statement calling for « the establishment of a North American Advisory Council (NAAC) that would prepare and monitor moves to further integrate the region over the next five years ». The Statement goes on to say : « The boundaries of the community would be
20 Statement to the Standing Committee on Foreign Affairs and International Trade on Canadian Foreign Policy
Objectives, by John J. Noble, retired Canadian diplomat and Director of Research and Communications at the Centre for Trade Policy and Law, Carleton University. March 27, 2003. On line:
www.carleton.ca/ctpl/pdf/papers/scfaitnoble.pdf
21 The task-force was co-chaired by former Canadian Deputy Prime Minister and Minister of Finance, John P.
defined by a common external tariff and an outer security perimeter. Within this area, the movement of people and products would be legal, orderly, and safe ».22 Nevertheless, this does not imply free movement of people across borders, since the U.S. will make visas compulsory for both Canadian and Mexican citizens as of 2008.
Finally, March 23, 2005, president Bush convened a North American summit at his ranch in Waco, Texas, where he met with president Fox and Prime Minister Martin. The three then signed The Security and Prosperity Partnership of North America which carries the following objectives :
(i) Implement common border security and bioprotection strategies;
(ii) Enhance critical infrastructure protection, and implement a common approach to emergency response;
(iii) Implement improvements in aviation and maritime security, combat transnational threats, and enhance intelligence partnerships; and
(iv) Implement a border facilitation strategy to build capacity and improve the legitimate flow of people and cargo at our shared borders;
(v) Improve productivity through regulatory cooperation to generate growth, while maintaining high standards for health and safety;
(vi) Promote sectoral collaboration in energy, transportation, financial services, technology, and other areas to facilitate business; and invest in our people;
(vii) Reduce the costs of trade through the efficient movement of goods and people; and
(viii) Enhance the stewardship of our environment, create a safer and more reliable food supply while facilitating agricultural trade, and protect our people from disease.23
The partnership establishes Ministerial-led working groups that « will respond to the priorities of our people and our businesses, and will set specific, measurable, and achievable
22 On line : www.cfr.org/…/trinational_call_for_a_north_american_economic _and_ security_
community_by_2_2010.php-31k-7Aug2005
goals. They will identify concrete steps that our governments can take to meet these goals, and set implementation dates that will permit a rolling harvest of accomplishment ».24
24 Idem.
THE US STRATEGY AND OTHER FTAS IN THE AMERICAS
After having given a broad outline of the deep integration processes now underway in North America, what can we make of the U.S.’s recent initiatives in negociating FTAs ? Analysing the outcomes of the FTAA negociations, José Antonio Rivas-Campos and Rafael Tiago Juk Benke ended their study with three possible scenarios, ranking them « from minimalist to maximized liberalization scenarios », and they added :
Whether the FTAA project will be successful or not is still uncertain. However it seems clear that the FTAA might be generating part of the regionalism that is occurring in the Western Hemisphere, i.e. several FTAs are being negociated and created in spite of the results of the broader project. This situation brings us to the debate of regionalism versus multilateralism, in which one particular argument could be highlighted : the creation of FTAs in the Americas will, in many aspects, supersede unstable preferential systems (e.g. GSP), bringing more stability and certainty to the trade flows, business and investments in the region, not to mention further political, social, environmental and security implications for the region.25 This comment points to the fact that there are probably less contradictions between the FTAA negociations and parallel multiple FTA negociations than one would have suspected. In fact, even before the U.S. and Brazil, the co-presidents of the last phase of the FTAA negociations, entered into the ill-fated compromise negociated during the mini-ministerial summit convened at Landsdowne, in November, 2003, a few weeks before the Eight Ministerial meeting held in Miami later that month26, it had been clear for quite some time, that the FTAA would not and could not be a single undertaking. After all, more than ten years after it came into force, even NAFTA is not a single undertaking, and will not be one in the foreseable future, as the analysis in the previous section has shown.
In this regard, bilateral or plurilateral FTAs should not be interpreted so much as second best options to an FTAA, or even as stepping stones towards a broader agreement, but more
25 José Antonio Rivas-Campos and Rafael Tiago Juk Benke (2003), « FTAA Negociations : Short Overview »,
Journal of International Economic Law 6(3), 661-694, at page 682.
26 The compromise in question was all about the implementation of a so-called new duality, according to which
the FTAA negociations were set on a two-tier track, with one set of basic and less demanding issues agreed to by all, and the remainder being negociated on a bilateral or sub-regional level. See the Ministerial declaration as posted by U.S. Commercial Service in Colombia : www.buyusa.gov/columbia.
as means of spreading a complex network of firms and businesses which can use these agreements as so many levers in their need for expansion and greater integration of their commodity chains. The office of the U.S. Trade Representative recognizes as much when it states that such bilateral agreements “deepen U.S. strategic and economic interests in Asia, the Middle East and Latin America.”27 Nevertheless, in considering the two most recent FTAs, the Central American (CAFTA-DR) and the Andean FTA under negociations with three out of the five Andean countries28, one should not forget that these agreements, as seen from a U.S. perspective at least, do not carry the weight of either NAFTA or the Chilean FTA of 2003. In fact, according to the extensive study carried out by the U.S. International Trade Commission, « it is quite clear that the major multilateral agreement (the Tokyo and Uruguay Round Agreements) have had more important effects on the economy than have the preferential agreements (U.S.-Israel, U.S.-Canada, and NAFTA)29 which in turn, as we saw in the preceeding section, have had more profound impacts on the U.S. economy, than an agreement with either Central America or the Andean countries will ever have.
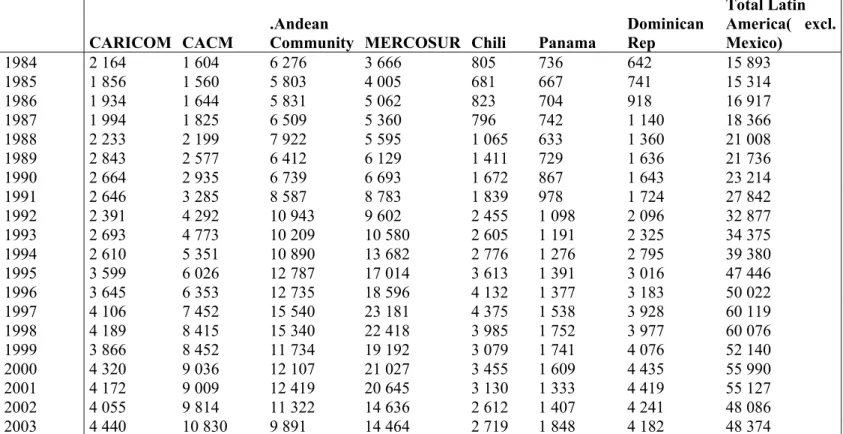
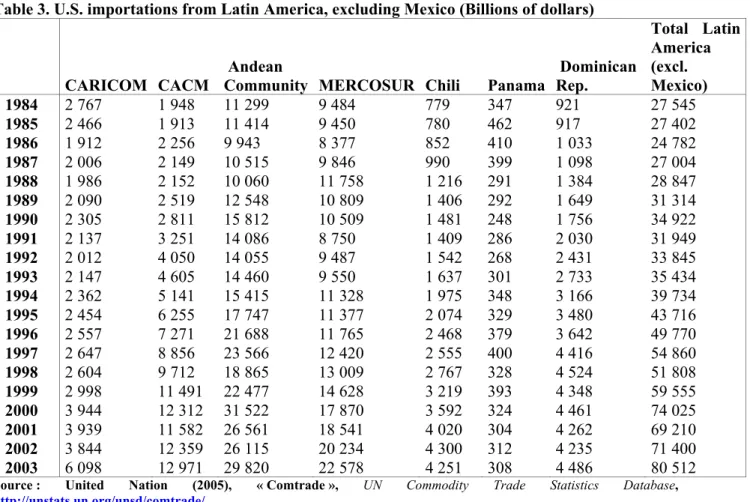
But this does not imply that an FTA with Central America is not an important issue, on the contrary, since this region with a population of 38 million, occupies the 16th rank among U.S. commercial partners, before Italy. Tables 2 and 3 below show the importance of both exports and imports of the Central American Common Market (CACM) compared to that of other sub-regions in Latin America. As far as exports are concerned, the CACM countries rank second after MERCOSUR, and on the side of imports, they rank third, basically because of the importance of petrol imports from Venezuela to the U.S.
Furthermore, as the data from Table 2 below show, U.S. exports to the CACM now rank second in importance behind exports to the MERCOSUR which have declined sustantially over the past few years. They stood at 10 billions US dollars in the first case and at over 14
27 Office of the USTR.
The US has FTAs with Andean Countries (Bolivia Colombia, Ecuador and Peru), Australia, Bahrain, Chile, Central America, Israel, Jordan, Morocco, Panama, Singapore, Southern African Customs Union, while the European Union has bilateral trade agreements with 35 countries and is negotiating BTAs with 15 more.
28 Columbia, Peru and Ecuador are part of these negociations, Bolivia acts as an observer, while Venezuela is not
involved. On ther other hand, negociations of an FTA with Panama have been under way since April, 2004.
29 See U.S. International Trade Commission, The Impact of Trade Agreements : Effect of the Tokyo Round,
U.S.-Israel FTA, U.S.-Canada FTA, NAFTA, and the Uruguay Round on the U.S. Economy, Publication 3621, Washington, DC, August 2003, page iii.
billions US dollars in the second. If we add U.S. exports to the Dominican Republic, the CAFTA-DR accounts for about the sam eamount as MERCOSUR does.
Table 2. U.S. exports to Latin America, excluding Mexico (In billions of dollars)
CARICOM CACM
.Andean
Community MERCOSUR Chili Panama
Dominican Rep Total Latin America( excl. Mexico) 1984 2 164 1 604 6 276 3 666 805 736 642 15 893 1985 1 856 1 560 5 803 4 005 681 667 741 15 314 1986 1 934 1 644 5 831 5 062 823 704 918 16 917 1987 1 994 1 825 6 509 5 360 796 742 1 140 18 366 1988 2 233 2 199 7 922 5 595 1 065 633 1 360 21 008 1989 2 843 2 577 6 412 6 129 1 411 729 1 636 21 736 1990 2 664 2 935 6 739 6 693 1 672 867 1 643 23 214 1991 2 646 3 285 8 587 8 783 1 839 978 1 724 27 842 1992 2 391 4 292 10 943 9 602 2 455 1 098 2 096 32 877 1993 2 693 4 773 10 209 10 580 2 605 1 191 2 325 34 375 1994 2 610 5 351 10 890 13 682 2 776 1 276 2 795 39 380 1995 3 599 6 026 12 787 17 014 3 613 1 391 3 016 47 446 1996 3 645 6 353 12 735 18 596 4 132 1 377 3 183 50 022 1997 4 106 7 452 15 540 23 181 4 375 1 538 3 928 60 119 1998 4 189 8 415 15 340 22 418 3 985 1 752 3 977 60 076 1999 3 866 8 452 11 734 19 192 3 079 1 741 4 076 52 140 2000 4 320 9 036 12 107 21 027 3 455 1 609 4 435 55 990 2001 4 172 9 009 12 419 20 645 3 130 1 333 4 419 55 127 2002 4 055 9 814 11 322 14 636 2 612 1 407 4 241 48 086 2003 4 440 10 830 9 891 14 464 2 719 1 848 4 182 48 374
Table 3. U.S. importations from Latin America, excluding Mexico (Billions of dollars)
CARICOM CACM
Andean
Community MERCOSUR Chili Panama
Dominican Rep. Total Latin America (excl. Mexico) 1984 2 767 1 948 11 299 9 484 779 347 921 27 545 1985 2 466 1 913 11 414 9 450 780 462 917 27 402 1986 1 912 2 256 9 943 8 377 852 410 1 033 24 782 1987 2 006 2 149 10 515 9 846 990 399 1 098 27 004 1988 1 986 2 152 10 060 11 758 1 216 291 1 384 28 847 1989 2 090 2 519 12 548 10 809 1 406 292 1 649 31 314 1990 2 305 2 811 15 812 10 509 1 481 248 1 756 34 922 1991 2 137 3 251 14 086 8 750 1 409 286 2 030 31 949 1992 2 012 4 050 14 055 9 487 1 542 268 2 431 33 845 1993 2 147 4 605 14 460 9 550 1 637 301 2 733 35 434 1994 2 362 5 141 15 415 11 328 1 975 348 3 166 39 734 1995 2 454 6 255 17 747 11 377 2 074 329 3 480 43 716 1996 2 557 7 271 21 688 11 765 2 468 379 3 642 49 770 1997 2 647 8 856 23 566 12 420 2 555 400 4 416 54 860 1998 2 604 9 712 18 865 13 009 2 767 328 4 524 51 808 1999 2 998 11 491 22 477 14 628 3 219 393 4 348 59 555 2000 3 944 12 312 31 522 17 870 3 592 324 4 461 74 025 2001 3 939 11 582 26 561 18 541 4 020 304 4 262 69 210 2002 3 844 12 359 26 115 20 234 4 300 312 4 235 71 400 2003 6 098 12 971 29 820 22 578 4 251 308 4 486 80 512
Source : United Nation (2005), « Comtrade », UN Commodity Trade Statistics Database,
http://unstats.un.org/unsd/comtrade/
CAFTA-DR ends most tariffs on more than $32 billion in goods traded between the U.S. and Costa Rica, El Salvador, Guatemala, Honduras, Nicaragua, and the Dominican Republic.
Graph 3. U.S. Exports to Latin America, excluding Mexico (In millions of dollars) CARICOM MCCA Comm. Andine Mercosur Chili Panama Rép Dominicaine 0 5 000 10 000 15 000 20 000 25 000 1984 1986 1988 1990 1992 1994 1996 1998 2000 2002
Source : United Nation (2005), « Comtrade », UN Commodity Trade Statistics Database,
http://unstats.un.org/unsd/comtrade/
Nevertheless, the very tight margin (217 yesses to 215 nays) by which the vote on CAFTA-DR was secured in the House of Representatives has lead former U.S. Trade representative, Clayton Yeutter, to predict that : « The administration won't continue to expand this energy and capital on these smaller agreements (and)there will be a great deal more attention paid to the World Trade Organization », and that, « shortly after the vote, acting USTR, John Portman, should fly to Geneva to meet with trade ambassadors and officials there about the flailing WTO negotiations ». 30
30 Global Unions Forum on Trade and International Labour Standards, July 28, 2005. On line : GURN@lists.solicomm.net
Finally, as far as the Andean FTA is concerned, the two graphs below show the extent of the three countries’ dependence on NAFTA, but especially on U.S. trade.
Graph 4. Exports of the three Andean FTA partners (Billions of dollars)
Intra-Comm. of Andean Nations NAFTA USA Other Lat. Am. And C. European Union ASEAN China Japan 0 6 12 1984 1986 1988 1990 1992 1994 1996 1998 2000 2002
Source : United Nation (2005), « Comtrade », UN Commodity Trade Statistics Database,
Graph 5. Importations of the three Andean FTA partners (Billions of dollars) Intra-Comm. of Andean Nations NAFTA USA Other Lat. Am. And C. European Union ASEAN China Japan 0 6 12 1984 1986 1988 1990 1992 1994 1996 1998 2000 2002
Source : United Nation (2005), « Comtrade », UN Commodity Trade Statistics Database,
http://unstats.un.org/unsd/comtrade/
Even though U.S. trade with Central America and the Andean countries is marginal, these new agreements could play an important role in extending outwards the deep integration model of development at play in the context of NAFTA.
CONCLUSION
We can draw two short conclusions from the previous analyses and comments. First, North America is going through a process of integration comparable to no other. Second if, at the end of the day, U.S. strategy would have sought to establish a worldwide NAFTA-type web, this will not happen soon and, in fact, is not likely to happen at all. Barely two years ago, in its World Investment Report 2003, UNCTAD ended its analysis with the question whether the world economy was moving towards the setting up of mega blocks, or not. This question seems at odds in the present context, especially after the « NO » votes on the European Constitution in France and the Netherlands, in the Spring of 2005, and considering the hurdles MERCOSUR and other regional agreements are facing. Neither the mega block model, nor the hub and spoke one, which sought to describe economic relations betwen the U.S. and their partners in the Americas, or even the idea of an extending set of concentric circles, either in the EU or the Americas, are apt to describe what has been happening recently.
Our own study tends to validate an alternative interpretation according to which we could be moving in an altogether different direction, with the confirmation of three major economic world powers : the U.S. with its reluctant satellites (Canada and Mexico), China, and India. These three alone find themselves at present in the enviable position of being able to pursue and establish their dominance on an external, as well as on an internal plane, whereas the EU, Latin America and others, have not yet surmounted major internal challenges in order to further integration and, for the time being at least, these challenges are impeding their emergence as credible rival powers on the international scene.