Montréal Mai 2001
Série Scientifique
Scientific Series
2001s-37Environmental Policy, Public
Interest and Political Market
Georges A. Tanguay, Paul Lanoie,
Jérôme Moreau
CIRANO
Le CIRANO est un organisme sans but lucratif constitué en vertu de la Loi des compagnies du Québec. Le financement de son infrastructure et de ses activités de recherche provient des cotisations de ses organisations-membres, d’une subvention d’infrastructure du ministère de la Recherche, de la Science et de la Technologie, de même que des subventions et mandats obtenus par ses équipes de recherche.
CIRANO is a private non-profit organization incorporated under the Québec Companies Act. Its infrastructure and research activities are funded through fees paid by member organizations, an infrastructure grant from the Ministère de la Recherche, de la Science et de la Technologie, and grants and research mandates obtained by its research teams.
Les organisations-partenaires / The Partner Organizations •École des Hautes Études Commerciales
•École Polytechnique •Université Concordia •Université de Montréal
•Université du Québec à Montréal •Université Laval
•Université McGill •Ministère des Finances •MRST
•Alcan inc. •AXA Canada •Banque du Canada
•Banque Laurentienne du Canada •Banque Nationale du Canada •Banque Royale du Canada •Bell Québec
•Bombardier •Bourse de Montréal
•Développement des ressources humaines Canada (DRHC)
•Fédération des caisses populaires Desjardins de Montréal et de l’Ouest-du-Québec •Hydro-Québec
•Imasco
•Industrie Canada
•Pratt & Whitney Canada Inc. •Raymond Chabot Grant Thornton •Ville de Montréal
© 2001 Georges A. Tanguay, Paul Lanoie et Jérôme Moreau. Tous droits réservés. All rights reserved. Reproduction partielle permise avec citation du document source, incluant la notice ©.
Short sections may be quoted without explicit permission, if full credit, including © notice, is given to the source.
ISSN 1198-8177
Ce document est publié dans l’intention de rendre accessibles les résultats préliminaires de la recherche effectuée au CIRANO, afin de susciter des échanges et des suggestions. Les idées et les opinions émises sont sous l’unique responsabilité des auteurs, et ne représentent pas nécessairement les positions du CIRANO ou de ses partenaires.
This paper presents preliminary research carried out at CIRANO and aims at encouraging discussion and comment. The observations and viewpoints expressed are the sole responsibility of the authors. They do not necessarily represent positions of CIRANO or its partners.
Environmental Policy, Public Interest and Political Market
*Georges A. Tanguay
†, Paul Lanoie
‡, Jérôme Moreau
§Résumé / Abstract
Ces dernières décennies, nous avons été témoins d’une prise de conscience collective sur les problèmes affectant la sauvegarde de notre patrimoine terrestre. Cependant, cette implication des pouvoirs publics dans ce domaine n’est pas uniforme. En effet, les législations adoptées à l’échelle de la planète varient encore grandement dans leur application, d’un pays à l’autre. Dans ce travail, nous nous intéressons à cet état de fait en mettant notamment en exergue les facteurs qui influencent les États à instaurer une réglementation plus ou moins stricte. Pour ce faire, nous étayerons notre argumentation grâce aux éléments d’analyse apportés par la théorie de l’intérêt public et par ceux de la théorie économique de la réglementation (théorie souvent mentionnée comme « théorie des groupes d’intérêt »). Nous nous apercevrons, au gré d’un travail empirique visant à analyser les politiques des 22 pays les plus développés de l’OCDE, que les groupes de pression ont un impact suffisant sur la réglementation environnementale pour nous assurer de la prépondérance de la thèse stiglerienne (théorie économique) sur la théorie de l’intérêt public ou général.
In this article, we highlight the factors which influence governments in their decision to implement environmental policies of varying degrees of severity. We substantiate our arguments with analytical evidence from public interest theory and the economic theory of regulation (“interest group theory”). We demonstrate, through empirical analysis based on the policies of the 22 most developed OECD countries, that pressure groups have sufficient impact on environmental regulation for us to be sure that economic theory outweighs public interest theory.
Mots Clés : Réglementation, environnement, intérêt public, marché politique
Keywords: Regulation, environment, public interest, political market
*
Corresponding Author: Paul Lanoie, CIRANO, 2020 University Street, 25th floor, Montréal, Qc, Canada H3A 2A5 Tel.: (514) 985-4020 Fax: (514) 985-4039 email: [email protected]
†
École des Hautes Études Commerciales
‡ École des Hautes Études Commerciales et CIRANO § CEGEDIM, Paris
1. Introduction
Over the past few decades, we have witnessed a collective heightening of awareness concerning the problems of environmental preservation. Nevertheless, government measures (regulations, taxes, etc.) adopted around the world still vary a great deal in their severity and application from one country to another. This paper will look at these disparities by studying what motivates governments to implement environmental policies of varying degrees of severity. We test two explanatory theories of regulation: first, public interest theory, which says government action must aim to maintain a situation of optimum well-being for the entire population of a country; second, economic theory of regulation, which considers that well-organized groups can influence government decision-making in their favour (Stigler, 1971; Olson, 1987).
Many studies have reviewed the different regulations using both economic and public interest theories, and they highlight the lack of consensus as to the primacy of one theory over the other. In a study on deregulation of the long-distance market in the United States, Kaserman et al (1993) demonstrate the dominance of economic theory to explain the decision to maintain a regulated market1. Nelson (1982) empirically tested whether, in the electricity industry, prices are set in the general interest (Ramsey-style rate structures), or whether the price policy adopted reflects a political influence. He obtained the result that public interest theory has greater explanatory power than that developed by Stigler. Nevertheless, Delorme et al (1992), in a similar study in the same sector of activity, reached a different conclusion which validated Stigler’s theory.
Also, along the lines of Stigler, but from a purely theoretical viewpoint, several authors have modelled government intervention in environmental matters as being the result of political pressure. Using a model where the government receives political contributions from ecological and industrial groups, Fredriksson (1997a, b) characterizes the political balance with respect to application of a tax on pollutant emissions and/or a pollution abatement subsidy. Among other things, it is demonstrated that political pressure can lead to pollution abatement subsidies aimed at redistributing wealth and that these subsidies can actually raise the level of pollution observed by bringing down the taxes on pollutant emissions via the political market. Damania (1999) also demonstrates that pollutant emission standards, which are less effective than economic instruments, could be chosen in response to political pressure from rent seeking. Fredriksson and Eliste (1999) demonstrate that lobbying activities can lead to production subsidies compensating for stricter environmental standards, since clear political pressure against these stricter standards would thus be diminished. Finally, Fredriksson (1999) uses a theoretical pressure group model to explain and predict the equilibrium level of a pollution tax in tariff-protected sectors. He demonstrates that the equilibrium tax obtained is sub-optimal.
1. However, their study comprised a low number of observations (36), and the variables concerning the public interest theory have very little variability and are fewer in number than those associated with the economic theory. Despite this, their model seems to us very relevant in the adopted approach, because it confronts two theories within a single model. Indeed, their model will be used as the basis for the empirical part of this article.
On the other hand, as to the empirical determinants of environmental regulation, only the study by Dion et al (1998) looked formally at this2. Using econometric methods, the authors studied the determinants of inspections in pulp and paper mills in Quebec. Their model does not succeed in discriminating perfectly between the two theories: both theories contribute to explaining the lawmaker’s choice as to resource allocation for inspection purposes.
Thus, through all the studies which compare the two regulation theories (environmental and other), it is not clear that one theory influences the lawmaker’s choices more than the other. Moreover, these studies were restricted to the observation to a single country or region. We shall therefore attempt to provide a more telling response by performing our estimates on a broader sampling of countries and making observations over several years. Consequently, we believe this study will shed new, complementary light on the determinants of regulation in general and, more specifically, on the determinants of environmental regulation. Indeed, it observes several representative OECD-member countries but, like the above-mentioned studies, it also presents political and economic considerations.
In Part 2, we summarize the respective dimensions of public interest theory on the one hand and economic theory of regulation on the other. This allows us to pinpoint the analytical evidence necessary for developing the theoretical framework. In Part 3, we present the empirical variables used and carry out estimates. In Part 4, we analyse the estimates conducted. We demonstrate that the economic theory of regulation appears to govern the decision-making processes of governments faced with introducing an environmental policy. The conclusion follows.
2. Theoretical framework 2.1 Public interest theory
Micro-economic theory says that governments are justified in intervening in the economy in the presence of externalities such as pollution, since their presence constitutes an obstacle to optimum resource allocation3. The state has several means of potential intervention for forcing polluting companies to face the real costs of their actions. First, economic instruments, which
2. An OECD report (1997a) looks at an environmental regulation bypassing process which is due to informational asymmetries used by the lawmaker and the subject contemplated by the regulation. Thus, since the latter controls the flow of information to the regulatory authority, it would also be capable of exerting a certain influence over the decisions made by the regulatory authority in its regard. Also, Jahn (1998) explains the different levels of pollution and environmental regimes for 18 OECD countries in 1980 and 1990, but does not distinguish between the two theories of regulation. More specifically, he explains the differences observed by means of economic, institutional, structural and political factors. He demonstrates that institutional factors are important in explaining differences in environmental policy among countries and policy changes observed over time. Political factors, for their part, would well explain the different levels of pollution from one country to another. Finally, Clark and Jones (1999), explain the lack of success experienced by a pressure group in blocking agri-environmental reforms by the activities of lobbying organizations with opposing goals.
3. Environmental problems can be explained by a lack of definition of the property rights essential for markets to run smoothly (Coase, 1960). Natural resources belong to no one or to everyone, depending on the viewpoint adopted, economic agents tend to over-use them compared with the optimum level, and the market when left to itself can generate excessive pollution.
can take several shapes: taxes, negotiable emission rights, etc. Second, through regulation (quantity, technology, etc.) following strict directives, with penalties where not complied with4. Regardless of the instruments selected, state intervention will depend on the scope of the environmental damage caused by pollution and the costs of eliminating it. At the optimum pollution level, government intervention will ensure that the marginal cost of eliminating pollution is equal to the marginal damage caused by the pollution.
2.2 Economic theory of regulation
In democratic political systems, governments will establish their policies not only to cater to the interests of the general voting public, but also to satisfy the interests of specific pressure groups. The policies established will then reflect the relative electoral weight of the different groups in terms of votes and of monetary and non-monetary contributions.
It was in this perspective that Stigler (1971) developed the “economic theory of regulation”, which is based on the principle that there is a regulation market. Demand comes from those (generally interest groups) who could benefit from legislation to enhance their well-being. Supply lies with the incumbent government, which seeks to maximize its current political support (with a view to being re-elected, for instance) 5,6,7.
In this context, regulation therefore no long necessarily arises in the presence of market imperfections, as public interest theory stipulates, but depends instead on the interplay of the objectives of the groups making the request and the government which, in its desire to remain in
4. An OECD study (1997a) shows that, even though the use of economic instruments is increasingly frequent, regulation remains the preferred method in most OECD countries. For instance, for questions concerning control and disposal of industrial waste, control of toxic emissions into the air by industry and, generally speaking, in cases of relatively harmful, hazardous chemicals, a regulatory approach remains necessary, and cost-effectiveness considerations (economic instruments) play only an indirect role in decision-making. In these situations, governments will attempt to achieve zero pollution owing to the uncertainty which arises as to the long-term impact of such pollution on the land-based heritage.
5. Aside from regulation, this second approach is also used to explain any form of government intervention. For instance, Grossman and Helpman (1994) characterized political balance with respect to establishing trade policy, and Kroszner and Stratman (1998) explain the organization of the U.S. Congress with respect to the establishment and structure of study committees in the financial services sector.
6. For instance, Dupré and Patry (1997), in a study of the electricity market in Quebec and Ontario since the start of the 20th Century, provide an explanation of differences in regulations between the two provinces based on the existence of stronger regulatory demand in Ontario, which was facing fiercer competition from U.S. companies, thus substantiating the thesis of the existence of a regulation market.
7. In the literature on the political economy of government decisions, another approach may be distinguished, which emphasizes electoral competition opposing political parties. The latter propose electoral platforms, and the economic agents grant their votes and contributions in order to maximize their expectation of net gain (in view of the probability of election, gains and costs). For instance, Magee et al (1989) and Hillman and Ursprung (1988) study the determination of trade policies in such models. Also, Ben Youssef and Ragni (1998) explain, using game theory to model a game between pressure groups and public decision-makers, what the political announcements of candidates who wish to maximize their probability of being elected have to be, knowing that their electoral campaigns are financed by interest groups defending technologies which pollute to varying degrees.
office, will place its coercive power at the service of a particular group in exchange for votes or resources (campaign contributions, for instance).
Stigler therefore maintains that, often, producer protection will prevail over the consumer’s interest. This protection in fact represents the dominance of a smaller group which has greater influence. Stigler and Peltzman (1976) call this phenomenon “the law of diminishing returns to group size”8. These groups, most of the time, outweigh numerically superior groups, since they are better organized, more active and better informed9. For instance, in our case, the secondary sector, which we consider to be the most polluting sector, should influence government to introduce more flexible provisions in its favour in order to fight more effectively against international competition (on this topic, see Jaffe et al, 1995).
3. Choice of variables
Based on the theoretical framework presented in the previous section, and proceeding like Kaserman et al (1993), we study the factors which influence the degree of severity of environmental regulations in 22 OECD countries. Our model takes the form illustrated in Table 1.
Table 1: Theoretical model Model SEVERITY = F (ETR, PIT)
Dependent variable SEVERITY
Independent variables ETR: variables reflecting economic theory of regulation PIT: variables reflecting public interest theory
3.1 Dependent variable
Since no indicator of the severity of environmental regulation is available for the period of our study, we had to identify a variable that would approximate to it10 . A recycling variable seemed to us to be a good choice, if we agree that: (1) the scope of recycling is strongly correlated to the
8. This is also demonstrated by Olson (1987), who states that the smallest groups often succeed in beating the larger groups which, in a democracy, would normally be expected to carry the day.
9. Nevertheless, in order to attract the lawmaker’s attention, the number of votes (group size) must be sufficiently high. A number of authors, including Peltzman (1976), wonder about the optimum size of a pressure group. There are two opposing forces here: on the one hand, the larger a pressure group, the more receptive the government will be, while on the other hand, the larger the group is, the higher its organizational cost will be, thereby reducing the gain from favourable regulations. The latter point refers notably to a concentrated benefit and diffuse cost policy (see Raynauld et al (1994) on this point).
10. Few studies have taken the time to construct such an indicator. Among those that have, the most useful is in a paper from the World Bank (Dasgupta et al, 1995). Nevertheless, although the study covers more than 30 countries, the countries represented are, for the most part, developing nations or under-developed countries. Several independent variables we wish to use are not available for those countries.
severity of environmental regulation and (2) recycling results essentially from government intervention. Such a variable exists in the World Competitiveness Report (WCR) produced by the Institute for Management Development (IMD)11. In fact, the recycling of resources variable is based on answers to the question: “Is recycling a widespread practice in your country?12” When we look more closely at this variable, it appears quite acceptable to us as a measurement of severity, for a number of reasons.
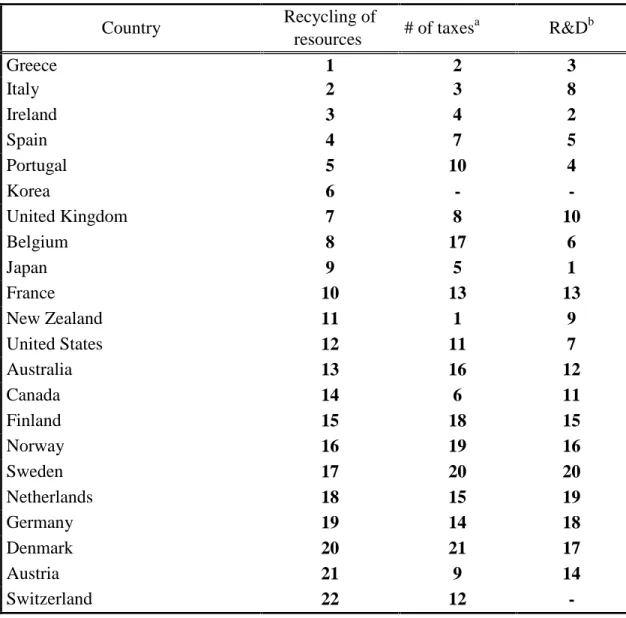
First, intuitively, ranking countries by severity of environmental policy by means of the recycling of resources variable corresponds to our perception of the reality. In fact, as we can see from Table 2, countries such as South Korea, Ireland, Greece and Portugal are among the least severe, while Scandinavia, Switzerland, Austria, Germany and the Netherlands are in the part of the table corresponding to the strictest countries.
Moreover, Table 2 presents two variables which confirm the correctness of our choice: taxes, and R&D spending on environmental protection. The “# of taxes” column lists the ranking of countries in terms of the number of taxes associated with environmental protection for 1994. The intuition here is that, generally speaking, the more a country has by way of taxes, the stricter it is in its environmental regulation. We subsequently associated this ranking with the dependent variable. Thus, if we divide the sample in two for each of the variables, we see that nine of the 11 considered “less severe” in terms of the recycling of resources variable are in the same group as that highlighted by the “number of taxes” variable ranking (reciprocally, eight of the 10 remaining countries). We applied the same reasoning with the examination of the R&D variable for 1994, and we reached the identical conclusion, namely that the recycling of resources variable appears to correspond convincingly to a measurement of the severity of environmental regulation.
11. This report, which has been produced annually for more than 15 years, compares some 50 countries through a plethora of criteria from various databases drawn up by numerous international agencies such as the OECD or the IMF. In addition, the IMD sends several surveys to senior managers and executives around the world to evaluate more intangible aspects characterizing the different countries under study.
12. The use of a poll-type variable can draw criticism since it may entail certain problems. In fact, biases can appear in responses where the individuals questioned do not have a comprehensive knowledge of their environment. These essentially involuntary biases (imperfect information) are characteristics specific to the polling method. Nevertheless, one cannot challenge the accuracy of the approach to the extent that it is based on a sampling of close to 3,000 people, all working as senior managers around the world and all from different professional private-sector backgrounds (SMEs, major corporations and multi-nationals in various sectors of activity). Moreover, the follow-up conducted on the method over the years brings an additional element of validity to the study.
Table 2: Ranking of the 22 countries with respect to the dependent variable for 1994 Country Recycling of resources # of taxes a R&Db Greece 1 2 3 Italy 2 3 8 Ireland 3 4 2 Spain 4 7 5 Portugal 5 10 4 Korea 6 - -United Kingdom 7 8 10 Belgium 8 17 6 Japan 9 5 1 France 10 13 13 New Zealand 11 1 9 United States 12 11 7 Australia 13 16 12 Canada 14 6 11 Finland 15 18 15 Norway 16 19 16 Sweden 17 20 20 Netherlands 18 15 19 Germany 19 14 18 Denmark 20 21 17 Austria 21 9 14 Switzerland 22 12
-Source: Based on the World Competitiveness Report (1994) and OECD (1997b) Note: (a) Ranking with respect to the number of taxes (see Appendix 1).
(b) Ranking with respect to R&D spending for environmental protection per inhabitant in $US when adjusted for purchasing power parity.
Table 3 summarizes the descriptive statistics for the recycling of resources variable and highlights the reliability of the variable over time13. In fact, we can observe that there are no
13. As the questionnaire was compiled for five years, from 1990 to 1994, and for 22 countries, our sample is of 110 observations.
major fluctuations, particularly in terms of standard deviations, from one year to the next. Moreover, since the average rises gradually each year, this also reinforces us in our choice of this variable as the dependent variable (since industrialized countries place increasing emphasis on environmental problems).
Based on these facts, recycling of resources will therefore serve us as the dependent variable, and for the purposes of this study we shall call it SEVERITY.
Table 3: Statistics for recycling of resources
1994 1993 1992 1991 1990 Total
Mean 58.16 56.22 53.14 51.87 50.79 54.04
Standard deviation 18.17 19.30 18.20 17.15 10.15 16.83
Minimum 25.20 20.40 27.00 24.30 34.41 20.40
Maximum 87.10 82.40 82.00 79.70 66.09 87.10
Note: 1 = less severe; 100 = more severe.
3.2Explanatory variables14
3.2.1 Public interest theory (PIT) variables
The environment is often considered as a regular commodity, so it would be logical, in theory, for severity of regulation to be greater in wealthier countries. In fact, as shown by Grossman and Krueger (1995) and Hettige et al (1992), there is an inverted-U relationship between certain pollution indices and a country’s wealth. These studies clearly show us that, from a certain stage of development, pollution tends to diminish (for all the countries in our sample, this stage is reached at a level beneath US$8,000 per inhabitant). A unanimous explicit indicator of a country’s wealth is Gross Domestic Product per inhabitant, adjusted for purchasing power parity, which we have named GDP in our estimate. We expect the GDP coefficient to be positive, and therefore the wealthier the country is in terms of purchasing power, the more severe its regulation will be.
In a different connection, if the most polluting economic sectors (secondary and to a lesser extent primary sectors) are larger in a given country, regulation in that country should be more severe, in order to reduce pollution-related externalities. The SERVICES variable which represents the percentage of the tertiary sector in domestic output will enable us to test this hypothesis. We expect the corresponding coefficient to be negative since, if the percentage for the tertiary sector
14. We wished to use the same source as far as possible, particularly to avoid any differences that might arise in the statistical methods of the agencies consulted. We therefore most often referred to the OECD and its different publications. The other sources used are from the U.S. Department of Labor, Greenpeace International, WCR and Keesing's Report—in other words, from reputable, internationally recognized agencies. Appendices 2 and 3, respectively, provide detailed descriptions of the variables used, along with descriptive statistics on them.
is high, then the sectors considered the most polluting are low, so regulation should not be severe. Nevertheless, as we shall subsequently see, this variable is also part of the series representing the economic theory of regulation, and only the sign of the coefficient of that variable will enable us to include it in either series (PIT or ETR)15.
There is also something known as the “neighbourhood effect”, whereby the closer we are to each other, the more our actions affect others. Thus, a country with a high population density should be more affected by pollution than a country whose inhabitants are far apart. We therefore collected data on the density of each country and named that variable DENSITY (the number of persons living per square kilometre). We expect the coefficient of that variable to be positive. Finally, the last variables in public interest theory concern CO2 emissions, which are used as a proxy for the scale of pollution16. According to this theory, the greater the pollution, the tougher a government should be toward polluters, so as to offset the externalities which the latter inflict on the entire population17. The figures used concern CO2 emissions from energy use18. We will take measurements into account in absolute terms and on a per-capita basis. We will also delay these variables by one period to allow for governments’ reaction time following the observed emissions. This therefore gives us four different variables: CO2 for emissions in millions of tonnes, CO2L for emissions with a one-year time lag, CO2in for emissions in tonnes per inhabitant, and CO2inL for emissions in tonnes per inhabitant with a one-year time lag19. We should observe plus signs for these variables. However, in view of the correlations among these variables, we will use only one at a time.
3.2.2 Economic theory of regulation (ETR) variables20
The main finding of Stigler's thesis is that there is a regulation market and that, consequently, pressure groups can win favours from governments. In the WCR, the LOBBYING variable clearly reflects this phenomenon. This poll-type variable indicates the impact of pressure groups on the government’s decision-making process. From the rating (the higher the indicator, the lower the groups’ impact), we expect, under this theory, a positive coefficient21.
15. A variable representing the percentage of the labour force working in the industrial sector was also used. The results were in line with those obtained with SERVICES.
16. We also carried out regressions with data on SO2 emissions. These gave similar results to those obtained with
CO2.
17. To all intents and purposes, we do not take into account transborder pollution for which compensation is included either in import taxes or through international agreements.
18. We contacted a member of the OECD’s Environment Branch in Paris directly, and he sent us the atmospheric pollution tables from the 1998 Environment Compendium.
19. We have the 1989 data at our disposal, so we do not have to reduce our sample when we use CO2L and CO2inL.
20. For readers interested in the political considerations of applying environmental measures, see Pearson (1995). 21. We consider here almost all these pressure groups to belong to the industry and therefore to be seeking more flexible regulations in their favour.
Also, a dominant secondary sector in a country’s economy should see its interests substantially reflected in the policy followed by that country’s government (producer protection). This refers to a variable which we have already introduced, namely SERVICES, and we expect a plus sign. In the same connection, it may be that in the name of competitiveness, business asks government for less severe regulation to offset high “production costs”. Tanguay and Marceau (2000) illustrate this idea in modelling where, so as not to adversely affect the competitiveness of their country’s businesses, each government could adopt offsetting measures to attract firms22. Thus, for instance, a firm facing higher taxes or labour costs could be granted compensation which may take the form of less severe environmental regulation23. Several indices reflect these costs and taxes. First, in industrialized countries, the greatest production cost is labour. Nevertheless, workers' hourly compensation is closely correlated with a country’s GDP24. Moreover, the total hourly cost of workers has to include fringe benefits as well as payroll taxes.
In this perspective, we therefore noted the employment tax rate sustained by businesses (payroll taxes) or, in other words, the percentage of direct compensation in relation to the total hourly cost borne by the employer. We called this variable DIRCOMP. This means the higher the percentage is, the closer the compensation received by the employee is to the employer’s real cost. A low percentage which would represent a high level of payroll taxes would mean that, in compensation, environmental regulation should be more flexible. We therefore expect a plus sign on this coefficient.
The OECD also publishes a listing of corporate taxes. We decided to take corporate taxes as a percentage of GDP, a variable we called TAXES. Conversely to DIRCOMP, but for the same reasons, we should observe a minus sign for the TAXES parameter. In fact, the higher the percentage is, the greater the tax burden on the corporation and, therefore, the more we should expect flexible regulation.
In addition to labour costs, we also consider the cost of another input, namely electricity. This variable, called ELECP, is quite simply the cost of electricity in $US/kWh (1990 constant) adjusted for purchasing power parity25. If there were indeed a phenomenon of compensation by governments, then the estimated coefficient should be negative.
We also included the unemployment rate in our estimate because, as shown by Dion et al (1998), local employment conditions are associated with economic theory. Indeed, regulation, although
22. This is along the same lines as the results in Fredriksson and Eliste (1999), which demonstrate that there is a type of compensation from governments in the form of transfers and subsidies when environmental standards are stricter.
23. An OECD (1995) report mentions, for instance, that Austria, Finland and Sweden have introduced taxes on the use of pesticides and fertilizers by farmers, but that the revenues from these taxes were then used to subsidize farmers.
24. For instance, the correlation between workers’ hourly compensation in the secondary sector in $US and the GDP variable is approximately 0.76. This strong correlation is not surprising to the extent that these variables represent wealth indicators.
25. We also considered using a capital cost measurement, but this was abandoned since there were only slight variations among countries.
this has never been demonstrated unequivocally, can have a negative effect on companies’ competitiveness and consequently on the jobless rate. The government will then face pressure to make their regulations more flexible in order to maintain the employment level. We therefore expect the UNEMPLOYMENT coefficient to be negative.
We have talked essentially of producer protection, but not yet of variables with a positive effect on the severity of regulations. In this perspective, we were interested in the international pressure group, Greenpeace, one of the most active organizations working to defend the environment since its creation in Canada in 1971. So we had to find a variable reflecting that group’s influence on governments. The number of members per national organization looked like a potential response. We have this information compiled in the variable GREEN. The coefficient is expected to be positive26.
The last variables in economic theory are political in nature. PARTY tells us the allegiance of the party in power in each of the countries for the period under consideration. So, taking our inspiration from the rating system developed by Blais et al (1993) and from Keesing’s Record, we created an indicator27 highlighting the political tendencies of parties in power. We will make the assumption that the parties furthest to the left take environmental issues into greater consideration than the countries further to the right, especially in response to alliances with green parties, as for instance in many European countries, including France. So our results for the parameter should be negative. But this variable should also be among the variables in public interest theory. Indeed, if the social preferences of a country’s inhabitants go toward leftist parties, then they will also, according to our hypothesis, go toward a healthier environment, which would support the public interest choice.
Finally, the VOTE variable reflects the political dimension in the sense that it represents the percentage of votes at the last election going to green parties in each of the countries studied28. We expect the estimated coefficient to be positive, given the additional political pressure due to the fact that more citizens support these green parties.
3.3 Econometric strategy
The use of panel-type data (we have 22 countries over five years) is generally accompanied by problems of autocorrelation and heteroscedasticity of residuals which violate the basic assumptions governing the use of the ordinary least squares (OLS) method. In this perspective, we conducted a number of tests to reveal these potential problems using the OLS method. As the Durbin-Watson statistic for our estimates tells us of the presence of an autocorrelation of order
26. We also made estimates with a variable representing the number of members of Greenpeace as a percentage of the population. The results obtained are similar to those presented here.
27. This indicator is based on a scale from 0 to 2: “0” for the parties furthest to the left, “1” for centrist parties and “2” for the parties furthest to the right. For instance, the U.S. Democrat Party has a “1” while the Republican Party has a “2” indicator.
28. Regressions carried out using the number of seats held by green parties yielded similar results to those obtained with VOTE.
one and, in addition, we were able to identify auto-regressive conditional heteroscedasticity (ARCH), we were forced to set aside the OLS method. Equations are estimated using a generalized least squares (GLS) procedure based on the cross-sectionally heteroscedastic and time-wise autoregressive model presented in Kmenta (1986). In addition, a Fisher test showed us the superiority of this model over the fixed effects model.
We then conducted a number of tests to ensure that our estimates were appropriate. We first ensured that the residuals had a normal distribution29. Second, we verified that the linear model outperforms the non-linear model30. Finally, following the argument stated in the previous chapter about offsetting measures granted to businesses, we looked at the potential endogeneity of the TAXES and DIRCOMP variables, which could have led to a bias in our results. But the Hausman test which reveals the presence of this type of problem through the use of an instrumental variable, which is the same variable (TAXES or DIRCOMP), but with a time lag, does not allow us to dismiss the hypothesis of exogeneity of these variables31.
Finally, after taking into account the correlations among the variables and excluding from the same regression any variables with more than 0.75 correlation, it is possible to use all the variables in the same estimate, except for pollution variables, which are highly correlated among themselves. In this perspective, we performed four different estimates, changing the pollution variables used.
4. Results
Table 4 presents the results of the regressions conducted with the coefficients of the variables for each theory, as well as their corresponding Student statistics. A rapid overview of the results reveals their constancy both in terms of the explanatory power of the estimates (R-squared from 0.75 to 0.84) and in terms of the estimated coefficients of the variables, which remain relatively steady from one estimate to another.
29. This test refers to the Jarque and Bera (1980) Lagrange Multiplier test, and enables us to affirm that the residuals from our estimates follow a normal distribution.
30. A Lagrange test demonstrates that the linear model performs better than the non-linear model.
31 We also tested for the exogeneity of all the other independent variables. It was rejected only for UNEMPLOYMENT and therefore, this variable was replaced by the lag unemployment rate.
Table 4 – Results of estimates
Variables
CO2 and CO2L CO2in and CO2inL
LOBBYING 0.65963*** 0.64804*** 0.67299*** 0.75074*** (9.090) (8.952) (9.017) (12.34) DIRCOMP 0.19679* 0.20523* 0.23106** 0.55957*** (1.273) (1.379) (1.572) (3.430) TAXES 0.46855 0.39478 0.61694 0.52286 (0.6172) (0.5168) (1.064) (0.9573) ELECP -73.485* -69.970* -95.413** -65.955* (-1.734) (-1.645) (-2.526) (-1.729)
GREEN 0.12152E-01*** 0.12654E-01*** 0.12414E-01*** 0.96815E-02***
(5.768) (5.940) (3.711) (4.354) PARTY -0.13858 0.10110E-01 -1.1794 -1.1223 (-0.1307) (0.9675E-02) (-1.081) (-1.134) VOTE 0.56726* 0.53166* 1.0464*** 0.99966*** (1.906) (1.839) (3.790) (3.991) UNEMPLOY-MENT -0.49810*** -0.49260*** -0.49258*** -0.50266*** (-4.320) (-4.302) (-4.189) (-4.539)
GDP 0.22748E-02*** 0.23166E-02*** 0.23583E-02*** 0.18663E-02***
(7.701) (7.798) (11.36) (8.610)
SERVICES -0.92181E-01 -0.10036 -0.34279 0.15035E-01
(-0.4627) (-0.5062) (-1.640) (0.7792E-01)
DENSITY -0.53611E-02 -0.61555E-02 -0.83874E-02 -0.16299E-01**
(-0.8028) (-0.9178) (-1.186) (-2.278) CO2 -0.26311E-02** (-3.063) CO2L -0.28929 E-02** (-3.298) CO2in -0.34705 (-0.8188) CO2inL -0.34819*** (-3.578) R2 0.7572 0.7584 0.8385 0.7836 NUMBER OF OBS. 110 110 110 110
Note: The values in brackets represent Student’s t statistics.
4.1 Economic theory of regulation variables
The coefficient of the LOBBYING variable is always significant and positive, as our predictions anticipated. Thus, the less influence pressure groups have on government action, the more severe the environmental regulation is.
The coefficient of the DIRCOMP variable (the percentage of direct compensation in relation to the total hourly cost, a proxy for the level of payroll taxes) is always positive, as expected, and its impact on the severity of regulation is statistically significant in one regression. Thus, in a very qualified way, higher payroll taxes for employers would be offset by less severe environmental standards.
Also, the estimated coefficient for TAXES always appears with the expected sign, that is, with a minus sign, which is explained by the offsetting measures we mentioned earlier in describing this variable. We have, however, to qualify our conclusion, since the results are never significant. The estimated coefficient for ELECP is negative and statistically significant (or barely significant) in each of the regressions. Thus, it appears that the higher the cost of electricity is, the less severe environmental policy is. Here again, it seems there might be offsetting measures from government for less severe environmental constraints when the cost of the electricity input is higher. In terms of elasticity, it ranges form 0.07 to 0.11, which means that an increase of 10 % in the cost of electricity would lead to an increase of between 0.7 and 1.1 % in our index of severity.
The coefficient of the variable of the number of Greenpeace members, GREEN, is positive, telling us as we expected that the environmental lobby has an impact on lawmakers. Furthermore, the results are always significant and relatively steady from one regression to the next. In terms of elasticity, taking the mean for the five years of our sample, we have a result of approximately 0.03.
The PARTY variable attributed to Stigler’s thesis reflects the tendency of the political party in power. Contrary to our expectations, the sign observed is positive in three regressions out of four. On the other hand, these estimated coefficients are never significant.
The estimated coefficients for VOTE are always positive and significant in the four regressions. So, the percentage of votes obtained by the green parties appears to have an impact on the severity of environmental policy. The elasticity ranges between 0.023 and 0.047.
The coefficient of the following variable, UNEMPLOYMENT, is always negative and significant. So, the severity of environmental policy is linked to the level of employment in a country, and a government facing higher unemployment would tend to establish less severe environmental policy. The elasticity is around 0.08.
4.2 Public interest theory variables32
For the GDP variable, the results observed are always positive and significant, confirming that the environment is a regular commodity, as in the rest of the literature. The elasticity of the SEVERITY variable in relation to GDP averages 0.75. Since wealth grows over time, we would therefore expect an increase in the severity of environmental regulation in the future.
The results of the SERVICES variable are not constant across our estimates, and are not significant. However, the sign obtained is consistent with our predictions (minus sign) in three regressions out of four. Note that Jahn (1998) does not find any significant impact either with respect to the level of tertiarization and the impact on pollution and the severity of environmental policy. The author would explain this by the fact that structural aspects are less important than wealth and modernity aspects when it comes to explaining environmental performance and severity of environmental regimes.
The coefficient of the population DENSITY variable by country appears non-significant (except once), and its sign is the opposite of our expectations for this theory. So we cannot come to any conclusions as to its impact on regulation.
The coefficients of the final series of variables concerning CO2 pollutant emissions, both with a time lag and without, are significant to 1% in three regressions and non-significant in the other case. On the other hand, they are negative and so do not have the expected sign, even though the results are, nonetheless, relatively constant. Thus, in the case of CO2 and CO2L, the estimated coefficients are approximately -0.004, while in the case of CO2in and CO2inL, they are close to -0.3. As an illustration, the elasticity of SEVERITY in relation to CO2 emissions is -0.02. So, we observe that the response of regulation to an increase in CO2 emissions, while negative, unlike what public interest theory tells us, remains nevertheless relatively low. Moreover, we could find some explanation for the minus sign in economic regulation theory. In fact, in countries where emissions are high, lobbies may be able to exert additional influence on government so that the state does not act against polluting companies.
5. Conclusion
This article has studied whether the severity of environmental policy was dictated by electoral concerns or responded above all to a concern for preservation of the public interest. We have demonstrated conclusively the dominance of Stigler’s theory over public interest theory. This was highlighted by the corroboration of most of the signs of the coefficients observed with the analytical evidence proposed by economic theory of regulation and by the explanatory power of the parameters. Thus, both in terms of the expected signs and of the significant power of the coefficients of the variables, economic theory of regulation appears superior to public interest theory. Virtually all the economic theory variables are of the expected sign, whereas only the
32. The number of variables used in our estimates for this theory may appear small, but we note that the SERVICES variable as well as, to a lesser extent, the PARTY variable could have been among this second series.
GDP variable is as expected for public interest theory. Moreover, the coefficients of the variables in the former theory are generally more significant than those in the latter theory. For these reasons, we conclude that economic theory of regulation outweighs public interest theory.
In short, while this study yielded a satisfactory answer to our questions concerning environmental regulation, it does not on its own represent a categorical conclusion as to the motives of governments around the world, for a number of reasons. First, this study concerns observations in 22 countries. While that is an acceptable number for conducting a satisfactory, worthwhile comparative study, it would be necessary to broaden the scope of observations to other countries, including the developing nations, which are ignored here. Second, while the five-year observation period is satisfactory for a reliable econometric study, it would be helpful to expand this period in line with available data, particularly in terms of the dependent variable.
Bibliography
Ben Youssef, A. & Ragni, L., “Jeux de politique environnementale : une approche en termes de lobbying”, Économie Appliquée, L1 (1), 1998.
Blais, A., D. Blake & S. Dion, “Do Parties Make a Difference? Parties and the Size of Government in Liberal Democracies”, American Journal of Political Science, 37 (1), February 1993, 40-62.
Clark, J.R.A. & A. Jones, “From Policy Insider to Policy Outcast ? COPA, EU Policymaking, EU’s Agri-environment Regulation”, Environment and Planning: Government and Policy, 75, 1999, 637-53.
Coase, R., “The Problem of Social Cost”, Journal of Law and Economics, 1960.
Coriat, B. & O. Weinstein, Les nouvelles théories de l’entreprise, Le Livre de Poche, Paris, 1995.
Damania, R., “Political Competition, Rent Seeking and the Choice of Environmental Policy Instruments”, Environmental and Resource Economics, 13 (4), 1999, 415-33.
Dasgupta, S., A. Mody, S. Roy & D. Wheeler, “Environmental Regulation and Development: A Cross-Country Empirical Analysis”, UNCED, Stockholm, March 1995.
Delorme, C.D, D.R. Kamerschen & H.G. Thompson, “Pricing in the Nuclear Industry: Public or Private Interest? ”, Public Choice, 73, June 1992, 385-96.
Dion, C., P. Lanoie & B. Laplante, “Monitoring of Pollution Regulation: Do Local Conditions Matter?”, Journal of Regulatory Economics, 13, 1998, 5-18.
Dupré, R. & M. Patry, “Hydroelectricity and the State in Quebec and Ontario: two different historical paths”, International Symposium on Deregulating the Electricity Market, HEC Montreal, September 1997.
Fredriksson, P.G., “Environmental Policy Choice: Pollution Abatement Subsidies”, Resource
and Energy Economics, 20, 1997a, 51-63.
Fredriksson, P.G., “The Political Economy of Pollution Taxes in a Small Open Economy”,
Journal of Environmental Economics and Management, 33, 1997b, 44-58.
Fredriksson, P.G. & Eliste P., “Environmental Regulations, Transfers, Institutions, and Trade: Theory and Evidence”, mimeo, 1999.
Fredriksson, P.G. “The Political Economy of Trade Liberalization and Environmental Policy”,
Southern Economic Journal, 65 (3), 1999, 513-25.
Grossman, G.M. & Helpman, E., “Protection for Sale”, American Economic Review, 84(4), 1994, 833-49.
Grossman, G.M. & A.B. Krueger, “Economic Growth and the Environment”, The Quarterly
Hettige, H., R.E.B. Lucas & D. Wheeler, “The Toxic Intensity of Industrial Production: Global Patterns, Trends, and Trade Policy”, American Economic Review, 92, May 1992, 478-91. Hillman, A. & Ursprung, H.W., “Domestic Politics, Foreign Interests, and International Trade
Policy”, American Economic Review, 78(4), 1988, 729-45.
Hoeller, P., A. Dean & M. Hayafuji, “New issues, new results: the OECD’s second survey of the macroeconomic costs of reducing CO2 emissions”, OECD Department of Economics and Statistics, Working Paper No. 123, OECD, Paris, 1992.
Jaffe, A.B., S.R. Peterson, P.R. Portney & R.N. Stavins, “Environmental Regulation and the Competitiveness of U.S. Manufacturing: What Does the Evidence Tell Us?”, Journal of
Economic Literature 33, March 1995, 132-63.
Jahn, D., “Environmental Performance and Policy Regimes: Explaining Variations in 18 OECD-Countries”, Policy Sciences, 31, 1998, 107-31.
Jarque, C.W. & A.K. Bera, “Efficient tests for normality, homoscedasticity and serial independence of regression residuals”, Economics Letters, 6, 1980, 255-59.
Kaserman, D.L, J.W. Mayo & P.L. Pacey, “The Political Economy of Deregulation: The Case of Intrastate Long Distance”, Journal of Regulatory Economics, 5, March 1993, 49-63.
Keesing’s Record of World Events, 1990 to 1995, Longman, Harlow, United Kingdom. Kmenta, J., Elements of Econometrics, Second Edition, MacMillan, 1986.
Kroszner, R.S. & Stratman, T., “Interest-Group Competition and the Organization of Congress: Theory and Evidence from Financial Services’ Political Action Committees”, American
Economic Review, 88 (5), 1998, 1163-87.
Lajeunesse, R., “L’impact de la réglementation sur la productivité des industries manufacturières québécoises entre 1985 et 1994”, École des Hautes Études Commerciales, Montreal 1997. Magee, S.P., Brock, W. A. & Young, L., Black Hole Tariffs and Endogenous Policy Theory:
Political Economy in General Equilibrium. Cambridge: Cambridge University Press, 1989.
Nelson, R.A., “An Empirical Test of the Ramsey Theory and Stigler-Peltzman Theory of Public Utility Pricing”, Economic Inquiry, XX, April 1982, 277-90.
OECD, Quarterly National Accounts, OECD, 1995a.
OECD, Environmental Taxes in OECD Countries, OECD, Paris, 1995b.
OECD, Revenue Statistics of OECD Member Countries 1965-1995, OECD, 1996a.
OECD, Integrating Environment and Economy: Progress in the 1990s, OECD, Paris, 1996b. OECD, Evaluating Economic Instruments for Environmental Policy, OECD, Paris, 1997a. OECD, OECD Historical Statistics 1960/1995, OECD, 1997b.
Olson, M., Logique de l’action collective, Second Edition, Presses Universitaires de France, Paris, 1987.
Pearson, M., “The Political Economy of Implementing Environmental Taxes” in Public
Economics and the Environment in an Imperfect World, Ed. Lans Bovenberg & Sijbren
Cnossen, Kluwers Academic Publishers, 1995, 37-57.
Peltzman, S., “The Economic Theory of Regulation after a Decade of Deregulation”, Brookings
Papers: Microeconomics, 1989.
Peltzman, S., “Toward a More General Theory of Regulation”, The Journal of Law and
Economics, 1976, 211-22.
Raynauld, J., Stringer, Y. and P.G.C. Townley, Markets and Prices: A Policy Perspective, Prentice-Hall Canada, 1994, 361p.
Stigler, G.J., “The Theory of Economic Regulation”, Bell Journal of Economics and
Management Science, 2, 1971, 1-21.
Tanguay, G. A. & N. Marceau, “Centralized versus Decentralized Taxation of Mobile Polluting Firms”, Université du Québec à Montréal, Center for Research on Economic Fluctuations and Employment (CREFE), Working Paper No. 122, Oct. 2000.
Appendix 1: Overview of taxes in OECD countries Fuel Other energy products Vehicle tax Agricul-tural inputs Other goods Direct taxation provisions Air transport Water taxes and duties Waste disposal and manage-ment fees Total number of taxes per country Australia 2 1 1 0 2 3 1 3 3 16 Austria 2 2 2 0 0 1 0 0 2 9 Belgium 2 3 2 0 4 2 1 3 2 19 Canada 1 0 2 0 1 1 1 0 1 7 Denmark 4 3 1 0 6 3 0 3 2 22 Finland 5 2 1 0 4 3 0 2 3 20 France 2 3 1 0 0 1 1 2 3 13 Germany 2 1 1 0 0 2 1 3 3 13 Greece 2 1 2 0 0 0 0 0 0 5 Ireland 2 1 2 0 0 0 0 0 1 6 Italy 2 1 1 0 0 0 0 0 1 5 Japan 1 2 1 0 0 1 1 0 0 6 Netherlands 3 2 1 0 0 1 1 4 3 15 New Zealand 2 0 1 0 0 0 0 0 0 3 Norway 5 3 1 1 2 1 2 2 3 20 Portugal 2 0 2 0 0 2 1 2 3 12 Spain 2 1 1 0 0 1 0 1 2 8 Sweden 6 4 2 1 1 1 2 2 1 20 Switzerland 2 1 2 0 1 0 1 3 2 12 United Kingdom 2 1 1 0 0 1 0 2 2 9 United States 1 1 1 0 2 3 1 2 1 12 Source: OECD, 1997b
Appendix 2: Description of variables
Name Description Expected
sign
Source
Public interest*
GDP GDP per inhabitant in US$ adjusted for purchasing power parity
+ OECD
DENSITY Population density + World Bank CD-ROM 1997
SERVICES Tertiary sector in % of GDP - OCDE
CO2-CO2in CO2 emissions from energy use in millions of tonnes; “in” means per inhabitant (per capita)
+ OECD, Environment Compendium 1998
CO2L-CO2inL CO2 emissions with 1-year lag + Idem
Economic theory
LOBBYING Impact of lobbies on government decision-making process (0 –impact- to 100 –no impact -)
+ WCR
TAXES Corporate tax as % of GDP - OECD
VOTE % of votes for green parties + Elections office
in each country
ELECP Price of electricity in US$ / kWh (with purchasing power parity). Annual average.
- Energy Prices and Taxes, International Energy Agency, 1995
DIRCOMP Direct compensation in % of total hourly costs + US Department of Labor
UNEMPLOY-MENT
Unemployment rate - OECD
GREEN Number of Greenpeace members + GP International (NL)
PARTY Political party in power (0 –for Left – to 2 -for Right-)
- Keesing's, A. Blais
* As explained in the text, where opposite signs arose from the estimates, those variables should be considered an integral part of economic theory of regulation.
Appendix 3: Descriptive statistics
NAME Mean Standard
deviation Minimum Maximum
Public interest GDP 16.83 3.753 7.928 25.76 DENSITY 138.5 133.1 2.210 448.9 SERVICES 61.89 5.936 46.00 75.00 CO2 472.0 1037 25.00 5178 CO2L1 468.8 1031 25.25 5128 Economic theory LOBBYING 45.04 9.656 23.00 65.00 VOTE 2.43 3.04 0 10 ELECP 0.062 0.03 0.023 0.171 DIRCOMP 79.86 7.352 67.90 97.50 TAXES 2.523 1.032 0.930 6.900 UNEMPLOYMENT 8.531 4.443 0.500 24.30 GREEN 175.3 291.9 0.000 1845 PARTY 0.927 0.660 0.000 2.000
Liste des publications au CIRANO*
Série Scientifique / Scientific Series (ISSN 1198-8177)
2001s-36 Wealth Distribution, Entrepreneurship and Intertemporal Trade / Sanjay Banerji et Ngo Van Long
2001s-35 Comparaison des politiques de rémunération en fonction des stratégies organisationnelles / Michel Tremblay et Denis Chênevert
2001s-34 Déterminants et efficacité des stratégies de rémunération : Une étude internationale des entreprises à forte intensité technologique / Michel Tremblay, Denis Chênevert et Bruno Sire
2001s-33 La multiplicité des ancres de carrière chez les ingénieurs québécois: impacts sur les cheminements et le succès de carrière / Yvon Martineau, Thierry Wils et Michel Tremblay
2001s-32 The Impact of Interface Quality on Trust in Web Retailers / Marie-Christine Roy, Olivier Dewit et Benoit A. Aubert
2001s-31 R&D and Patents: Which Way Does the Causality Run? / Hans van Ophem, Erik Brouwer, Alfred Kleinknecht and Pierre Mohnen
2001s-30 Contracting under Ex Post Moral Hazard and Non-Commitment / M. Martin Boyer
2001s-29 Project Financing when the Principal Cannot Commit / M. Martin Boyer
2001s-28 Complementarities in Innovation Policy / Pierre Mohnen et Lars-Hendrick Röller 2001s-27 Bankruptcy Cost, Financial Structure and Technological Flexibility Choices /
Marcel Boyer, Armel Jacques et Michel Moreaux
2001s-26 Inflation as a Strategic Response / M. Martin Boyer et Pierre Thomas Léger 2001s-25 Simulation-Based Finite-Sample Tests for Heteroskedasticity and ARCH Effects /
Jean-Marie Dufour, Lynda Khalaf, Jean-Thomas Bernard et Ian Genest 2001s-24 The Role of Organizational Commitment and Citizenship Behaviors in
Understanding Relations between Human Resources Practices and Turnover Intentions of IT Personnel / Guy Paré, Michel Tremblay et Patrick Lalonde 2001s-23 A Resource-Based Analysis of Outsourcing: Evidence from Case Studies / Vital
Roy et Benoit Aubert
2001s-22 Short and Long Memory in Equilibrium Interest Rate Dynamics / Jin-Chuan Duan et Kris Jacobs
2001s-21 Unemployment Insurance and Subsequent Job Duration: Job Matching vs Unobserved Heterogeneity / Christian Belzil
2001s-20 Estimating the Intergenerational Education Correlation from a Dynamic Programming Model / Christian Belzil et Jörgen Hansen
2001s-19 The Bootstrap of the Mean for Dependent Heterogeneous Arrays / Sílvia Gonçalves et Halbert White
* Consultez la liste complète des publications du CIRANO et les publications elles-mêmes sur notre site Internet : http://www.cirano.qc.ca/publication/documents.html