Classification of groundwater samples in wetlands using selforganizing maps
5
0
0
Texte intégral
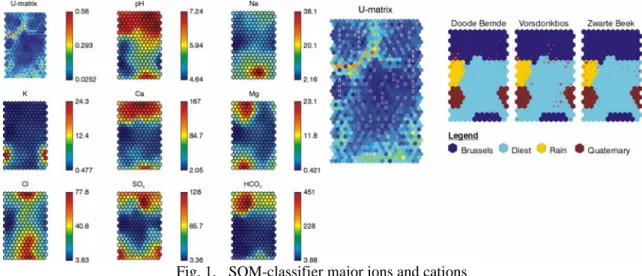
(2) Int. Assoc. for Mathematical Geology XIth International Congress Université de Liège - Belgium. The network architecture consists of an input layer and a layer of nodes, which are fully interconnected. Each of the input vectors is also connected to each of the nodes. The learning process can be divided in six steps (Kohonen, 1995, Kaski, 1997): Step 1: an m x n matrix is created from the dataset with m equal to the number of samples and n equal to the number of variables. The classification of the input vectors is based on a similarity measurement, for instance Euclidean distance. In order to avoid bias in classification due to differences in measuring unit or range of the variables, a normalisation is carried out before the data analysis. Step 2: each unit is randomly assigned an initial weight or reference vector with a length equal to the length of the input vectors (n). Step 3: an input vector is shown to the network and the Euclidean distances between the considered input vector X and the reference vectors Mi are calculated: Step 4: the best matching unit Mc, the node with the greatest similarity with the considered input vector, is chosen. Step 5: the weights of the best matching unit and the unit within its neighbourhood N(t) are adapted so that the new reference vectors lie henceforth closer to the input vector. The learning rate α(t) controls the rate of change of the reference vectors. Step 6: step 3 until 5 are repeated until a predefined maximum number of iterations is reached. During these iterations both α(t) and N(t) decrease, forcing the network to converge. After the training each of the input vectors is assigned to his best matching unit and the grids can be visualized. There are two types of grids commonly used to visualize and analyse the result of the SOM procedure: component planes and the U-matrix (Vesanto et al, 1999). The U-matrix or distance matrix shows the Euclidean distance between neighbouring nodes by means of a colour scale. Component planes are the second visualizing technique. In these maps the component values of the weight vectors are also represented by a colour code and each of these component planes visualizes the distribution of one variable in the dataset.. 3. Description of dataset The regional hydrochemical dataset is obtained from a monitoring network of the Flemish Government, made available through Databank Ondergrond Vlaanderen (DOV, 2006). The dataset consists of 55 wells, each equipped with three well screens at different depths, resulting in a data set of 164 samples. Chemical analyses of rainfall are obtained through the acid deposition monitoring network of the Flemish Environmental Agency (VMM, 2005) in Maasmechelen and Tielt-Winge. The groundwater chemistry monitoring network of the wetlands consists of shallow piezometers and is maintained by the Instituut voor Natuur -en Bosonderzoek (INBO). The datasets of Doode Bemde, Vorsdonkbos and Zwarte Beek consist of respectively 36, 41 and 43 samples.. 4. Results 4.1. Major Anions and Cations The self-organizing map is trained using the data from the regional monitoring network and the composition of rainfall. Only the variables pH, Na, K, Ca, HCO3, Cl and SO4 are used in the training since these parameters are less prone to changes in concentrations due to changes in redox conditions. The resulting SOM is shown in figure 1. The SOM can be divided into four clusters based on the component planes and the geology labelled U-matrix. The first. Liège – September, 3rd - 8th 2006. IAMG06_S10_09.
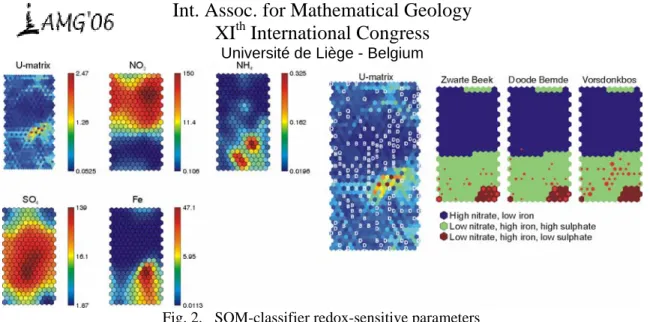
(3) Int. Assoc. for Mathematical Geology XIth International Congress Université de Liège - Belgium. group is formed by the samples of the Diest aquifer and is characterised by low pH, bicarbonate and calcium concentrations. The second group on the other hand, is formed by the samples of the Brussels aquifer and is characterised by higher values for those variables. The group formed by the rainfall samples is has low pH and low concentrations of all variables. The fourth and last group consists of the samples of Quaternary deposits on top of the Diest and Brussels aquifer and shows extremely low pH and high potassium concentrations.. Fig. 1. SOM-classifier major ions and cations. After training and clustering of the SOM, the samples of each of the wetlands are shown to the network. The response of the SOM to the new data is visualized by red dots on the SOM of which the size varies with the amount of samples assigned to the node. The major part of the samples of the Zwarte Beek wetland is classified as comparable to the Diest aquifer. A minority is classified as having a rainfall signature. Almost all samples of the Doode Bemde wetland are assigned to the Brussels aquifer cluster, although a large part plots close to the rainfall group. Only two samples have a distinct rainfall composition. Another two samples appear to have composition comparable to the Diest aquifer group. The Vorsdonkbos samples are more scattered throughout the SOM. The majority of samples is plotted in the Diest cluster, a minority is plotted in the Brussels cluster. The chemical composition of two samples resembles the composition of Quaternary samples and another two samples have a rainfall signature. 4.2. Redox sensitive parameters Similar to the previous classifier, a second classifier is constructed based on the redoxsensitive parameters nitrate, sulphate, iron and ammonia. A SOM is trained with the data from the regional monitoring network and the rainfall data. The resulting SOM is depicted in figure 2. The SOM can be divided into three clusters. The first group is characterised by high nitrate concentrations and low iron concentrations. The second group is characterised by high iron and low nitrate concentrations. A third cluster can be delineated based on the occurrence of a zone with low nitrate, high iron and low sulphate concentrations.. Liège – September, 3rd - 8th 2006. IAMG06_S10_09.
(4) Int. Assoc. for Mathematical Geology XIth International Congress Université de Liège - Belgium. Fig. 2. SOM-classifier redox-sensitive parameters. The geology labelled U-matrix shows that zones of low nitrate and high iron exist in both aquifers, as do zones of high nitrate and low iron. However, if iron is present, concentrations in the Diest aquifer are significantly higher than concentrations in the Brussels aquifer. The samples of the three wetlands almost entirely plot in the low nitrate, high iron field. Only one sample of the Doode Bemde wetland is assigned to group 1. Additionally, a minority of the samples of Doode Bemde and Zwarte Beek is assigned to group 3.. 5. Discussion 5.1. Major Anions and Cations The distinction between the Brussels aquifer and Diest aquifer based on pH-values and the concentrations of calcium and bicarbonate reflects the difference in mineralogical composition of both aquifers. The Diest sands aquifer consists of coarse, glauconiferous sands and sandstones, while the Brussels sands aquifer is a heterogeneous formation consisting of an alteration of highly and poorly calcareous sands, which are locally silicified (Laga et al., 2001). Since the Zwarte Beek wetland is situated in the Diest sands aquifer, it is not surprising that part of the samples have a chemical composition resembling the Diest sands aquifer. It is however striking that there is a large number of samples with a rainfall signature. Samples of the Doode Bemde, which is situated in the Brussels sands aquifer, are classified as similar to the Brussels sands aquifer. Compared to the Zwarte Beek, there are less samples classified as having a rainfall composition. The apparent classification of two samples in the Diest group probably represent a mixture of rainwater and groundwater from the Brussels aquifer, giving it a chemical composition resembling the Diest aquifer. The Vorsdonkbos wetland appears to receive groundwater from both aquifers. A hydrogeological contact between both aquifers is documented in Schiltz et al. (1993). 5.2. Redox sensitive parameters Group 1 in Fig. 2 can be interpreted as the oxic zone in the definition of Berner (1981), while group 2 can be interpreted as the post-oxic zone, with a lower redox potential and the possibility of nitrate reduction. The third group indicates an early stage of the sulphate reduction, with an even lower redox potential. In the regional dataset the occurrence of this sulphate reduction zone is unlikely, since both aquifers are phreatic. This zone probably is the effect of a post-oxic zone in an area with a low sulphate background concentration. Almost all the samples of the wetlands are classified as belonging to the post-oxic zone and are depleted in nitrate, although the wetlands are fed with nitrate rich groundwaters. This is a clear indication of nitrate reduction taking place in the wetlands. While sulphate reduction Liège – September, 3rd - 8th 2006. IAMG06_S10_09.
(5) Int. Assoc. for Mathematical Geology XIth International Congress Université de Liège - Belgium. probably is not present in the regional aquifers, the samples that are plotted in the low nitrate, high iron, low sulphate zone are probably reflecting the local occurrence of sulphate reduction in the wetlands. This is especially the case in the Doode Bemde, which is fed by the Brussels aquifer with relatively high sulphate concentrations.. 6. Conclusions The Self-Organizing Map algorithm proves to be a valuable tool in the classification of groundwater samples. A SOM trained on regional chemical groundwater data, enabled the classification of groundwater samples of three wetlands based major ion composition and on redox sensitive parameters. The Doode Bemde wetland groundwater chemistry is dominated by inflowing groundwater from the Brussels aquifer. The Zwarte Beek wetland is fed by water from the Diest aquifer and has, compared to the Doode Bemde, a higher influence of rainwater. The Vorsdonkbos wetland receives groundwater from both the Brussels and the Diest aquifers and has little influence of rainfall. Classification based on redox-sensitive parameters reveals that post-oxic conditions prevail in the wetlands and there are indications for nitrate reduction and even sulphate reduction. Acknowledgments : The authors wish to thank AMINAL, VMM and INBO for providing data to this research. REFERENCES. Batelaan, O., Asefa, T., Van Rossum, P. & De Smedt, F. 2000. Groundwater flow modelling of three wetland ecosystems in river valleys in Flanders, Belgium. In: European Network of Experimental and Representative Basins (ERB) Conference: Monitoring and Modeling Catchment Quantity and Quality (edited by Verhoest, N. E. C., Van Herpe, Y.J.P., & De Troch, F.P.), Ghent, Belgium, 1-7. Berner, R. A. 1981. A new geochemical classification of sedimentary environments. Journal of Sedimentary Petrology 51(2), 359-365. DOV 2006. Databank Ondergrond Vlaanderen. http:\\dov.vlaanderen.be. Kaski, S. 1997. Data exploration using Self-Organizing Maps. Acta Polytechnica Scandinavica: Mathematics, computing and management in engineering, Series No 82, 57. Kohonen, T. 1995. Self-organizing maps. Springer, Berlin. Laga, P., Louwye, S. & Geets, S. 2001. Paleogene and neogene lithostratigraphic units (Belgium). Geologica Belgica 4(1-2), 135-152. Schiltz, M., Vandenberghe, N. and Gullentops, F., 1993. De geologische kaart van België, Vlaams gewest, Kaartblad (24), Aarschot (Geological map of Belgium: Aarschot)., Geological Survey of Belgium, Brussels. Vesanto, J., Himberg, J., Alhoniemi, E. & Parhankangas, J. 1999. Self-organizing map in Matlab: the SOM Toolbox. In: Matlab DSP Conference, Espoo, Finland, 35-40. VMM. 2005. 'Zure regen' in Vlaanderen, Depositiemeetnet Verzuring 2004 ('Acid rain' in Flanders, Monitoring network acid deposition 2004). Vlaamse Milieumaatschappij, Erembodegem, 28.. Liège – September, 3rd - 8th 2006. IAMG06_S10_09.
(6)
Figure
Documents relatifs
The goal of this section is to highlight and to comment the main descriptive statistics about direct and ultimate ownership of Belgian listed firms. Subsection A details the number
Invariant theory provides more efficient tools, such as Molien generating functions and integrity bases, than basic group theory, that relies on projector techniques for
Figure 7: The “Net Energy Cliff” (figure adapted from Lambert and Lambert, in preparation [3] and Murphy et al. 2010 [71]) As EROI approaches 1:1 the ratio of the energy gained
Stade 2 ou modéré : abolition latéralisée d’un réflexe (H, T) et/ou composante motrice modérée + éventuellement perte axonale sensitive modérée dans un territoire
We explored levels of biodiversity and ecosystem services understanding through 102 face-to-face interviews encompassing the diversity of actors of the sector: • Director (14)
Université de Liège - GeMMe - Génie Minéral, Matériaux & Environnement Université de Liège - GeMMe - Génie Minéral, Matériaux &
La sous-couche a été spécialement conçue pour être mise en œuvre de manière flottante sous l’allura click compact.. S ur support neuf ou rénovation ragréé en respectant
