Characterizing the Eemian-Weichselian transition in northwestern Europe with three multiproxy speleothem archives from two Belgian cave systems (Han-sur-Lesse and Remouchamps).
Stef Vansteenberge1, Sophie Verheyden1, Dominique Genty2, Dominique Blamart2, Steven Goderis1, Stijn
J. M. Van Malderen3, Frank Vanhaecke3, Florent Hodel?, David Gillikin4, Camille Ek5, Yves Quinif6, Hai
Cheng7,8, R. Lawrence Edwards8 and Philippe Claeys1
Corresponding email: stef.vansteenberge@vub.be
1 Analytical, Environmental and Geochemistry, Vrije Universiteit Brussel, Pleinlaan 2, 1050 Brussels,
Belgium.
2Labaratoire des Sciences du Climat et de l’Environnement, 91400 Gif-sur-Yvette, France 3Atomic and Mass Spectrometry Group, Department of Analytical Chemistry, Universiteit Gent,
Krijgslaan 281 S12, 9000 Gent, Belgium.
4Department of Geology, Union College, Schenectady, NY 12308, USA. 5Université de Liège, 4000 Liège, Belgium.
6Centre d’études et de Recherches Appliquées au Karst (CERAK), Faculté Polytechnique de Mons, 7000
Mons, Belgium.
7Institute of Global Environmental Change, Xi’an Jiaotong University, Xi’an, China 8Department of Earth Sciences, University of Minnesota, Minneapolis, USA.
Journal: Quaternary Science Reviews Abstract:
Interglacial to glacial transitions represent the most drastic turnovers in the Quaternary climate system. Yet, millennial-scaled climate variability and stochastic internal variability that result in these transitions remain still poorly understood. Here, three speleothem archives from two different cave systems in Belgium (Han-sur-Lesse and Remouchamps) are investigated using a multiproxy approach in order to characterize the last interglacial to glacial transition. The studied samples roughly span the period between 125 ka and 100 ka, covering a large part of the Eemian and early Weichselian. The speleothems show a high reproducibility for δ13C, which is interpreted as a proxy for past vegetation activity,
controlled by vegetation assembly above the cave. All three speleothems show a drastic increase in δ13C
between 118 to 117 ka, reflecting a rapid change of vegetation assembly from last interglacial temperate tree species towards glacial more open grass vegetation. This event shows a strong affinity in terms of timing and climatic expression with the Late Eemian Aridity Pulse (LEAP) at 118 ± 1 ka, identified in pollen records from Western Germany. Aligning the chronologies of the two independently dated Han-1 2 3 4 5 6 7 8 9 10 11 12 13 14 15 16 17 18 19 20 21 22 23 24 25 26 27 28 29 30 31
sur-Lesse speleothem records enables a more precise absolute chronology and provides an age of 117.7 ± 0.5 ka to the start of this event in the Belgian speleothems. This event marks a distinct transition in the Belgian speleothem proxies between Eemian optimum conditions and increased variability during the glacial inception and the start of this event at 117.7 ± 0.5 ka is therefore proposed as the Eemian-Weichselian transition and consequently the start of the glacial inception in the studied speleothems. High-resolution analysis shows that the 117.7 ± 0.5 ka event is initiated by a cooling pulse followed by a decrease in precipitation. A similar short-lived cooling event is also registered in multiple North-Atlantic sediment archives. This study hypothesizes that the origin of the cooling event at 117.7 ka is an internal climate response caused by the substantial amount of freshwater input from degraded ice-sheets by the end of the Eemian (~120-118 ka). There is thus a clear climatic connection between the Belgian speleothems and other continental European archives and North Atlantic marine archives, providing the possibility of improving less constrained chronologies by alignment to the independently constructed speleothem age-depth model presented in this study.
Introduction
The study of past interglacial periods, in particular those considered to be (at least partially) warmer than present, improves the understanding of the dynamics of the climate system within an anticipated anthropogenic global warming forecasted for this century (Masson-Delmotte et al., 2013). The last interglacial (LIG) experienced global average annual temperatures 1 to 2 °C higher than present (Otto-Bliesner et al., 2013) and a global mean sea-level about 6 to 9 m higher than present (Dutton et al., 2015). The LIG is so far the most intensively studied past interglacial. Using the definition of the Past Interglacials Working Group of PAGES (Berger et al., 2016), interglacial periods are characterized by the absence of Northern Hemisphere continental ice outside Greenland, resulting in a higher eustatic sea-level compared to glacial periods. Based on such eustatic sea-level reconstructions the LIG period occurred between 129 and 116 ka (Dutton and Lambeck, 2012; Govin et al., 2015). Subsequent to the LIG, the glacial inception occurred which is defined as the transition from an interglacial climate state towards colder, glacial climate conditions. However, it is not straightforward to assign absolute boundaries to this complex sequence of events. This paper agrees with the reasoning presented by Berger et al. (2016) that the end of the peak interglacial is considered as the initial stage of the subsequent glaciation, and thus the glacial inception, despite the saw tooth pattern of recent ice age cycles. Additionally, the view advocated by Govin et al. (2015) is followed, i.e. that the glacial inception lasts until the onset of Greenland Stadial 25 (GS-25) at 110.640 ka (GICC05modelext age, Rasmussen et al., 2014).
32 33 34 35 36 37 38 39 40 41 42 43 44 45 46 47 48 49 50 51 52 53 54 55 56 57 58 59 60 61 62
The last interglacial has been identified in numerous types of paleoclimate archives, including ice cores of Greenland (NGRIP members, 2004; Neem Community, 2013) and Antarctica (Jouzel et al., 2007; Capron et al., 2014 and references therein), marine sediment cores (Shackleton, 1969; Shackleton et al., 2003; Sanchez Goñi et al., 1999; Galaasen et al., 2014; Irvali et al., 2016), continental lake cores and/or peat bogs (Woillard, 1978; Tzedakis et al., 2003; Sirocko et al., 2005; Brauer et al., 2007; Helmens, 2014) and in speleothems (Drysdale et al., 2005; 2007; 2009; Meyer et al., 2008; Moseley et al., 2015; Vansteenberge et al., 2016; Regattieri et al., 2016; Demény et al., 2017). As a consequence, definitions of the term ‘last interglacial’ can vary across studies (Kukla et al., 2002; Govin et al., 2015; Otvos et al., 2015). The continental LIG acme, which is the equivalent of Marine Isotope Stage 5e (MIS 5e, Shackleton, 1969), is known as the Eemian. Although the Eemian was originally defined on a highstand sequence in the Netherlands containing warm water mollusks (Otvos, 2015 and references therein), nowadays it is mostly interpreted as an interval of warmer climate associated with the spread of temperate mixed forests in areas covered by similar vegetation today (Woillard, 1978; Sanchez Goñi et al., 1999; Kukla et al., 2002; Tzedakis et al., 2003). The Eemian is a diachronous unit, with longer durations in southern Europe (127 to 109 ka; Müller and Sanchez Goñi, 2007) compared to northern Europe (~126 to 115 ka; Otvos, 2015). In the European continental terminology, the last glacial is defined as the Weichselian. Consequently, the last glacial inception in continental records starts at the Eemian-Weichselian transition (EWT) and lasts until the start of the continental equivalent of GS-25, which is the Mélissy I (Woillard, 1978). Despite the extensive availability of last interglacial datasets, issues remain unsolved, such as the underrepresentation of continental paleoclimate reconstructions (Tzedakis et al., 2015). Also, mechanisms, including millennial-scaled climate variability and stochastic internal variability, that result in interglacial-glacial transitions (and vice-versa) remain still poorly understood (Berger et al., 2016). Govin et al. (2015) recognized the strength of speleothems´ independent U-Th chronology for alignment with other archives such as ice cores, pollen records and marine sediment cores. To resolve the above mentioned questions, a multiple speleothem dataset from northwestern Europe (Belgium) covering the Eemian and early Weichselian, thus including the last glacial inception, is presented in this study. The dataset almost continuously covers the period between ca. 126 and 100 ka. The use of multiple proxies, including growth rate, stable isotopes and trace elements, enables to translate the geochemical signals observed in the samples in terms of paleoclimate changes in northwestern Europe.
1. Background and earlier work
Speleothems have proven to be excellent recorders of regional, past continental climate change (Fairchild et al., 2012). Their strength lies in the ability to construct accurate and independent 63 64 65 66 67 68 69 70 71 72 73 74 75 76 77 78 79 80 81 82 83 84 85 86 87 88 89 90 91 92 93 94 95
chronologies using U-Th radiometric dating combined with speleothem specific age-depth modeling algorithms (e.g. Scholz and Hoffmann, 2011; Breitenbach et al., 2012). Speleothem records from Europe covering the Eemian and early Weichselian have provided detailed paleoclimate reconstructions (Genty et al., 2013). However, the majority of these records are located in the Mediterranean realm or the Alps, leaving large parts of northern Europe undocumented from a speleothem approach. An earlier study by Vansteenberge et al. (2016) has confirmed the potential of a Belgian speleothem and its variations in carbon and oxygen stable isotope ratio proxies (δ13C and δ18O) to reconstruct climate changes over the
Eemian to early Weichselian, expanding towards the northwest the spatial coverage of LIG European speleothem records. This study relied on the speleothem named ‘Han-9’ (Fig. 2), which started growing at ~125.3 ± 0.6 ka and consists of three growth phases. The first hiatus occurs between 117.3 ±0.5 ka and 112.9 ± 0.4 ka and a second hiatus starts at 106.6 ± 0.3 ka. Unfortunately, there is poor age control on the third and last growth phase, roughly lasting from ~103 to ~97 ka. δ13C and δ18O of the deposited
speleothem CaCO3 are presumed to be in equilibrium with the cave drip water. The amount of biogenic
CO2 within the soil above the cave, which depends on the type of vegetation above the cave, was
interpreted to control changes in speleothem δ13C. More depleted speleothem δ13C reflects more active
soils, resulting from a vegetation cover dominated by temperate trees while more enriched speleothem δ13C reflects lower activity due to an increased presence of grass and shrub vegetation types. Speleothem δ18O variations are controlled by a mix of local (e.g. temperature, precipitation) processes and more
regional effects (e.g. ocean source δ18O). Stable isotope time-series revealed that Eemian optimum climate
conditions were present from (at least) 125.3 ± 0.6 ka. Yet, between 117.5 ± 0.5 ka and 117.3 ± 0.5 ka, a severe increase in δ13C (approximately 4 ‰) evidences a rapid change in vegetation assembly above the
cave. This change in vegetation occurs simultaneously as the Late Eemian Aridity Pulse (LEAP), a short-lasting (~0.4 ka) dry event at 118 ± 1 ka described by Sirocko et al. (2005) in the ELSA vegetation record, constructed with pollen records from Eifel maar sediments (Germany). Therefore, the observed changes in Han-9 δ13C are interpreted to represent the same climate event as the LEAP in the ELSA
vegetation record. A similar climatic excursion was described from high-resolution marine records from the North Atlantic: 1) a decrease in North Atlantic Deep Water (NADW) formation at 116.8 ka (Galaassen et al., 2014) and 2) a drop in sea surface temperature with a simultaneous increase in ice rafted debris, suggesting Greenland ice-sheet growth, dated at 117 ka (Irvali et al., 2014; 2016). The presence of these events in the North Atlantic realm suggests a more global signature of this event than previously assumed. In this perspective, Han-9 provided the first independent chronology for the event, i.e. 117.5 ± 0.5 ka, occurring right at the time were the glacial inception is expected in northwestern Europe. Han-9 stopped growing during or shortly after the event making it impossible to place this event within the context of the last glacial inception.
96 97 98 99 100 101 102 103 104 105 106 107 108 109 110 111 112 113 114 115 116 117 118 119 120 121 122 123 124 125 126 127 128 129
This study expands the last interglacial to early glacial Belgian speleothem dataset (Han-9) with two additional speleothem records, one from the same cave and another from a second cave ~20 km away. This additional dataset allows to test whether the observed changes in the Han-9 proxies are reproducible in other speleothems on a regional scale and thus induced by regional paleoclimate changes. Additionally, implementing a sample of a completely other deposition dynamics (massive speleothem vs candle-shaped speleothem) from a second Belgian cave system (Remouchamps Cave) allows exclusion of any cave specific effects altering the regional paleoclimate signal. These two new speleothem samples are investigated through a multiproxy approach, using not only traditional stable isotope ratio time-series (δ13C and δ18O) but also trace element time-series of magnesium (Mg), strontium (Sr), barium (Ba), zinc
(Zn), uranium (U), phosphorous (P), iron (Fe) and lead (Pb). By doing so, this study aims firstly to improve the chronology regarding the timing and duration of the 117.5 ± 0.5 ka event and secondly to better understand the relation of this climate event to the Eemian-Weichselian transition (EWT) and the last glacial inception.
2. Study sites and speleothem samples
This study combines the results of three speleothem samples from two different cave systems (Han-sur-Lesse Cave system, n = 2, and Remouchamps Cave, n = 1) in Belgium. Both caves are located within the Calestienne, a SW-NE trending superficial limestone belt of Middle Devonian age (Fig. 1C). After deposition, these Paleozoic sediments underwent Hercynian folding followed by erosion in the Mesozoic. The current hydrographic network was established from the Neogene to Pleistocene, by erosion into these folded belts (Quinif, 2006). The caves are located ca. 200 km inland at an elevation of 200 m above sea level for Han-sur-Lesse Cave system and 150-200 m above sea level for Remouchamps Cave, respectively. Following the Köppen-Geiger classification (Peel et al., 2007), the climate in southern Belgium is maritime with cool summers and mild winters. For the period 1999-2013, average year-temperature was 10.2 °C and average yearly rainfall amount 820 mm yr-1. This rainfall is spread over the
entire year with no distinct seasonal distribution (Royal Meteorological Institute, RMI). 2.1 Han-sur-Lesse Cave system
To complement the work of Vansteenberge et al. (2016), one additional stalagmite sample was retrieved from Han-sur-Lesse Cave: Han-8. The Han-sur-Lesse Cave system (Fig. 1B) is the largest known subterranean karst network in Belgium, with a total length of ~10 km. The cave system was formed by a meander cutoff of the Lesse River within the Massif de Boine, which is part of an anticline structure consisting out of Middle to Late Givetian reefal limestones. The thickness of the epikarst zone above the cave system is estimated to be around 40-70 m (Quinif, 2006). The area above the cave consists 130 131 132 133 134 135 136 137 138 139 140 141 142 143 144 145 146 147 148 149 150 151 152 153 154 155 156 157 158 159 160 161
out of C3 type vegetation with mainly temperate Corylus, Fagus and Quercus trees. As a natural reserve it has been protected from direct human influence for over 50 years (Timperman, 1989). The Lesse River enters the cave system at the Gouffre de Belvaux and exits at the Trou de Han approximately 24 hours later (Bonniver, 2010). Similar to Han-9, Han-8 was retrieved from the Southern Network, which is the most distal part of the cave system (Fig. 1B). Both stalagmites are candle shaped, with a length of 178 and 675 mm, respectively (Fig. 2). The Han-sur-Lesse Cave system is partly exploited as a show cave, but the Southern Network is not accessible for tourists. The sur-Lesse Cave system consists of the Han-sur Lesse Cave and the Père Noël Cave and both have been intensively studied in the last three decades, making it the best understood cave system in Belgium. This includes speleothem dating and pollen analysis (Quinif and Bastin, 1994; Quinif, 2006), detailed hydrographic studies (Bonniver et al., 2010) and extended cave monitoring surveys (Genty and Deflandre, 1998; Verheyden et al., 2008; Van Rampelbergh et al., 2014), leading to successful paleoclimate reconstructions on Holocene speleothems down to seasonal scale (Verheyden et al., 2000; 2006; 2012; 2014; Van Rampelbergh et al., 2015, Allan et al. 2015).
3.2 Remouchamps Cave
An additional stalagmite core sample, RSM-17 (Fig. 2), was retrieved from Remouchamps Cave in 2012. This cave is located ~100 km southeast of Brussels, on the eastern bank of the Amblève River (Fig. 1D). The elongated cave is formed along inverse faults within biostrome limestone deposits of Middle Frasnian age (Ek, 1970; Coen, 1970). The cave consists of an upper (Fig. 1D in black) and a lower level (Fig. 1D in grey) and has a total length of ~3.9 km. The subterranean river Rubicon flows through the lower level of the cave. The area above the cave consists of similar C3 type deciduous forest vegetation as Han-sur-Lesse Cave. RSM-17 stalagmite is an approximately 3 m large, fallen and broken stalagmite located within the Salle des Ruines. RSM-17 was among the first speleothems in Belgium to be dated using U-Th (Gewelt, 1985). In this study, RSM-17 is represented by 2 cores that were taken from the speleothem (Fig. 2). Core 1 was drilled from the base of the speleothem towards the top and is 1303 mm long. However, the upper part of core 1 (starting at 371 mm dft) missed the speleothem’s central growth axis therefore a second core was taken from the top of the speleothem towards the bottom. The 2 cores were aligned based on the presence of a distinct, dense and brown layer, as shown by the black line in Fig. 2.
3. Methods
4.1 U-Th dating and age-depth modeling 162 163 164 165 166 167 168 169 170 171 172 173 174 175 176 177 178 179 180 181 182 183 184 185 186 187 188 189 190 191 192
To construct robust age-depth models, 35 samples are taken along the three speleothems’ growth axis for radiometric dating (see Fig. 2 for locations). This includes 13 samples of Han-8 and 17 samples of RSM-17. Five additional samples (marked in green on Fig. 2) are taken from Han-9 to improve the existing age-depth model, which was originally constructed with 23 dates (Vansteenberge et al., 2016). All ages are acquired by U-Th dating at the University of Minnesota Earth Sciences Department (Minneapolis, USA). For all U-Th analyses, 150-300 mg of speleothem calcite is milled and analyzed with a Neptune multiple-collector plasma source mass spectrometer (MC-ICP-MS, Thermo-Fisher Scientific, Bremen, Germany). Ages are corrected assuming an initial 230Th/232Th atomic ratio of 4.4 ±2.2
× 10-6. The age datum is 1950 CE. For additional information about the applied method, see Edwards et al. (1987), Shen et al. (2012) and Cheng et al. (2013) and references therein. Age-depth modeling is done using the StalAge algorithm (Scholz and Hoffmann, 2011; Scholz et al., 2012) in R (R Core Team, 2013). Depths are expressed as distance from top (dft) in mm. The outcome of the StalAge algorithm is a final age-depth model that is the median of the simulated fits with a 2σ error, which is calculated through the distribution of the simulated fits (Scholz and Hoffmann, 2011). One of the key advantages of the StalAge algorithm is that it does not have any adjustable parameters, enabling a high-degree of reproducibility. The only choice a user can make is whether outlier dates should be disregarded in the modeling process or if their corresponding errors should be increased in order to fit the model. A disadvantage, however, is that the model does not handle substantial changes in growth rate in the boundary areas of the speleothem, i.e. top and base, very well (Scholz and Hoffmann, 2011). The resulting age-depth model is then used to calculate corresponding growth rates, expressed in mm ka-1. Additionally, the chronology is
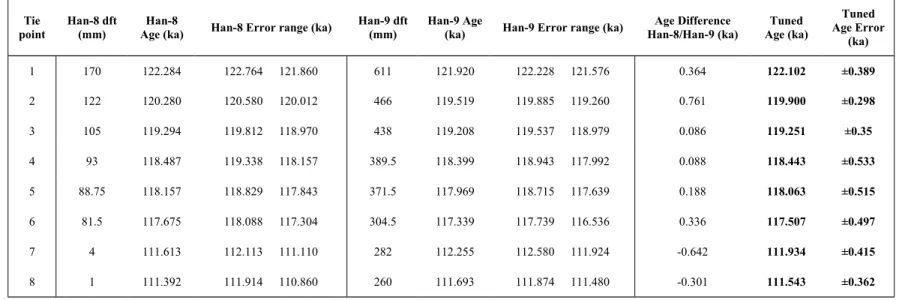
further improved by aligning the independent Han-8 and Han-9 age-depth models to each other by selecting specific corresponding tie points in both speleothems’ δ13C time-series.
4.2 Stable isotope ratio (δ13C and δ18O) analysis
Speleothem subsamples for stable isotope ratio (δ13C and δ18O) analysis are drilled along the
speleothems’ growth axis (Fig. 2) using a MicroMill (Merchantek, Electro Scientific Industries Inc., Portland, USA), which is a computer steered drill mounted on a Leica GZ6 microscope (Leica Microsystems GmbH, Wetzlar, Germany). The MicroMill system is equipped with tungsten carbide dental drill bits 300 or 1000 µm in diameter (Komet Dental, Lemgo, Germany). Samples were stored at 50°C prior to analysis to avoid contamination. Sample locations are indicated in Fig. 2 and spatial resolution varies as a function of the speleothems growth rate between 5 mm (RSM-17) and 250 µm (Han-8). For RSM-17 (n= 266) and the high-resolution part of Han-8 (65-89.5 mm dft, n = 63, Fig. 2), δ13C and δ18O measurements are done at the Stable Isotope Laboratory, Vrije Universiteit Brussel
(Brussels, Belgium) using a Perspective isotopic ratio mass spectrometer (IRMS) coupled to a Nucarb 193 194 195 196 197 198 199 200 201 202 203 204 205 206 207 208 209 210 211 212 213 214 215 216 217 218 219 220 221 222 223 224 225
automated carbonate preparation system (Nu Instruments, Wrexham, UK). The Nu Instruments setup makes use of an in-house standard MAR-2(2), made from Marbella limestone and which is calibrated against the international standard NBS-19 (Friedman et al., 1982). Reported values for the MAR-2(2) standard are 3.41 ‰ Vienna Pee Dee Belemnite (VPDB) for δ13C and 0.13 ‰ VPDB for δ18O. Averages
of the total 2σ uncertainties for δ13C and δ18O are 0.03 ‰ and 0.08 ‰ for the Nu Perspective setup. Other
Han-8 stable isotope ratios (n = 162) are measured on a VG Optima dual-inlet IRMS (Thermo-Fisher Scientific, Bremen, Germany) at the Laboratoire des Sciences du Climat et de l’Environnement (Gif sur Yvette, France). NBS-19 was used as a reference material (Friedman et al., 1982). Analytical errors are 0.05 ‰ and 0.08 ‰ for δ13C and δ18O, respectively. At regular intervals, a replicate sample was measured
in a different batch to check for the reproducibility of the analytical method. 3.1 Trace elements
Two methods for speleothem trace element analysis are applied in this study. The Han-8 trace element record (Fig. 2), consisting of Mg, Al, P, Zn, Sr, Ba, Pb, and U, is constructed using laser ablation inductively coupled plasma mass spectrometry (LA-ICP-MS) at the Royal Africa Museum (Tervuren, Belgium). A Fisons-VG frequency quadrupled Nd-213 YAG laser (λ = 266 nm) coupled to a Fisons-VG 214 PlasmaQuad II+ mass spectrometer is used. Data are calibrated using both the NIST 610 (Pearce et al., 1997) and the USGS MACS1. Calibration (including blank subtraction and drift correction) is performed offline by using Ca as internal reference. Details of LA-ICP-MS operating conditions can be found in Lazareth et al. (2003). A total of 3702 data points are collected on Han-8 speleothem with an average spatial resolution of ~40 µm. Errors are calculated using the relative standard deviation (RSD) of NIST 610.
Trace elements for RSM-17 were only collected on a specific 76.56 mm long transect that covers the Eemian-Weichselian transition, i.e. between 596 and 518 mm dft (Fig. 2). RSM-17 trace element concentrations are determined using inductively coupled plasma mass spectrometry complemented by a ICP-MS at the Atomic and Mass Spectrometry Group, Ghent University (Ghent, Belgium). The LA-ICP-MS setup consists of a 193 nm ArF*excimer Analyte G2 laser ablation system (Teledyne Photon Machines, Bozeman, MT, USA) coupled to a single-collector sector field Element XR ICP-MS unit (Thermo Fisher Scientific, Bremen, Germany). The laser is used to sample adjacent positions along a line segment parallel to the stalagmite’s growth axis. The positions are ablated one-by-one for 15 s with a laser spot size 110 μm in diameter. A total of 696 positions are sampled. Sampling via individual drilling points is preferred here over the conventional approach of continuous line scanning because the single 226 227 228 229 230 231 232 233 234 235 236 237 238 239 240 241 242 243 244 245 246 247 248 249 250 251 252 253 254 255 256
positions can be sampled longer, resulting in an improved limit of detection for low concentration elements, for example Y.
4. Results
The results of U-Th dating are presented in Table 1. Errors represent a 2σ uncertainty. The speleothem samples from both cave sites have a comparable 238U content, with an average of 284 ng g-1 (SD = 105 ng
g-1) for the Han-sur-Lesse samples and 250 ng g-1 (SD = 97 ng g-1) for the Remouchamps samples. In
general, detrital Th contamination is low, with average 230Th/232Th atomic ratios of 11732 × 10-6 and 4217
× 10-6 for Han-sur-Lesse speleothems and RSM-17, respectively. The resulting ages are plotted in Fig. 3,
with previously published ages of Han-9 (Vansteenberge et al., 2016) marked in red. The new date obtained at the end of the first Han-9 growth phase, date 1, is consistent with the previously obtained age model. For growth phase 2, date 2 is not in stratigraphic agreement with earlier obtained ages. In the third growth phase, date 4 and 5 appear to be more consistent with the earlier obtained older dates, i.e. the batch that was dated in 2013 (Vansteenberge et al., 2016), instead of the younger ages (the batch that was dated in 2015, marked with an * in Table 1). For Han-8, all determined ages are stratigraphically consistent, i.e. no age inversions occur. Errors range between 0.5 ka (~0.4 %) and 0.368 ka (~0.3 %). In contrast to the stratigraphically consistent data of Han-8, the age-depth plot of RSM-17 shows increased scattering from date 3 to 10 (i.e. between 1100 and 670 mm dft, Fig. 3). Yet, the 238U content and 230Th/232Th atomic ratios are not significantly different from the other dates (Table 1).
Figure 5 shows the results of the stable isotope and trace element analysis of Han-8 and RSM-17 together with previously obtained δ13C and δ18O of Han-9 (Vansteenberge et al., 2016). δ13C values of
RSM-17 are the most negative of all three speleothem δ13C records with an average of -10.92 ‰ and a
standard deviation of 0.70 ‰. Han-8 δ13C varies between -3.45 and -7.58 ‰ with an average of -5.87 ‰
and a standard deviation of 1.16 ‰. Starting from the base of the speleothem (~122 ka) up until ~117.7 ka, δ13C varies roughly between -6 and -7.5 ‰, except for a positive excursion to -4.98 ‰ at 121.5 ka.
The amplitude of δ13C variations after 117.7 ka, which is about 4 ‰, is much larger compared to the
bottom part of the stalagmite. Compared to δ13C, the range of δ18O fluctuations in RSM-17 and Han-8 is
smaller. The δ18O signal of RSM-17 has an average of -5.00 ‰ and a standard deviation 0.41 ‰. Han-8
δ18O values fluctuate between -4.92 and -6.72 ‰, with an average and standard deviation of -5.81 ‰ and
0.35 ‰, respectively. 8 Mg, Sr, Ba and U trace element concentrations show a similar trend as Han-8 δ18O, with little variation between 122 and 115 ka (except for an excursion around 117.7 - 117 ka) and
lowest values from 115 to 112 ka. This trend is opposite for P, with highest concentrations between 115 and 112 ka. 257 258 259 260 261 262 263 264 265 266 267 268 269 270 271 272 273 274 275 276 277 278 279 280 281 282 283 284 285 286 287 288
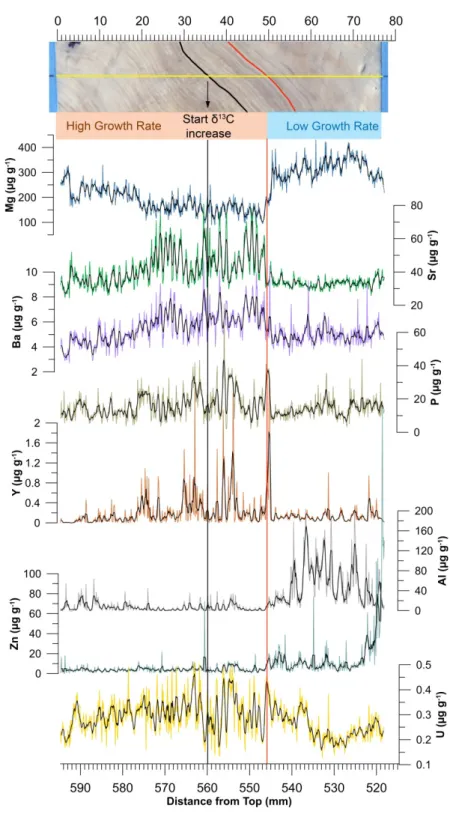
Trace element distance series of RSM-17 are shown in Fig. 7. Thick layers, consisting of alternations between dense, dark calcite and white, porous calcite occur before 545 mm dft. After 545 mm, layers are significantly thinner. All elements display sinusoidal variations corresponding with the visible layering. Magnesium concentrations are higher after 545 mm dft and Sr and Ba variations are in antiphase with Mg and show a decrease after 545 mm dft. U behaves in a similar way as Sr and Ba, although the transition between higher and lower concentrations at 545 mm dft is more gradual. Aluminum and Zn have higher concentrations after 545 mm dft similar to Sr, Ba and U. Concentrations of P and Y are higher before 545 mm dft.
5. Discussion
5.1 Age-depth models
The age-depth models for the two new speleothems (Han-8 and RSM-17) and the improved model of Han-9 are shown in Fig. 3. The studied samples roughly span the period between 125 ka and 100 ka, with all three speleothems covering 121 ka to 117.5 ka and 113 ka to 111 ka. Although Han-9 and Han-8 were located just 0.5 m apart, their age-depth models are substantially different from each other. More specific, Han-9 starts growing about 4 ka before Han-8 and shows much larger variations in growth rate, with two hiatuses occurring. The basal age of the RSM-17 core is 120 ka, however the base of the stalagmite was not sampled.
Han-9
The additional Han-9 ages provide the ability to improve the existing age-depth model. Han-9 displays intermittent growth with 3 growth phases (GP’s) separated by two hiatuses (Fig. 3). GP 1 starts at 125.3 ± 0.6 ka with stable growth rate of 20 mm ka-1. After 121 ka, growth rate significantly increases
to 150 mm ka-1. Date 1 (Table 1, Fig. 3) confirms the high growth rate at the end of GP 1 from 121 ka to
117.3 ka. A first hiatus starts at 117.3 +0.4/-0.8 ka. Compared to the earlier model by Vansteenberge et al. (2016), date 1 reduces the error of the age-depth model on the start of the first hiatus, i.e. from 117.3 +0.7/-1 ka to 117.3 +0.4/-0.8 ka. The hiatus lasts 4.5 +0.8/-1.2 ka and at 112.8 ±0.4 ka the second growth phase starts. During this GP, growth rate remains at a constant pace of 40 mm ka-1 until approximately
110.5 ka, where it decreases to 6 mm ka-1. Date 2 is considered as an outlier and was disregarded during
the modeling algorithm. Date 3, taken at the end of the second growth phase, confirms the earlier hypothesis of severely decreased growth rate between ~110 and ~106 ka (Vansteenberge et al., 2016). At 106.2 ±0.5 ka, GP2 ends. The second hiatus lasts until 103.8 +0.6/-0.5 ka. The ages of GP 3 provided by Vansteenberge et al. (2016) contain several age inversions. The model presented here, with GP 3 between 289 290 291 292 293 294 295 296 297 299 300 301 302 303 304 305 306 307 308 309 310 311 312 313 314 315 316 317 318 319 320
103.8 +0.6/-0.5 ka and 99.7 ±0.3 ka is based on the newly added dates in this study (date 4 and date 5). Four dates were considered as outliers and were not taken into account to construct the age model (Fig. 3). The model now displays a slow growth at the start of GP3 at 103.8 ±0.5 ka, followed by an increase in growth rate at ~100.8 ka. Given this age-depth model, stable isotopes were analyzed with a temporal resolution between 100 and 0.3 years, and an average of 16 years.
Han-8
All Han-8 dates are stratigraphically consistent, making the age-depth model robust and straightforward. Han-8 starts growing at 122.6 +0.6/-0.5 ka. Throughout its growth, a more or less constant growth rate of ~20 mm ka-1 is maintained. A discontinuity in the speleothem, at 81.5 mm dft
(Fig. 2), appears to represent a short hiatus that starts at 117.7 ±0.4 ka and ends at 117.0 ±0.3 ka. However, the duration of this hiatus is only slightly longer than the error of the age model. Han-8 stops growing at 111.9 ±0.5 ka.
RSM-17
The U-Th ages of RSM-17 show scatter between 1100 and 670 mm dft, with several age inversions. Yet, this scatter is believed to be caused by extreme high growth rates, up to 240 mm ka-1, which is
reflected in the presence of layers up to 1 mm thick. The layers are assumed to be annual since 1) the similarity of the dark-light layer couplets to those of actively growing annually layered speleothems (Verheyden et al 2006; Van Rampelbergh et al., 2014; 2015) in Han-sur-Lesse cave and 2) the sinusoidal variations of trace element proxies in one dark-light layer couplet which are similar to those observed in actively growing annually layered stalagmites (Fig. 7). Counting of these layers in between U-Th dates could not confirm nor did it reject the hypothesis of the annual nature of these layers. To construct the RSM-17 age-depth model shown in Fig. 3, date 4 and date 9 were considered as major outliers and removed during the StalAge age-depth modeling process. The final model shows that the bottom of the RSM-17 core is 120.0 ±0.4 ka old. High growth rates (>200 mm ka-1) are maintained until ~116.5 ka,
with the exception of short decrease at ~118 ka. From 115 ka, growth rate lowers to 100 -120 mm ka-1
which is maintained throughout the upper part of the core, dated at 112.7 +0.8/-0.9 ka. 5.2 Alignment of Han-9 and Han-8 age-depth models
To construct an even more precise chronology for the Eemian Weichselian transition and other climatic events during the last glacial inception, Han-8 and the adjusted Han-9 age-depth models are aligned to each other based on their δ13C record. Conventionally, in alignment strategies, one record is
aligned to another reference record of which the chronology is well-established based on simultaneous 321 322 323 324 325 326 327 328 329 330 331 332 333 334 335 336 337 338 339 340 341 342 343 344 345 346 347 348 349 350 351
changes in a climate variable or proxy (Govin et al., 2015). In this case, both Han-8 and Han-9 have an independently constructed chronology. Therefore, it would be incorrect to select one sample as the reference record by assuming that this sample has the correct depth model. To avoid this, both age-depth models are aligned to each other and the average of both models is calculated, with both age-age-depth models contributing equally to the resulting model. The proxy used for aligning both records is δ13C.
Variations in Han-9 δ13C are interpreted to reflect changes in vegetation activity above the cave, resulting
from changes in the type of vegetation cover (Vansteenberge et al., 2016). Changes in vegetation activity should therefore results in a similar Han-8 δ13C record, but only if there is no overprint of kinetic
fractionation. Checking for kinetic fractionation by applying Hendy Tests (Hendy, 1971) is not feasible since individual layers cannot be identified due to the low growth rates of both stalagmites. However, the striking similarity between both Han 8 and 9 13C isotopic profiles, even in terms of absolute values (Fig.
4), is a strong argument for the absence of important kinetic effects that could have overprinted the vegetation signal. This Replication Test to evaluate the likelihood of calcite deposition under isotopic equilibrium is proposed by Dorale and Liu (2009) as a better alternative for the Hendy Test. Alignment of both records is carried out by arbitrarily selecting eight tie-points between 123 and 111 ka, as shown in Fig. 4, that are interpreted to represent a similar point in time. Next, the ages of these points are extracted from each of the two age-depth models and the average age is calculated (Table 2), after which a new age-depth model is constructed for both speleothems based on these average ages. The 2σ uncertainty of the new age-depth model is calculated with the average of the upper and lower 2σ values of the original age-depth models. Also, as shown in Table 2, the newly calculated age-depth model lies within the age uncertainty of the original Han-8 and Han-9 age-depth models. For example, the start of the first hiatus in Han-9 and the small hiatus in Han-8 occur at 117.3 +0.4/-0.8 ka and 117.7 ± 0.4 ka, respectively. In the new aligned age-depth model, the start of both hiatuses is interpreted to occur at the same time, which is 117.5 ± 0.5 ka. Other proxy time-series, such as δ18O and trace elements, are then constructed using this
aligned age-depth model. The δ13C record of RSM-17 was not included in the alignment because of the
higher uncertainties in the age-depth model. 5.3 Eemian acme between 125.3-117.5 ka
The terminology proposed by Govin et al. (2015) is followed in this study, i.e. the term ‘acme’ is used to represent the interval of peak values in climate or environmental record that is contained within the LIG. All three speleothems show the presence of Eemian δ13C acme conditions between 125.5 and 117.5 ka.
This is indicated by the low δ13C, suggesting vegetation similar to that of today, i.e. dominated by
temperate tree species, which reflects warm and moist conditions. The start of Han-9 speleothem growth 352 353 354 355 356 357 358 359 360 361 362 363 364 365 366 367 368 369 370 371 372 373 374 375 376 377 378 379 380 381 382 383
is interpreted to reflect the presence of relatively wetter conditions between 125 and 124 ka (Vansteenberge et al., 2016), as earlier identified in speleothems from southwest France (Couchoud et al., 2009) and central Europe (Demény et al., 2017). Yet, the ELSA vegetation record (Eifel, Germany, Sirocko et al., 2005) and speleothems from Corchia Cave (Italy, Drysdale et al., 2005) suggest the presence of warm and moist last interglacial conditions before Han-9 starts growing at 125.3 ka. Which is consistent with the very low Han-9 δ13C of ~9 ‰ at 125.3 ka. So far, Han-9 is the oldest known Last
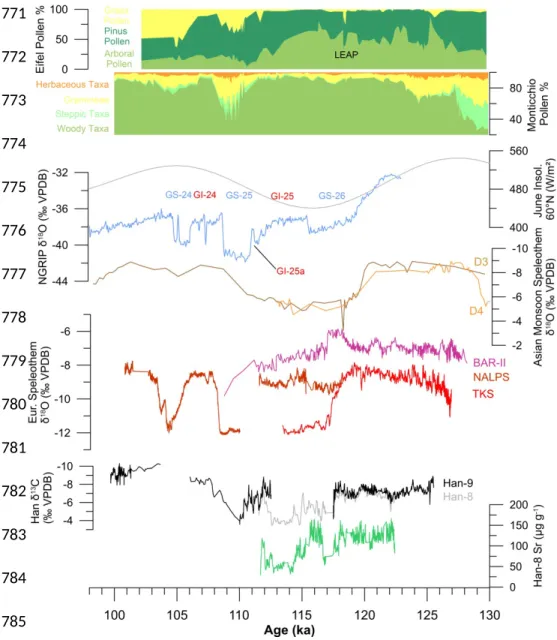
Interglacial speleothem formation from Han-sur-Lesse and other caves in Belgium. Although older LIG speleothems could be present (but have not been identified yet) it is hypothesized that an effective precipitation increase at 125.5 was necessary besides the already present LIG acme to initiate speleothem formation. This short period of wetter conditions, that initiated Han-9 growth, likely follows as what can be described as a ‘mid-Eemian climate depression’, i.e. a short duration of colder and dryer conditions occurring around 126-125 ka, which is reflected in European pollen records. For example, vegetation reconstructions based on pollen from Lago Grande di Monticcino (Italy) indicate a drop in Quercus pollen and a simultaneous increase in Graminae pollen at ~125 ka, (Brauer et al., 2007), interpreted a short dry interval. In addition, sediment archives from the North Atlantic (NEAP-18K: Chapman and Shackleton, 1999; ODP-980: Oppo et al., 2006; U1304: Hodell et al., 2009; MD03-2664: Galaasen et al., 2014; Irvali et al., 2016) and the Norwegian Sea (Fronval et al., 1998) also showed the presence of a mid-Eemian cooling. Global sea-level reconstructions even suggest the occurrence of a small regression at ~125 ka (Hearty et al., 2007, Fig. 8). In the Eifel (Germany), a decrease in Pinus and Betula pollen and an increase in temperate tree pollen, e.g. Quercus and Carpinus, follows a short spike in grass pollen abundance at 125 ka (Fig. 8). This indicates a transition to warm and wetter conditions during the second part of the Eemian, starting at ~124 ka. At 122.1 ka, an increase in δ13C of +1.5 ‰ in Han-8 and +1.2 ‰
in Han-9, respectively, occurs. This increase could potentially be correlated to an observed cold event at 122.3 ka in the Norwegian Sea, expressed by near-glacial ocean surface summer temperatures (Bauch et al., 2011). Additionally, Zhuravleva et al. (2017) identified an intermittent sea surface cooling in the Arctic region triggered by a meltwater release at ~122 ka. Overall, the observations from the Han-sur-Lesse speleothems confirms earlier hypothesis that question the general view of stable Eemian optimum conditions between 128 and 117 ka (Bauch et al., 2011; Irvali et al., 2012; Capron et al., 2014; Galaasen et al., 2014; Pol et al., 2014). Also, the Belgian speleothems presented in this study reflect that conditions for speleothem growth were better after 125 ka.
5.4 Glacial inception and Eemian-Weichselian transition: a climatic event at 117.7 ka 5.4.1 Chronological constraints 384 385 386 387 388 389 390 391 392 393 394 395 396 397 398 399 400 401 402 403 404 405 406 407 408 409 410 411 412 413 414 415
The Han-8 and Han-9 tuned age-depth models allow a detailed investigation of the timing and rate of the Eemian-Weichselian Transition. The EWT in Han-9 was originally identified as the transition from forest vegetation to a more grass and shrub like vegetation, causing a decrease in vegetation derived soil CO2 which is reflected in the carbon isotopic record. This transition was linked to the Late Eemian
Aridity Pulse, recognized in the Eifel pollen records located only 150 km from the cave site (Sirocko et al., 2005). Based on the tuned age-depth model, the δ13C increase in Han-9 and Han-8 starts at 117.7 ± 0.5
ka. In RSM-17, a δ13C excursion with similar magnitude occurs at 118.1 +0.4/-0.3 ka. Despite a small
offset in timing (Fig. 3), although an overlap in the 2σ error of both ages is present, the δ13C excursion in
RSM-17 is considered to represent the same event as the δ13C excursion in the Han-sur-Lesse speleothem
records. Because of the higher precision of the Han-8 and Han-9 age-depth models, the age of 117.7 ± 0.5 ka is adapted for the onset of this event. Although the increase in δ13C is not entirely monotonic in both
Han-sur-Lesse records, a total increase of ~4‰ is accommodated in about 0.2 ka, before the start of the discontinuity in both records at 117.5 ± 0.5 ka. Due to the occurrence of growth interruptions in the Han-sur-Lesse speleothems, it is difficult to establish the duration of the event. Yet varve counting on the nearby ELSA record (Eifel, Germany) has provided a duration of 468 varve years for the LEAP (Sirocko et al., 2005).
5.4.2 Paleoclimate changes during the glacial inception
The newly added records of Han-8 and RSM-17 allow to investigate the paleoclimate changes during the glacial inception. Looking at Han-8 δ13C, the increase in centennial, large-amplitude variability after
the onset of the event at 117.7 ± 0.5 ka is striking (Fig. 5). This is in clear contrast with more stable δ13C
values before 117.7 ka. In Han-8, these variations in δ13C briefly return to pre-117.7 ka values -6.8 ‰ at
115.1 ka and 111.9 ka. In the RSM-17, similar observations are made with a larger variability before 118.1 +0.4/-0.3 ka. The increase in δ13C variability is interpreted to reflect increased degradation of soil
activity, caused instability of the vegetation assembly above the cave, rapidly switching between a dense tree cover and more open grass and shrub vegetation. Since the Eemian in northwestern Europe is defined as a warmer climate interval associated with the spread of temperate mixed forests in areas with similar vegetation today (Kukla et al., 2002) and because of the distinct difference in δ13C isotopic signature
before and after 117.7 ka in all three investigated speleothem samples, the end of the Eemian, and thus the Eemian-Weichselian transition in these records is set at 117.7 ± 0.5 ka. Although short-lasting episodes of forest recovery occur after 117.5 ka, e.g. at 115.1 and 111.9 ka (Fig. 5), millennial scale stable conditions similar to that observed during the Eemian optimum (~125-118 ka) are not observed anymore. 416 417 418 419 420 421 422 423 424 425 426 427 428 429 430 431 432 433 434 435 436 437 438 439 440 441 442 443 444 445 446
Consequently, the onset of the glacial inception in the Belgian speleothem record, following the EWT, is set at 117.7 ± 0.5 ka.
The high-resolution records of RSM-17 provide additional insights in the paleoclimate changes occurring at the EWT. Figure 6 show the changes in δ13C and Figure 7 shows the changes in trace element
concentrations. Figure 6 and 7 are plotted on a distance axis because of the higher uncertainty in the RSM-17 age-depth model. Yet, the Han-sur-Lesse chronology has shown that the start of the δ13C
excursion, and thereby the EWT, can be set at 117.7 ± 0.5 ka. In RSM-17, this δ13C increase starts at
561.5 mm dft. At 561.5 mm dft, the speleothem morphology is still similar to that observed during the Eemian optimum, i.e. thick layers consisting of an alternation between white porous calcite and brown, dense calcite (Fig. 2 and Fig. 6). This is in contrast with the internal speleothem morphology of RSM-17 that is observed after 545 mm dft, consisting of white porous calcite containing only very thin laminae (Fig. 6). This severe reduction in layer thickness evidences a decrease in growth rate of RSM-17 at that time. The increase in δ13C, from -12.5 to -8 ‰, starts at 561.5 mm dft. However, it is not until 545 mm dft
mm that the morphology of the speleothem suddenly changes (Fig. 6). Taking into account that the layers are annual (see section 6.1), layer counting indicates that speleothem morphology changes at least 18 years after the start of the δ13C increase (Fig. 6), implying that vegetation started changing before a
decrease in speleothem growth rate took place. This has important consequences for the paleoclimatology of the late event starting at 117.7 0.5 ka. The term ‘late Eemian aridity pulse’, which is the equivalent of this event in the Eifel region (Germany), refers to a dry event, yet it was interpreted as ‘an event with dust storms, aridity, bushfire and a decline in thermophilous trees by a decrease in both precipitation and temperature’ (Sirocko et al., 2005). In case of RSM-17, the lead of the vegetation switch, shown by the increase in δ13C, on the change speleothem in morphology and thus growth rate suggests that the event is
initiated by a drop in temperature rather than a drop in precipitation amount. If a decrease in precipitation initiated the event, the δ13C and the growth rate would change at the same time. Following an initial cold
pulse, vegetation changes from a tree-dominated assembly towards a grass/shrub dominated assembly. Due to this change in biomass, vegetation-derived CO2 in the soil, originating from root respiration and
degrading soil organic matter, lowers. This in turn lowers the dissolved CO2 in the waters infiltrating the
epikarst. The CO2 decrease renders the infiltrating waters les acidic and diminishes the potential of
limestone dissolution, eventually leading to a decreased Ca2+ content of the drip water resulting in a
decreased growth rate. This is also reflected in the Han-8 and Han-9 speleothems: the hiatus only starts at 117.5 ± 0.5, which is 0.2 ka after the decrease in δ13C. Further evidence supporting the hypothesis that the
event is initiated by a cold pulse and that decreased precipitation lags this cold pulse is provided by trace element variations in RSM-17 (Fig. 7). Right at the point where the RSM-17 morphology changes from 447 448 449 450 451 452 453 454 455 456 457 458 459 460 461 462 463 464 465 466 467 468 469 470 471 472 473 474 475 476 477 478 479
thick annual layers to very fine laminae, identified to reflect the change in water availability (red line in Fig. 7), Mg increases while Sr and Ba decrease. Variations of host rock derived trace elements in speleothems, such as Mg, Sr and Ba, have often been interpreted to reflect changes in prior calcite precipitation (e.g. Fairchild and Treble, 2009). Prior calcite precipitation (PCP) is the process of calcite precipitation upstream of the site of speleothem deposition, and predominantly occurs during dryer periods (Fairchild et al., 2000; Fairchild and Treble, 2009). In RSM-17, Mg concentrations increase from ~150 µg g-1 to 300 µg g-1 at approximately 545 mm dft (Fig. 7). This increase does not occur simultaneous
with the increase in δ13C at 561.5 mm dft (Fig. 6), but it starts where the change in speleothem
morphology is observed (Fig. 6), suggesting a similar control on Mg variations and growth rate. The observed changes in Mg concentration fit with the process PCP, with higher concentrations during periods with less water availability and thus lower growth rates. Concentrations of Sr and Ba behave opposite with respect to Mg, suggesting no control of PCP on Sr and Ba. Dolomite dissolution has been evoked in the past to explain an antiphase behavior of Mg and Sr (Roberts et al., 1998), even in Han-sur-Lesse cave (Vansteenberge et al., in review). However, Mg concentrations in RSM-17 average at 194 µg g-1, which is very low and questions the influence of dolomite in the host rock on the speleothem
geochemistry. A more likely mechanism controlling Sr and Ba variations in RSM-17 is the speleothem growth rate. Experimental studies have shown that the partitioning of Sr in calcite increases with the precipitation rate (Lorens, 1981; Pingitore and Eastman 1986). Yet, from cave-analogue experiments Day and Henderson (2013) concluded that growth rate changes smaller than a factor 2.5 are unlikely to have any effect on the partitioning of Sr in cave calcite. However, if RSM-17 layer thickness is presumed to act as a proxy for growth rate, a decrease in growth rate by a factor >2.5 at the morphological transition is definitely plausible (Fig. 6-7). In a similar way, Bourdin et al. (2011) interpreted changes in earth-alkaline elements, and more specific an antiphase behavior of Mg versus Sr and Ba, in a stalagmite from Chauvet Cave (France) as a result of changes in growth rate. It is concluded that in the case of RSM-17, Mg variations reflect a changing amount of PCP in the epikarst while the effect of growth rate dominates over PCP for controlling variations in Sr and Ba concentrations. The U concentration in RSM-17 is also lower after 545 mm dft (Fig. 7). Bourdin et al. (2011) suggested that the main source of U in speleothem drip waters is limestone dissolution. The observed lower U concentrations in RSM-17 are thus in agreement with decreased bedrock dissolution at a time when lower growth rates are observed after 545 mm dft.
At 545 mm dft, the amplitude of variation in P and Y diminishes severely (Fig. 7). In speleothems, P originates from vegetation dieback (Fairchild et al., 2001; Huang et al., 2001, Treble et al., 2003; Borsato et al., 2007) and is transported towards the speleothem via the binding to organic acids. Although vegetation is believed to constitute the main source of P concentration in speleothems, leaching of 480 481 482 483 484 485 486 487 488 489 490 491 492 493 494 495 496 497 498 499 500 501 502 503 504 505 506 507 508 509 510 511 512
phosphate minerals in the epikarst has also been identified as a process that potentially contributes P to speleothems (Frisia et al., 2012). Yttrium is commonly transported into speleothems by binding to natural organic matter (Borsato et al., 2007; Hartland et al., 2012). The decrease in concentration of both elements in RSM-17 is therefore interpreted to reflect decreased amounts of organic matter within the soil, due to a lower vegetation productivity which is in agreement with the decreased vegetation activity interpreted from the δ13C record. Both P and Y concentrations are lower when the speleothem growth rate
decreases. This confirms the influence of vegetation productivity and vegetation-derived soil CO2 on the
speleothem growth rate. The Al and Zn display an increase at 550 mm dft, shortly after the morphological change. The paleoclimatological significance of Al is not commonly studied in speleothems, but Al variations likely reflect an enhanced detrital input into the speleothem, since Al is a major element in clay and fine detrital material and it is dominantly transported into speleothems via larger detrital particles (Fairchild and Treble, 2009). Increased detrital input can result from increased accumulation of fine particles in dryer cave environments, rather than through the drip water. Zinc behaves opposite to Y, with higher concentrations after 50 mm. Yet, previous studies have shown that Zn, like Y, is preferentially transported into speleothems through binding to natural organic matter (Hartland et al., 2012; Wynn et al., 2014). Because Zn concentration shows similar trends as Al concentration within the speleothem, Zn is interpreted to have detrital signature, similar to Al, rather than an organic matter signature, such as Y.
5.4.3 Regional to global significance of the 117.7 ka event
Numerous paleoclimate records have reported the presence of a short-lasting and drastic climate event at the end of the Eemian or MIS 5e. The 117.7 ka event as observed in the Belgian speleothems can be related to most of these late Eemian/MIS 5e climate deterioration or events observed in other records (Fig. 8). Besides the earlier mentioned pollen record from the Eifel at 118 ± 1 ka (Sirocko et al., 2005, Fig. 8), a brief reduction in forest cover occurring between 118.2 and 117.5 ka was also identified in Ioannina and Kopais pollen records, Greece (Tzedakis et al., 2003). In lake cores retrieved from Lago Grande di Monticchio (Italy) a slight decrease in the percentage of woody taxa pollen is observed at between 118 and 117 ka (Fig. 8, Brauer et al., 2007; Allen and Huntley, 2009). Additional temperature reconstructions based on pollen records from La Grande Pile (France) and Lago Grande di Monticchio (Italy) have indicated that at ~117-118 ka a short temperature decrease occurs that fits with the event observed in the Belgian speleothems. Precipitation reconstructions show a simultaneous decrease in precipitation, yet in contrast to temperature, precipitation does not recover after the event (Brewer et al., 2008). In the La Grande Pile pollen record (Vosges, France) a cold and dry event, the Woillard event (Kukla et al., 1997), was identified just before the end of the Eemian, characterized by a rapid replacement of the temperate hardwood forest by boreal vegetation (Woillard, 1978). Similar vegetation 513 514 515 516 517 518 519 520 521 522 523 524 525 526 527 528 529 530 531 532 533 534 535 536 537 538 539 540 541 542 543 544 545
changes in pollen records from eastern Poland (Granoszewski, 2003) were likewise correlated to the Woillard event by Helmens (2014). However, because Eemian vegetation is suspected to last longer in southern Europe (Müller and Sanchez Goñi, 2007), the Woilard event is generally placed later in those records (e.g. Brauer et al., 2007). Despite the clear presence of the 117.7 ka event in European pollen records, the event is still underrepresented in European speleothem records. To the extent of our knowledge, the event can be correlated with only two other speleothem records. The first is the TKS flowstone retrieved from the Entrische Kirche in the Austrian Alps (Fig. 1a, Meyer et al., 2008). The TKS δ18O displays a fast, ~ 4 ‰ decreases in δ18O centered at 118 ± 2 ka (Fig. 8), which was interpreted to
reflect a strong cooling. However, in the TKS δ13C no excursion similar to that observed in the Belgian
speleothem datasets is present. The second dataset contains the BAR-II duplicate speleothem record (Demény et al., 2017). The BAR-II speleothem was retrieved from the Baradla Cave, northeastern Hungary. The BAR-II δ18O shows a sudden decrease at 117.0 ± 0.8 ka (Fig. 8), interpreted to reflect an
arid pulse. At the same time, a ~2 ‰ increase is observed in the δ13C. Other European speleothem
records, such as the Corchia Cave speleothems (Drysdale et al., 2005; 2007), speleothems from the Alps (Boch et al., 2011; Moseley et al., 2015) and speleothems from the Levant (Bar-Matthews et al., 2003; Nehme et al., 2015), do not record any anomalies in their stable isotope proxies.
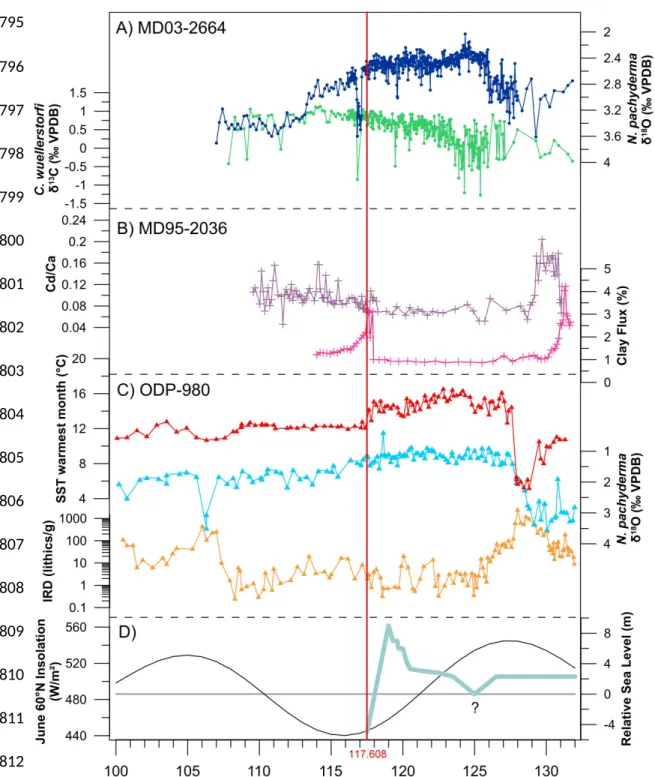
Besides (European) continental records, clear evidence from high-resolution marine sediment archives of a climate anomalous event around 117 to 118 ka in the North Atlantic realm exists. The presence of a cold event at the Eirik Drift, South of Greenland in the North Atlantic Ocean (Fig. 1a), which occurs just before the end of the MIS 5e benthic δ18O plateau, is reported by Galaasen et al. (2014)
and Irvali et al. (2016). More specific, an increase in δ18O of planktonic foraminifera and an increase in
the amount of ice rafted debris (IRD) occur at ~117 ka in marine sediment core MD03-2664, indicating the presence of colder conditions in that area (Fig. 9). According to the age model presented in Irvali et al. (2016), this event lasts about 0.4 ka, which is similar to the LEAP observed in the ELSA record (Sirocko et al., 2005). High-resolution δ13C analysis of epibenthic foraminifera (C. wuellerstorfi, Fig. 9) indicates
that during this event, the formation of North Atlantic Deep Water was reduced, which is believed to be the cause of the cold conditions during the event (Galaasen et al., 2014). In the Bermuda Rise (western Atlantic Ocean, Fig. 1a), similar observations were made, i.e. an increase in Cd/Ca and clay flux indicates a shift in deep oceanographic conditions with an increased input of southern source waters compared to NADW (Fig. 9). This shift occurred in approximately 400 years at ~118 ka (core MD95-2036; Adkins et al., 1997). Later on, Lehman et al. (2002) calculated ~3 °C decrease in sea surface temperature in MD95-2036 at ~118 ka. A core retrieved from the Norwegian Sea (ODP-980; Oppo et al., 2006) shows a distinct decrease in sea surface temperature and lithic fragments at ~118 ka. It is thus apparent that an event, 546 547 548 549 550 551 552 553 554 555 556 557 558 559 560 561 562 563 564 565 566 567 568 569 570 571 572 573 574 575 576 577 578
equivalent to that observed in the Belgian speleothems at 117.7 ± 0.5 ka, is occurring in the North Atlantic region. In particular, the increase in IRD in sediment cores reflects growth regional ice sheet growth (Irvali et al., 2016). Global sea-level reconstructions inferred from coastal deposits (e.g. corals) indicate a rapid fall of the above-present sea-level at the end of MIS 5e after 118 ka (Fig. 9, Hearty et al., 2007), indicating the rapid growth of ice sheets at that time. More precise ages are provided by Moseley et al. (2013), who inferred from presently submerged speleothems of the Yucatan peninsula that MIS 5e sea-level dropped to -4.9 m by 117.7 ± 1.4 ka.
However, the age-depth models of these marine records are often constructed using climato-stratigraphic alignment strategies (Govin et al., 2015) and the chronology of these records is therefore not absolutely and independently constrained. Yet, the similarity in timing, duration and climatologic expression suggests that Belgian speleothems, European pollen archives and marine sediment cores from the North Atlantic realm registered the same climatic event. So what could have caused such a widespread rapid, short-lasting cooling event as observed in the Belgian speleothems at 117.7 ± 0.5 ka and other continental European and North Atlantic records? The presence of Eemian optimum conditions between 125-120 ka is evident from several European paleoclimate reconstructions (Fig. 8 and section 6.3). Such optimum conditions at that time caused a significant degree of ice mass loss, resulting in peak eustatic sea-levels up to +6 to +9 m between ~120 and 118 ka compared to present (Fig. 9). This peak in eustatic sea-level, 2 to 6 m above the MIS 5e average sea-level (Hearty et al., 2007; Blanchon et al., 2009; Dutton and Lambeck, 2012; O’Leary et al., 2013; Sivan et al., 2016), would require melting of a substantial amount of the Greenland ice sheet and perhaps even a small contribution by melting of the West Antarctic ice sheet (Hearty et al., 2007). This enhanced melting would induce a significant input of freshwater in the North Atlantic. In model simulations, a large freshwater flux resulting from the northern hemisphere ice sheet loss leads to a temporary abrupt weakening of the Atlantic meridional overturning circulation (AMOC), causing a strong decrease in global annual mean temperature (Loutre et al., 2014). Potential evidence for a reduced formation of NADW related to AMOC weakening during the 117.7 ka event, has been found in the sediment core from the Erik Drift, South of Greenland (Galaasen et al., 2014). In the frame of these findings, the cooling event at 117.7 ± 0.5 ka that resulted in a vegetation shift observed in the Belgian speleothems, is due to weakening of the AMOC and reduction of NADW formation. This cooling event crossed a critical threshold for a vegetation shift towards a decrease in tree species to occur in Western Europe at 117.7 ka, which is evident from the speleothems’ δ13C record.
6.5 Early Weichselian millennial climate variability (117.5 – 100 ka) 579 580 581 582 583 584 585 586 587 588 589 590 591 592 593 594 595 596 597 598 599 600 601 602 603 604 605 606 607 608 609
During the glacial inception, which is set at 117.7 ka, with the start of the cold event detected in the Belgian speleothem records, an increased variability in δ13C, suggesting increased vegetation instability,
is observed. In Han-8, other proxies such as δ18O and Mg, Sr, Ba and also U show a more gradual
decrease towards minimum values at ~114.3 ka (Fig. 5). These proxies reflect a gradual decline of interglacial paleoclimate conditions characterizing the glacial inception. The timing of appearance of this gradual decline is in line with observations from other records in continental Europe and the North Atlantic (Fig. 8 and 9). Han-8 δ18O and Mg, Sr, Ba and U remain at a minimum until ~112 ka. At the
same time of this minimum observed in the speleothem records, a slightly warmer stadial period occurs in Greenland, i.e. Greenland Interstadial (GI) 25. In this study, the NGRIP d18O data is plotted on the GICC05modelext timescale (Wolff et al., 2010). This chronology is preferred over the AICC2012 (Bazin et al., 2013; Veres et al., 2013) because of 1) the proximity of the Greenland ice core archives over the Antarctic ice core archives (Govin et al., 2015) and 2) the synchronous appearance between Greenland Stadials 25 and 24 in NGRIP record on a GICC05modelext timescale and the expression of these stadials in continental Europe recorded in Alpine speleothems (Boch et al., 2011). Capron et al. (2010) showed that the GI-25 warming in Greenland is of significantly lower amplitude than the following interstadial events (3 ± 2.5 °C compared to 8-16 °C) and concluded that GI-25 represents a local climate feature in Greenland rather than later global interstadial events. This implies that GI-25 did not persist in continental Europe, and confirms why there is no distinct signature of a GI-25 equivalent event in the speleothem record. Other European speleothems and pollen records (Fig. 8), do not show a distinct GI-25 equivalent signature as well, evidencing that this stadial was not as prominent as the following GI-24. Yet, at ~112 ka, Han-8 δ18O and Mg, Sr, Ba and U increase again. This increase shows affinity with a short warming
event observed at in the NGRIP record at the end of GI-25, defined as ‘GIS 25s’ (Capron et al., 2012), but later labeled as GI-25a by Ramsussen et al. (2014). It is remarkable, especially for the Han-sur-Lesse speleothems, that the stadial/interstadial events are reflected not only in the paleoclimate proxies (e.g. GS-25 in Han-9 δ13C) but also in the growth rate of the speleothems. For example, Han-8 stops growing at the
start of GS-25 in the NGRIP record, and at the same time a severe decrease in growth rate is observed in Han-9 (Fig. 3). Moreover, the second hiatus in Han-9 corresponds in timing to GS-24. From the Han-9 growth rate (Fig. 3), it appears that the Han-9 speleothem never fully recovered from GS-25, and additional cooler-dryer conditions at the onset of GS-25 were sufficient to cease speleothem formation (Vansteenberge et al., 2016).
6. Conclusions
Following conclusions are reached: 610 611 612 613 614 615 616 617 618 619 620 621 622 623 624 625 626 627 628 629 630 631 632 633 634 635 636 637 638 639 640 641
1. The two newly added Belgian speleothem records Han-8 and RSM-17 confirm the general climatic trends of the Eemian to early Weichselian observed in Han-9. Especially the reproducibility of the Han-9 δ13C record with the coeval Han-8 speleothem is remarkable,
confirming the hypothesis of Vansteenberge et al. (2016) that δ13C represents a regional climate
signal controlled by vegetation activity, reflecting vegetation assembly above the cave.
2. These two newly studied speleothems also show rapid increase in δ13C, similar to the earlier
observed rapid 4 ‰ increase in Han-9 δ13C at 117.5 ± 0.5 ka. This δ13C increase in Han-9 was
interpreted to represent a rapid change in vegetation, from dominated by temperate tree species towards dominated by grasses and shrubs which was caused by fast cooling and/or drying of the regional climate. This event shows a strong affinity in terms of timing and climatic expression with the Late Eemian Aridity Pulse (LEAP), identified in the nearby ELSA vegetation stack and characterized by an increase in grass pollen and loess content at 118 ±1 ka (Sirocko et al., 2005). Aligning the chronologies of the two independently dated Han-sur-Lesse speleothem records (Han-8 and Han-9) assign a more precise absolute age of 117.7 ± 0.5 ka to the start of this event. In both speleothems, a hiatus starts at 117.5 ± 0.5 ka hampering the assessment of the duration, yet in the ELSA stack the LEAP lasts 468 varve years.
3. The start of the 117.7 ka event in the Belgian speleothems marks an important boundary in the Belgian speleothem proxies between Eemian optimum conditions and increased variability during the glacial inception. The start of this event at 117.7 ± 0.5 ka is therefore proposed as the Eemian-Weichselian transition (EWT) and consequently the start of the glacial inception as registered in the Belgian speleothems and potentially other records in northwestern Europe. This shows the importance of the event, at least in the study area, as a contributor to the last interglacial to glacial transition.
4. High-resolution analysis of the annually layered Belgian speleothem RSM-17 shows that the δ13C
excursion (and thus vegetation changes) at the EWT starts before a decrease in precipitation which is reflected by trace element concentrations and speleothem morphology. It is therefore hypothesized that the climatic event starting at 117.7 ± 0.5 ka is initiated by a cooling pulse that altered vegetation assembly above the cave. A few decades after this cooling pulse, additional drying of the climate occurs.
5. An event similar to that observed in the Belgian speleothems at 117.7 ± 0.5 ka event is also present as a short-lived cooling event in several North-Atlantic sediment archives. This indicates a larger regional persistence than previously thought. Through comparison with these sediment archives and global sea-level reconstructions, it is hypothesized that the origin of the cooling event at 117.7 ka is an internal climate response caused by the substantial amount of freshwater 642 643 644 645 646 647 648 649 650 651 652 653 654 655 656 657 658 659 660 661 662 663 664 665 666 667 668 669 670 671 672 673 674 675
input from degraded ice-sheets by the end of the Eemian (~120-118 ka). This is also reflected by peak eustatic sea-level at the end of the Eemian.
6. The registration of this event by Belgian speleothems shows a clear climatic connection of these speleothems with other continental European archives and North Atlantic marine archives. This provides future potential of improving less constrained chronologies by alignment to the independently constructed speleothem age-depth models presented in this study.
7. Stadial-Interstadial changes are recorded by the speleothem paleoclimate proxies but are also tracked in the growth evolution of the speleothems. This shows that Belgian speleothems are very sensitive recorders of early glacial climate changes.
Acknowledgements
We thank M. Gewelt for the first analysis of RSM-17, as well as the cave management of Han-sur-Lesse and Remouchamps Cave for allowing us to retrieve the samples and study the cave environment. We also thank T. Goovaerts for the treatment of the speleothem samples, D. Verstraeten for the lab assistance at the VUB stable isotope lab and J.R.M. Allen and B. Huntley for providing the data of Lago Grande di Monticchio. S. Va. is funded by the VUB Strategic Research Program. P. C. thanks Hercules foundation for the upgrade of the VUB stable isotope lab. Han-8 speleothem was sampled in the frame of the EU H2020 Past4Future Project. 676 677 678 679 680 681 682 683 684 685 686 687 688 689 690 691 692 693 694 695 696
Figure 1
Figure 1: (A) Location of the most important sites mentioned in the text (1) Han-sur-Lesse and Remouchamps Cave (this study), (2) Eifel (Sirocko et al., 2005), (3 & 4) NALPS (Boch et al., 2011), (5) Entrische Kirche (Meyer et al., 2008), (6) Baradla Cave (Demény et al., 2017), (7) Corchia Cave (Drysdale et al., 2005; 2007; 2009), (8) Lago Grande di Monticchio (Brauer et al., 2007; Allen and Huntley 2009), (9) NGRIP (NGRIP members, 2004), (10) MD03-2664 (Irvali et al., 2012; 2016; Galaasen et al., 2014), (11) MD95-2036 (Adkins et al., 1997), (12) ODP-980 (Oppo et al., 2006) and (13) Dongge Cave (Yuan et al., 2004). (B) Map of Han-sur-Lesse Cave based on Quinif (2006) (C) Location of the Calestienne and the two cave sites in Belgium. (D) Map of Remouchamps Cave based on (Ek, 1970). 697 699 700 701 702 703 704 705 706 707 708 709 710 711 712 713 714 715 716
Figure 2
Figure 2: Images of the samples used in this study. Red lines mark the location of the stable isotope measurements and blue lines indicate the trace element transects. Grey boxes show the location of the U-Th dating samples. Green boxes on Han-9 indicate the additional dates added in this study to improve the original age-depth model of Vansteenberge et al. (2016). Black line in RSM-17 indicates the marker layer that was used to correlate Core 1 and 2.
717 718 719 720 721 722 723 724
Figure 3
Figure 3: U-Th dating results and calculated age-depth models of RSM-17 (purple), Han-8 (blue) and Han-9 (yellow). Grey bands denote the 2σ error. Red U-Th labels mark previously published ages by Vansteenberge et al. (2016). Lower graph represents the growth rate of the speleothems in mm ka-1. The ages discussed in the text are indicated by numbers.
725 726 727 728 729 730 731 732
Figure 4
Figure 4: Tuning of Han-9 and Han-8 age-depth models based on their δ13C record. Dark blue
curve is the Han-9 δ13C and light blue is Han-8 δ13C. U-Th data is shown with black circles (Han-9)
and diamonds (Han-8). Red triangles indicate the 8 tuning points, and the specifics are provided in Table 2. Lower graph shows the 2σ error of the individual age-depth models (dark and light blue) and the dashed red line represents the age difference between the original Han-9 age-depth model and the tuned Han-9 age-depth model. See Table 2 for more information about the assigned tie-points. 733 734 735 736 737 738 739 740 741 742