arXiv:1503.03675v1 [astro-ph.SR] 12 Mar 2015
Spectroscopic survey of Kepler stars.
⋆
I. HERMES/Mercator observations of A- and F-type stars
E. Niemczura
1†, S. J. Murphy
2,3, B. Smalley
4, K. Uytterhoeven
5,6, A. Pigulski
1,
H. Lehmann
7, D.M. Bowman
8, G. Catanzaro
9, E. van Aarle
10, S. Bloemen
11, M. Briquet
12,
P. De Cat
13, D. Drobek
1, L. Eyer
14, J. F. S. Gameiro
15, N. Gorlova
10, K. Kami´
nski
16,
P. Lampens
13, P. Marcos-Arenal
10, P. I. P´
apics
10, B. Vandenbussche
10, H. Van Winckel
10,
M. St¸e´slicki
17, M. Fagas
161 Instytut Astronomiczny, Uniwersytet Wroc lawski, Kopernika 11, 51-622 Wroc law, Poland
2 Sydney Institute for Astronomy (SIfA), School of Physics, University of Sydney NSW 2006, Australia
3 Stellar Astrophysics Centre, Department of Physics and Astronomy, Aarhus University, 8000 Aarhus C, Denmark 4 Astrophysics Group, Keele University, Staffordshire, ST5 5BG, United Kingdom
5 Instituto de Astrofisica de Canarias, E-38205 La Laguna, Tenerife, Spain
6 Universidad de La Laguna, Departamento de Astrofisica, E-38206 La Laguna, Tenerife, Spain 7 Th¨uringer Landessternwarte Tautenburg (TLS), Sternwarte 5, 07778 Tautenburg, Germany 8 Jeremiah Horrocks Institute, University of Central Lancashire, Preston PR1 2HE, UK 9 INAF-Osservatorio Astrofisico di Catania, Via S. Sofia 78, I-95123, Catania, Italy 10Instituut voor Sterrenkunde, KU Leuven, Celestijnenlaan 200D, 3001, Leuven, Belgium
11Department of Astrophysics, IMAPP, Radboud University Nijmegen, PO Box 9010, NL-6500 GL Nijmegen, The Netherlands 12Institut d’Astrophysique et de G´eophysique, Universit´e de Li`ege, All´ee du 6 Aoˆut 17, B-4000 Li`ege, Belgium
13Royal observatory of Belgium, Ringlaan 3, B-1180 Brussel, Belgium
14University of Geneva, Department of Astronomy, Chemin des Maillettes, 51, Sauverny, CH-1290, Switzerland 15Instituto de Astrof´ısica e Ciˆencias Espaciais and Faculdade de Ciˆencias, Universidade do Porto, Rua das Estrelas,
PT4150-762 Porto, Portugal
16Astronomical Observatory, Adam Mickiewicz University, ul. S loneczna 36, PL-60-286 Pozna´n, Poland 17Centrum Bada´n Kosmicznych, Polska Akademia Nauk, Kopernika 11, 51-622 Wroc law.
Accepted ... Received ...; in original form ...
ABSTRACT
The Kepler space mission provided near-continuous and high-precision photometry of about 207,000 stars, which can be used for asteroseismology. However, for successful seismic modelling it is equally important to have accurate stellar physical parame-ters. Therefore, supplementary ground-based data are needed. We report the results of the analysis of high-resolution spectroscopic data of A- and F-type stars from the Kepler field, which were obtained with the HERMES spectrograph on the Mercator telescope. We determined spectral types, atmospheric parameters and chemical abun-dances for a sample of 117 stars. Hydrogen Balmer, Fe i, and Fe ii lines were used to derive effective temperatures, surface gravities, and microturbulent velocities. We determined chemical abundances and projected rotational velocities using a spectrum synthesis technique. The atmospheric parameters obtained were compared with those from the Kepler Input Catalogue (KIC), confirming that the KIC effective temper-atures are underestimated for A stars. Effective tempertemper-atures calculated by spectral energy distribution fitting are in good agreement with those determined from the spectral line analysis. The analysed sample comprises stars with approximately solar chemical abundances, as well as chemically peculiar stars of the Am, Ap, and λ Boo types. The distribution of the projected rotational velocity, v sin i, is typical for A and F stars and ranges from 8 to about 280 km s−1, with a mean of 134 km s−1.
Key words: stars: general – stars: abundances – stars: chemically peculiar – stars: rotation – space missions Kepler
Spanish Observatorio del Roque de los Muchachos of the Instituto de Astrofsica de Canarias. Based on observations obtained with the HERMES spectrograph, which is supported by the Fund for Scientific Research of Flanders (FWO), Belgium , the Research Council of K.U.Leuven, Belgium, the Fonds National Recherches Scientific (FNRS), Belgium, the Royal Observatory of Belgium, the Observatoire de Genve, Switzerland and the Thringer Lan-dessternwarte Tautenburg, Germany.
† E-mail: eniem@astro.uni.wroc.pl
derstanding of stellar evolution. It provides direct tests of the modelling of processes taking place in stellar in-teriors, such as diffusion, transport of angular momen-tum (Mosser et al. 2012; Marques et al. 2013), convec-tive overshooting, mechanisms driving pulsations (e.g. Moravveji et al. 2012; Antoci et al. 2014), and the value of the mixing-length parameter in stars of different effec-tive temperatures (Trampedach & Stein 2011; Bonaca et al. 2012). The key ingredients for an asteroseismic study are precise pulsation frequencies, mode identification, and strong constraints on atmospheric parameters, such as effec-tive temperature Teff, surface gravity log g, chemical
abun-dances, and rotational velocity v sin i. Accurate values of the pulsation frequencies are provided by the ultra-precise Kepler photometry. The accuracy of atmospheric param-eters available from the Kepler Input Catalogue (KIC) (Brown et al. 2011) is generally too low for asteroseismic modelling, particularly for stars of spectral types earlier than F0 (Huber et al. 2014). Also, information on the stel-lar chemical composition and rotational velocity is lacking. Therefore, high-resolution spectra which offer a wide range of information are needed to fully characterise Kepler tar-gets (Uytterhoeven 2014).
For more than a thousand Kepler stars high-and medium-resolution spectra have been collected (Uytterhoeven et al. 2010). These observations are summa-rized in the Kepler Asteroseismic Science Operations Center (KASOC) database1. In this paper, we focus on the analysis
of high-resolution spectra of main-sequence A- and F-type stars. The main groups of pulsators among these objects are δScuti, γ Doradus, and γ Dor/δ Sct hybrid stars. The δ Sct stars are main-sequence or evolved stars situated in the clas-sical instability strip. They pulsate in low-order radial and non-radial pressure modes (p-modes) with typical frequen-cies of 5 to 50 d−1 (see reviews by Breger 2000; Handler
2009; Balona 2014). The γ Dor stars are pulsating variables with spectral types A7–F5 that are on or close to the main-sequence and pulsate in high-order gravity modes (g-modes) with typical frequencies of 0.3 to 3 d−1 (Kaye et al. 1999).
The instability strip for γ Dor stars partly overlaps with the δSct instability strip. The γ Dor variables are of particu-lar interest in asteroseismology, as their g-mode pulsations probe the deep interiors of these stars, reaching their convec-tive cores. Additionally, these pulsators occupy a region in
the H-R diagram where γ Dor-like g-mode pulsations, δ Sct-like p-mode pulsations and possibly solar-Sct-like oscillations can co-exist in a single star. This overlap means that some individual objects show g-mode as well as p-mode pulsa-tions. These hybrid variables permit simultaneous probing of two distinct regions of the interior: the deep layers be-tween the convective core and the envelope, where the g-modes propagate, and the outer layers of the envelope where the p-modes propagate (Kurtz et al. 2014; Saio et al. 2015). Therefore, hybrid stars are key objects for testing stellar models with seismic techniques.
Grigahc`ene et al. (2010) found that the hybrid stars in the Kepler field are spread over the entire δ Sct and γDor instability domains. The analysis of Kepler data and KIC parameters for 750 A and F stars presented by Uytterhoeven et al. (2011) confirms this result. They found that 23% of their sample of A and F objects shows both δ Sct pulsations and low-frequency variations. Balona & Dziembowski (2011) analysed observations of 1568 δ Sct pulsators taken from the Kepler archive and iden-tified a group of δ Sct stars with low-frequency peaks sim-ilar to those characteristic for γ Dor stars. Contrary to the results of Uytterhoeven et al. (2011) and Grigahc`ene et al. (2010), these variables are located in the same region of the H-R diagram as the ground-based γ Dor pulsators and none is found in the δ Sct instability domain. The low fre-quencies are observed in the hotter stars, but their origin is not clear (Balona 2014). A high-resolution spectroscopic analysis by Tkachenko et al. (2013b) found each of their 38 γDor stars to lie within the γ Dor instability strip. Accurate stellar atmospheric parameters are clearly required to place γDor/δ Sct hybrids unambiguously in the H-R diagram.
This paper is organised as follows: in Sect. 2, we de-scribe observational data used in the analysis. Details on the spectral classification methods are given in Sect. 3. In Sect. 4, we present all the methods applied for determining the atmospheric parameters of the investigated objects, the sources of possible errors, and discuss consistency of the re-sults obtained from different approaches. The distribution of rotational velocities is presented and discussed in Sect. 5. The derived abundances of elements, their correlation with the other parameters and a sample of chemically peculiar (CP) stars are discussed in Sect. 6. Positions of the analysed stars in the log Teff – log g diagram, conclusions and future
prospects are given in Sect. 7.
2 SPECTROSCOPIC SURVEYS OF KEPLER STARS
High-resolution spectra were collected for several hundred stars located in the Kepler field-of-view. Most of these spectra were obtained by ´echelle spectrographs attached to the Mercator Telescope2, Nordic Optical Telescope3(NOT),
Tautenburg 2-m Alfred-Jensch Telescope4 (TLS), Bernard
2 http://www.mercator.iac.es 3 http://www.not.iac.es/
4 http://www.tls-tautenburg.de/TLS
Lyot Telescope5 and the Canada-France-Hawaii Telescope6 (CFHT).
In this paper we analyse high-resolution spectra taken with the cross-dispersed, fibre-fed ´echelle spectrograph HERMES (High Efficiency and Resolution Mercator ´Echelle Spectrograph; Raskin et al. 2011) attached to the 1.2-m Mercator Telescope located on La Palma (Canary Islands, Spain). The spectra have a resolving power R ∼ 85 000 and cover the spectral range from 3770 to 9000 ˚A. The typical signal-to-noise (S/N) ratio for an individual spectrum at 5500 ˚A is 80–100. The spectra have been reduced with a ded-icated pipeline7, which includes bias subtraction, extraction of scattered light produced by the optical system, cosmic ray filtering, division by a normalized flat-field, wavelength cali-bration by a ThArNe lamp and order merging. The normal-isation to the continuum was performed manually by using the standard iraf8 procedure continuum. Most of the stars in our sample have v sin i > 40 km s−1. The spectra of rapid
rotators are very difficult to normalize correctly in spectral regions rich in blended lines, e.g. for λ < 4100 ˚A. For this reason, we checked the quality of our normalisation by fit-ting synthetic spectra to all Balmer lines in the spectrum of each star. If the spectrum has been normalized correctly, all hydrogen lines can be fitted satisfactorily with the same Teff. The process of normalization is otherwise repeated. For
the few stars for which we have more than one spectrum, we analysed the averaged spectrum. The averaging process is applied after normalization and forms an additional test of the quality of the normalization process.
The data analysed in this paper were collected in spec-troscopic surveys carried out in the years 2010 to 2012 (Ta-ble 1). Ta(Ta-ble 2 lists the analysed stars and gives their KIC numbers, dates of the observations, number of spectra, vi-sual (V ) magnitudes, and spectral types from the litera-ture and determined in this paper. We also provide notes on chemical peculiarity, binarity and pulsation characteristics. Chemically peculiar stars in our sample were identified in the process of spectroscopic classification and confirmed by the detailed spectroscopic analysis afterwards. Twenty stars were found to be double-lined spectroscopic binaries (SB2) and the atmospheric parameters of these stars will be pre-sented in a separate paper (Catanzaro et. al, in preparation). The results of the spectroscopic analysis of stars ob-served with the other telescopes will be presented in a forth-coming paper (Niemczura et al., in preparation).
3 SPECTRAL CLASSIFICATION
Stellar spectral classification in the Morgan-Keenan (MK) system involves determining the luminosity class and spec-tral type for a given star by comparing its spectrum with spectra of standards (Gray & Corbally 2009). The spectral type in A stars is determined mainly from three spectral fea-tures: (i) hydrogen lines, (ii) the Ca ii K line, and (iii) lines of metals. In a non-peculiar star, all three features should
5 http://www.tbl.omp.eu/ 6 http://www.cfht.hawaii.edu/
7 hermes-as.oma.be/doxygen/html/index.html
8 Image Reduction and Analysis Facility,
3230227⋆ 2010 May-September 1 8.94 A51 A5 IV: SB2; ecl. bin. + δ Sct
3231985⋆ 2011 September 1 9.22 A21 A4 IV Ca weak (A3) rot.
3347643 2010 May-September 1 7.69 A21 A3 Van hybrid (low. ampl. γ Dor)
3441230 2012 July 1 9.79 A21 kA2hA5mF0 V Am rot.
3656913 2012 July 1 9.81 A01 kA2hA6mF0 IV Am SB2; bin.
3850810⋆ 2010 May-September 1 10.10 F1 Vs wk met (F0) hybrid + rot.
KIC 3230227: Incorrectly normalised H lines; wings are unusable but core matches A5 IV. Metal lines indicate A5 V. KIC 3231985: Weak Ca K and Ca λ4226 line.
KIC 3850810: Considerably metal weak or poorly normalised.
1 Heckmann & Dieckvoss (1975)
Table 1.HERMES spectroscopic surveys of Kepler stars.
Observation Primary Observers
dates Investigator
2010 May-Sept. M. Briquet KU Leuven observers⋆
2011 July E. Niemczura D. Drobek 2011 Sept. E. Niemczura J. F. S. Gameiro 2012 July K. Uytterhoeven E. Niemczura 2012 August P. De Cat P. I. P´apics 2012 Sept. P. De Cat P. M. Arenal
⋆ E. Van Aarle, S. Bloemen, N. Gorlova, P. Lampens, H. Van
Winckel, B. Vandenbussche
consistently provide the same spectral type, if the correct luminosity class has been adopted. Determination of lumi-nosity class in A stars is difficult. While the hydrogen lines are very sensitive to luminosity in early A stars, the A5 and later spectral types lose much of this sensitivity and at F0 the hydrogen lines become almost insensitive to the luminos-ity class. For F0, ionised lines of Fe and Ti become useful in determination of the luminosity class.
At late A spectral type, metallic (Am) stars are com-mon. For these stars spectral types determined from the Ca ii K-line and metal lines differ by five or more subclasses. The Ca ii K line is weak in their spectra and thus yields an earlier spectral type than hydrogen lines, while the metal lines are enhanced and typical for a later subtype. They are denoted as, for example, kA2hA5mF0 (IV), where k, h and m precedes the spectral type obtained from the Ca ii K line, hydrogen lines and metal lines, respectively. These symbols are followed by the luminosity class. If the luminosity class is in parentheses, as it is in this example, then the star exhibits the anomalous luminosity effect (ALE, see Gray & Corbally 2009) where the violet part of the spectrum indicates a more
luminous class than the blue part. Stars showing mild Am features, where there are fewer than five spectral subtypes between the Ca ii K line and metal line types, are called marginal Am stars, denoted as “Am:”.
Most of the objects were classified as A stars, including slow, fast and very fast rotators (“s”, “n” and “nn” added to the spectral type, respectively). The classified CP stars are of Am (17), Ap CrSrEu (1) and λ Bootis types (2). Ad-ditional, mild peculiarities were discovered in some of the stars, such as weak Ca or metal lines. Only three stars were classified as late B, with one of them appearing to be He strong (He-s). The assigned spectral classes are presented in Table 2 and some notes are provided in the comments below the table.
4 ATMOSPHERIC PARAMETERS
To perform an abundance analysis, one needs an appropriate atmospheric model of the star, which requires the effective temperature, surface gravity and metallicity to be known. To determine these parameters, we applied both photometric and spectroscopic methods.
4.1 Effective temperatures from Spectral Energy Distributions
Effective temperature can be determined from the stellar spectral energy distribution (SED). For our target stars these were constructed from the available photometry, using 2MASS (Skrutskie et al. 2006), Tycho B and V magnitudes (Høg et al. 1997), USNO-B1 R magnitudes (Monet et al. 2003), and TASS I magnitudes (Droege et al. 2006), supple-mented, if available, by Geneva photometry (Rufener 1999),
Table 3.Atmospheric parameters of the investigated Kepler A and F stars. We present parameters derived from the KIC photometry (KIC), those obtained from spectral energy distributions (Na D & SED) and from analysis of metal and Balmer lines. The 1σ uncertainties are given for effective temperatures derived from SED fitting, and for v sin i and log ǫ(Fe) values derived from metal lines. The full table is available in electronic form.
KIC KIC Na D & SED Metal & Balmer lines
Number Teff log g E(B − V ) log ǫ(Fe) E(B − V ) Teff Teff log g ξt vsin i log ǫ(Fe)
[K] [mag] [mag] [K] [K] [km s−1] [km s−1] 10263800 8573 3.89 0.09 7.44 0.01 8590 ± 210 8900 ± 200 4.0 ± 0.2 2.0 ± 0.4 230 ± 7 6.91 ± 0.15 10264728 7794 3.85 0.09 7.42 0.03 7790 ± 200 7900 ± 200 3.8 ± 0.2 1.3 ± 0.4 257 ± 8 7.59 ± 0.12 10355055 8110 3.74 0.10 7.43 0.05 8420 ± 270 8300 ± 200 3.8 ± 0.2 2.9 ± 0.4 223 ± 7 7.29 ± 0.11 10533616 8317 3.77 0.10 7.48 0.02 8260 ± 250 8200 ± 100 3.8 ± 0.2 2.0 ± 0.2 128 ± 3 7.68 ± 0.11 10549371 6973 3.95 0.06 7.12 0.06 7300 ± 170 7200 ± 100 3.8 ± 0.1 3.9 ± 0.1 71 ± 2 7.32 ± 0.09 10555142 6998 3.51 0.08 7.32 0.04 7180 ± 160 7000 ± 200 3.8 ± 0.2 2.5 ± 0.4 210 ± 5 7.45 ± 0.14 10590857 7564 3.76 0.09 7.41 0.02 7470 ± 180 7300 ± 100 4.0 ± 0.2 2.9 ± 0.2 108 ± 4 7.53 ± 0.09 10721930 8311 3.73 0.10 7.47 0.06 8480 ± 210 8200 ± 100 3.7 ± 0.1 1.7 ± 0.1 16 ± 1 7.48 ± 0.17 10977859 8052 3.93 0.06 7.65 0.01 8400 ± 250 8200 ± 100 3.7 ± 0.1 1.6 ± 0.1 65 ± 2 7.55 ± 0.16 11013201 7779 3.82 0.07 7.44 0.01 7740 ± 260 7800 ± 100 3.8 ± 0.2 1.7 ± 0.2 117 ± 2 7.71 ± 0.08
CMC14 r′ magnitudes (Evans et al. 2002) and TD-1
ultra-violet flux measurements (Carnochan 1979).
SEDs can be significantly affected by interstellar red-dening. We have, therefore, estimated this parameter from the interstellar Na D2 (5889.95 ˚A) lines. The equivalent
widths of the D2lines were measured and E(B − V ) values
were obtained using the relation given by Munari & Zwitter (1997). For resolved multi-component interstellar Na D2
lines, the equivalent widths of the individual components were measured. The total E(B − V ) in these cases is the sum of the reddening per component, since interstellar red-dening is additive (Munari & Zwitter 1997). The SEDs were de-reddened using the analytical extinction fits of Seaton (1979) for the ultraviolet and Howarth (1983) for the opti-cal and infrared.
Effective temperatures were determined by fitting Kurucz (1993a) model fluxes to the de-reddened SEDs. The model fluxes were convolved with photometric filter response functions. A weighted Levenberg-Marquardt non-linear least-squares fitting procedure was used to find the solution that minimized the difference between the observed and model fluxes. Since log g and metallicity [M/H] are poorly constrained by our SEDs, we fixed log g = 4.0 and [M/H] = 0.0 dex for all of the fits. The results are given in Table 3. The uncertainties in Teff include the formal
least-squares error and adopted uncertainties in E(B − V ) of ±0.02 mag, log g of ±0.5 dex and [M/H] of ±0.5 dex added in quadrature.
4.2 Atmospheric parameters from spectroscopy We used atmospheric models and synthetic spectra to obtain atmospheric parameters, abundances of chemical elements and rotational velocities from the high-resolution HERMES spectra. All the necessary atmospheric models were com-puted with the line-blanketed, local thermodynamical equi-librium (LTE)ATLAS9code (Kurucz 1993a). The physics of
the models includes plane-parallel geometry, and hydrostatic and radiative equilibrium. Models were pre-calculated in a grid for effective temperatures between 5000 and 12000 K with a step of 100 K, surface gravities from 2.0 to 4.6 dex with a step of 0.1 dex, microturbulence velocities between 0.0 and 6.0 km s−1 with a step of 0.1 km s−1, and for solar metallicity. Additional models of non-solar metallicity were calculated for smaller ranges of effective temperatures and
surface gravities. The synthetic spectra were computed with the SYNTHE code (Kurucz 1993b). Both codes, ATLAS9
and SYNTHE, were ported to GNU/Linux by Sbordone (2005) and are available online9. The stellar line
identifi-cation and the abundance analysis in the entire observed spectral range were performed on the basis of the line list from Castelli & Hubrig (2004).
We analysed the metal lines following the spectrum synthesis methodology established by Niemczura & Po lubek (2006) and Niemczura et al. (2009). It relies on an efficient least-squares optimisation algorithm (see Bevington 1969; Takeda 1995), and is appropriate over a wide range of v sin i values. Our observed v sin i range is 8 to 283 km s−1, which
includes stars rotating too rapidly for equivalent width anal-ysis to be possible due to line blending. The spectrum syn-thesis method allows for a simultaneous determination of various parameters influencing stellar spectra and consists of the minimisation of the deviation between the theoretical and observed spectra. The synthetic spectrum depends on stellar parameters such as Teff, log g, ξt, v sin i, radial
veloc-ity vr, and the relative abundances of the elements log ǫ(El),
where El denotes the individual element. All atmospheric parameters are correlated. In our method, the Teff, log g and
ξt parameters were obtained prior to the determination of
abundances of chemical elements and were considered as in-put parameters. The remaining parameters (log ǫ(El), v sin i and vr) were determined simultaneously because they
pro-duce detectable and different spectral signatures. The v sin i values were determined by comparing the shapes of observed metal line profiles with the computed profiles, as shown by Gray (2005).
The starting values of Teffwere taken from the SED fits,
and values log g came from the KIC. These parameters were then improved by using the sensitivity of Balmer lines to ef-fective temperature and gravity, following the method pro-posed by Catanzaro et al. (2004). However, hydrogen lines cease to be good indicators of log g for effective temperatures cooler than 8000 K. Therefore, for stars with lower effective temperatures, the surface gravity was initially assumed to be equal to 4.0 dex. We used an iterative approach to mini-mize the differences between observed and synthetic Hδ, Hγ and Hβ profiles (see Catanzaro et al. 2004).
The effective temperatures and surface gravities
abundance versus excitation potential for the Fe i lines. De-terminations of microturbulence and effective temperature are not independent, but since the influence of microturbu-lence on spectral lines is stronger, we adjusted this param-eter first. Then, surface gravity is obtained by fitting the Fe ii and Fe i lines, and by requiring the same abundances from the lines of both ions. For hotter stars, whose spec-tra show more Fe ii than Fe i lines, the Fe ii lines were used to determine Teff and ξt, whereas log g was derived from
Balmer lines (Gray 2005). This approach is limited by stel-lar rotation, since line blending grows rapidly with v sin i. In the spectra of rapid rotators all the lines are blended and it is impossible to use individual iron lines for Teff, log g and
ξt determination. In such cases we assumed that the
abun-dances obtained from Fe i and Fe ii lines are the same for the correct Teff, log g and ξt. The analysis relies on the same
physics, regardless of rotation. The only difference is that for slow and moderate rotators we can use separate iron lines, including weak lines, to calculate the atmospheric parame-ters. For rapid rotators we are comparing iron abundances derived from broader spectral regions. Typically such re-gions contain many iron lines, both neutral and ionised. Of course, in such cases, stronger lines have more influence on the result.
Having derived Teff, log g and ξt, the determination
of abundances could be performed. The analysis of chem-ical abundances began with the selection of spectral re-gions suitable for abundance analysis. The length of a cho-sen part depended mainly on v sin i. For slowly rotating stars (v sin i < 40 km s−1), short sections covering only one
or a few blended spectral features were used. For stars with v sin i > 40 km s−1 we used broader spectral ranges
re-normalised by comparison with theoretical spectra, if nec-essary. The next step was line identification in the chosen region. In the case of rapidly rotating stars, where all lines are blended, only the most important elements producing spectral features were considered. In our method we can take into account all elements which have lines in the cho-sen spectral region. Elements that have little or no influence on the spectra are included in the analysis, but no attempt is made to calculate their abundances. The stellar rotation and signal-to-noise ratio of the spectrum dictate for which elements the abundance analysis is performed.
The line list used is that of Castelli & Hubrig (2004),
In our analysis we do not take into account macrotur-bulence, whose influence on the line profile is degenerate with v sin i. The effect of macroturbulence on F stars was discussed in detail by Fossati et al. (2011), who found that stronger lines required higher macroturbulent velocities and interpreted this as the effect of unmodelled depth-dependent velocities in the atmosphere. Since these are not observable in A stars, the required macroturbulent velocities remain un-certain, but the effect of macroturbulence is mainly limited to v sin i. The other parameters can be slightly affected, es-pecially in case of slowly rotating stars (Fossati et al. 2011). The v sin i values of slow rotators may be overestimated due to non-inclusion of macroturbulence. However, for v sin i > 50 km s−1 the effect of modest (e.g. 10 km s−1)
macroturbu-lence is negligible at our resolution and signal-to-noise. The atmospheric parameters obtained from our anal-ysis are given in Table 3, and the abundances of analysed elements are given in Table 4.
4.3 Discussion of uncertainties
The derived atmospheric parameters and chemical abun-dances are influenced by errors from a number of sources. First of all, the adopted atmosphere models and synthetic spectra were calculated taking into account several simpli-fications, e.g. LTE, plane parallel geometry (1-D), and hy-drostatic equilibrium (Kurucz 1993a), instead of a 3-D and non-LTE approach (e.g. Bergemann et al. 2012).
Recently, the non-LTE line formation for Fe i and Fe ii for stars with Teff between 6500 K and 8500 K and log g
be-tween 3.0 and 4.0 dex was discussed by Mashonkina (2011). In this paper the non-LTE calculations were performed with a complete model atom, as described therein. The depar-tures from LTE caused the depletion of total absorption in the Fe i lines and positive abundance corrections, leading to an underestimation of Fe abundance in LTE calculations. However, the corrections to LTE abundances were found to be smaller than 0.1 dex for main-sequence stars. For Fe ii, the non-LTE effect was again found to be negligible, with corrections of −0.01 to −0.03 dex over the whole range of considered stellar parameters. Most stars in our sample have effective temperatures lower than 8500 K. The non-LTE cor-rections of Fe abundances for these stars less than 0.1 dex.
Table 4.Abundances of chemical elements for a sample of analysed stars (on the scale in which log ǫ(H) = 12). The median value is given; standard deviations were calculated only if the number of analysed parts of a spectrum was greater than three. In other cases the average value calculated from standard deviations of other elements are given. Number of analysed parts is given in brackets. The full table is available in the electronic version.
KIC 10263800 KIC 10264728 KIC 10355055 KIC 10533616 KIC 10549371 KIC 10555142 KIC 10590857 C 8.85±0.14 (1) 8.48±0.12 (2) 8.90±0.12 (2) 8.38±0.07 (7) 8.31±0.14 (14) 8.78±0.16 (5) 8.36±0.19 (5) N − − − − 8.33±0.14 (1) − − O 8.74±0.14 (2) 9.04±0.12 (1) 8.44±0.12 (1) 8.92±0.14 (2) 8.83±0.14 (1) − 8.91±0.17 (1) Ne − − − − − − − Na − 6.60±0.12 (1) 7.10±0.12 (1) 6.89±0.14 (2) 6.46±0.14 (2) 6.63±0.18 (1) 6.22±0.17 (1) Mg 7.68±0.14 (1) 8.01±0.12 (4) 7.28±0.19 (3) 7.98±0.10 (6) 7.56±0.13 (8) 7.64±0.18 (2) 7.57±0.10 (4) Al − − − − − − − Si 6.80±0.14 (2) 7.94±0.12 (2) 7.50±0.12 (2) 7.60±0.18 (5) 7.54±0.20 (21) 7.52±0.29 (5) 7.56±0.25 (8) P − − − − − − − S − − − − 7.32±0.01 (3) − 7.29±0.17 (1) Cl − − − − − − − K − − − − − − − Ca 6.62±0.14 (2) 6.64±0.12 (4) 6.61±0.16 (8) 6.65±0.16 (15) 6.54±0.16 (25) 6.30±0.23 (7) 6.67±0.23 (4) Sc 4.03±0.14 (1) 3.09±0.12 (3) 2.96±0.11 (3) 3.10±0.16 (5) 3.24±0.10 (9) 2.91±0.21 (4) 3.28±0.13 (6) Ti 4.43±0.14 (3) 5.07±0.16 (8) 5.05±0.18 (9) 5.22±0.17 (16) 5.06±0.15 (47) 5.05±0.15 (8) 5.27±0.20 (14) V − 2.79±0.12 (1) − − 4.43±0.11 (9) 4.67±0.18 (2) − Cr 5.46±0.14 (2) 5.69±0.19 (5) 5.60±0.04 (6) 5.86±0.09 (8) 5.53±0.16 (26) 5.69±0.18 (2) 5.67±0.18 (16) Mn − 5.60±0.12 (2) 5.29±0.12 (1) 5.57±0.14 (2) 5.35±0.16 (10) 5.43±0.04 (3) 5.59±0.17 (2) Fe 6.93±0.15 (5) 7.54±0.12 (11) 7.29±0.11 (17) 7.70±0.11 (36) 7.32±0.09 (101) 7.45±0.14 (20) 7.54±0.09 (36) Co − − − − 5.88±0.14 (2) − − Ni − 6.36±0.07 (4) 6.11±0.11 (6) 6.35±0.23 (11) 6.19±0.18 (41) 6.27±0.13 (6) 6.41±0.16 (13) Cu − − − − 4.41±0.14 (1) − − Zn − − − − 4.78±0.14 (2) − − Ga − − − − − − − Sr − 2.55±0.12 (1) 1.67±0.12 (1) 2.96±0.14 (2) 3.23±0.14 (1) 1.36±0.18 (1) − Y − 3.14±0.12 (1) 2.24±0.12 (1) 2.82±0.14 (1) 2.51±0.17 (10) 3.03±0.29 (3) 2.85±0.17 (1) Zr − − − − 3.18±0.20 (10) 2.98±0.18 (1) − Ba − 3.78±0.12 (2) 3.11±0.12 (1) 2.48±0.20 (3) 2.75±0.13 (3) 2.69±0.18 (2) 2.43±0.17 (2) La − − − − 1.60±0.14 (2) − − Ce − − − − 1.69±0.14 (2) − − Pr − − − − − − − Nd − − − − 1.72±0.20 (5) − −
Application of this correction would change log g determi-nations from the ionisation balance of Fe i and Fe ii lines. If we add non-LTE corrections to the obtained abundances of Fe i, the determined surface gravity would be higher by about 0.1 dex. However, in most of our investigated stars, high projected rotational velocities prevents us from obtain-ing abundances of Fe i and Fe ii separately. Therefore, we did not include the non-LTE corrections in the present analysis. Other important factors affecting spectral analysis are atomic data (Kurucz 2011), quality (resolution, S/N), wave-length range of the observed spectra and their normalisation. It is quite easy to normalise the optical spectrum of an A star with v sin i < 40 km s−1. The difficulty increases for heavily blended spectra of stars with v sin i much higher than this value, even for high-resolution and high S/N data.
All the above-mentioned factors influenced our de-rived atmospheric parameters and chemical abundances. The chemical abundances are also affected by inaccurate atmospheric parameters. The influence of errors in atmo-spheric parameters on the derived chemical abundances can be checked by perturbing the synthetic spectrum by the adopted step size in the grid of atmospheric models. For example, ∆Teff= 100 K leads to changes in abundances
smaller than 0.1 dex in most cases. Similarly, ∆log g = 0.1 changes chemical abundance by about 0.05 dex, and ∆ξt=
0.1 km s−1 changes abundances by 0.15 dex at most. It should be noted here that the uncertainty on the microtur-bulence velocity increases with v sin i, from 0.1 km s−1 for
small and moderate velocities, to 0.4 km s−1 for rapid rota-tors. Chemical abundances determined for rapidly rotating stars are affected by the greatest uncertainty. The combined errors of chemical abundances were calculated as:
∆ log ǫtotel = q (∆ log ǫTeff el )2+ (∆ log ǫ log g el )2+ (∆ log ǫ ξt el)2
In most cases ∆ log ǫtot
el was less than 0.20 dex.
4.4 Comparison of results from different methods 4.4.1 Interstellar reddening
The E(B − V ) values from the KIC, E(B − V )(KIC), and those determined here from the equivalent widths of sodium D2 lines, E(B − V )(Na), are given in Table 3. The
distributions of these parameters are presented in Fig. 1. It is clear that the photometric interstellar reddening given in the KIC is higher than E(B − V )(Na). The average value of E(B − V )(KIC) is equal to 0.09 mag, whereas from sodium lines it is 0.03 mag. The reddenings obtained from Na D2 lines are lower than 0.10 mag for all stars, except for
Figure 1.Distributions of E(B − V )(Na) (left panel) and E(B − V )(KIC) (right panel). Gaussian fits are shown by solid lines. Central values, arithmetic means and standard deviations of both distributions are indicated in figures.
Figure 2.Left panel: differences ∆E(B − V ) = E(B − V )(Na) − E(B − V )(KIC) as a function of Teff(spec). A linear function is fitted.
The dotted horizontal line indicates a difference of ±0.03 mag. Right panel: the distribution of differences ∆E(B − V ). Arithmetic mean and standard deviation of the distribution are indicated in the figure.
for which they equal 0.14 mag. We can see from Fig. 2 that the differences between interstellar reddenings obtained from Na D2 lines and those listed in KIC slightly increase
with effective temperature. As explained by Brown et al. (2011), the values of E(B − V ) given in the KIC were approximated using a simple model of dust distribution and with an adopted disk scale-height of 150 pc – larger than suggested by earlier estimates (e.g. Koppen & Vergely 1998; Marshall et al. 2006). Brown et al. (2011) assumed a wave-length dependence of reddening taken from Cardelli et al. (1989) and used RV = 3.1 in all cases. As described by
Brown et al. (2011), reddening was precomputed for all filters and for a range of stellar parameters. Then, the authors calculated the reddening vectors for typical stars in the Kepler field (Teff= 5000 K, log g = 4.0, [M/H]= 0.0) and
applied them to all stars. Values of interstellar reddening influenced the other parameters determined from KIC photometry, especially the effective temperatures. For this
reason, it is necessary to check the available KIC E(B − V ) values by determining them with an independent method.
4.4.2 Effective temperatures
The effective temperatures determined using the three meth-ods described in Sect. 4 are presented in Table 3 and com-pared in Fig. 3, where the differences between Teff(spec)
ob-tained from the analysis of the high-resolution spectra and values taken from the KIC, Teff(KIC), and from SED fitting,
Teff(SED), are shown as a function of Teff(spec).
For most of the stars, the values of Teff(spec)−Teff(KIC) agree to within ±300 K.
Differ-ences larger than 500 K occur for stars with peculiarities identified in their spectra (KIC 3231985, 4150611, and 8703413) and for some rapidly rotating stars with v sin i exceeding 100 km s−1 (KIC 11506607, 3347643, 4681323,
Figure 3. A comparison of effective temperatures derived by different methods. In the panel (a) the differences ∆Teff=Teff(spec)−Teff(KIC) are plotted as filled circles, whereas ∆Teff=Teff(spec)−Teff(H2014) are shown as stars. In the panel
(b) ∆Teff=Teff(spec)−Teff(SED) are plotted. The stars described in the text are indicated by names and open circles. The distributions
of differences ∆Teff and their characteristics are given in the right panels.
5471091, and 6450107). The Spearman’s and Kendall’s rank correlation coefficients between Teff(spec)−Teff(KIC)
and Teff(spec) are equal to 0.25 and 0.17, respectively,
indicating very low correlation. The Teff(KIC) values are
underestimated for stars hotter than about 7500 K. For stars with lower effective temperatures the agreement is better and the outliers can be explained by rapid rota-tion or chemical peculiarities in their spectra, which can influence the determination of atmospheric parameters. This result is in agreement with the previous spectro-scopic determinations of atmospheric parameters given by Molenda- ˙Zakowicz et al. (2011), Lehmann et al. (2011) and Tkachenko et al. (2013b), where the systematic un-derestimations of the KIC Teff values for stars hotter than
about 7000 K were pointed out. These deviations probably originate from incorrect values of interstellar reddening.
Recently, Huber et al. (2014) (hereafter H2014) pub-lished a new catalogue of revised effective temperatures for 196, 468 Kepler stars. The catalogue is based on a compilation of literature values for atmospheric proper-ties (Teff, log g and [Fe/H]) derived from different
meth-ods, including photometry, spectroscopy, asteroseismology, and exoplanet transits. Effective temperature is available from the H2014 catalogue for all targets in our sample. In Fig. 3a we show the differences between Teff(H2014) and
Teff(spec). As one can see, there is a similar scatter in
differences [Teff(spec)−Teff(H2014)], as was the case for
Teff(spec)−Teff(KIC). For stars with Teff>8000 K, the
dif-ferences [Teff(spec)−Teff(H2014)] are lower than in the case
of Teff(KIC), which means that the Teff(H2014) values are
higher than Teff(KIC) for such stars. Neither Teff(KIC)
nor Teff(H2014) are systematically underestimated between
7000 and 8000 K.
Figure 3 b compares Teff(spec) with that determined
from the spectral energy distribution, Teff(SED). The
consistency between these two methods is good: there is no significant trend of Teff(spec)−Teff(SED) with effective
tem-perature. The Spearman’s and Kendall’s rank correlation coefficients between Teff(spec)−Teff(SED) and Teff(spec)
are equal to 0.23 and 0.16, respectively. This shows that the correlation is smaller than between Teff(spec)−Teff(KIC)
and Teff(spec). The differences exceed 500 K only for three
rapidly rotating stars: KIC 5294231, 5786771, and 8915335. The Teff(SED) analysis supports the claimed accuracy of
our spectroscopic temperatures.
4.4.3 Surface gravities
Figure 4 compares the log g(spec) values obtained from high-resolution spectroscopy with those taken from the KIC, log g(KIC), and the H2014 catalogue, log g(H2014). For most stars the surface gravities are consistent to within ±0.2 dex. The distribution of differences log g(spec)−log g(KIC) and log g(spec)−log g(H2014) does not indicate any trend with surface gravity or effective temperature. The higher differences were determined mostly for rapidly rotating stars with v sin i > 100 km s−1. Irrespective of rotational
Figure 4.Left panel: the differences ∆log g = log g(spec)−log g(KIC) (filled circles) and ∆log g = log g(spec)−log g(H2014) (stars) as a function of Teff(spec). Right panel: the distributions of differences ∆log g and their characteristics.
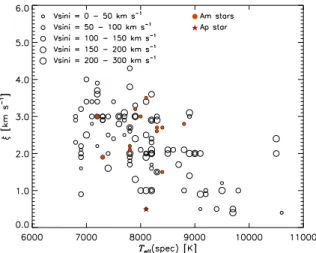
Figure 5.Microturbulent velocities as a function of effective tem-perature. Non-CP stars are shown as open circles, Am and Ap stars as filled circles and star symbol, respectively. Sizes of sym-bols for non-peculiar stars depend on rotational velocity, see the legend.
velocity, spectroscopic surface gravity values determined from iron lines are adopted for subsequent analysis of these stars. The high-resolution spectra are much more sensitive to log g than the photometric indices upon which the KIC is based.
4.4.4 Microturbulent velocities
In Fig. 5 the derived values of microturbulence are shown as a function of effective temperature, with different symbols for CP and non-CP stars. The values of ξtobtained decrease
towards higher effective temperature. For stars with Teff
be-tween 7000 and 8000 K, ξt is within the range 2 − 4 km s−1,
for those with Teff between 8000 and 9000 K, ξt is
approxi-mately 2 km s−1, while for even higher values of Teff
micro-turbulence decreases to about 0.5−1 km s−1. This behaviour
is in agreement with the results of Gebran et al. (2014),
based on the analysis of high-resolution spectroscopic data of 61 A field stars, 55 A and 58 F in open clusters (Pleiades, Coma Berenices, Hyades and Ursa Major). The results are also in agreement with Smalley (2004). The determined mi-croturbulent velocities of CP stars are similar to those of non-CP stars. According to Landstreet et al. (2009) the mi-croturbulent velocity in Am stars is generally higher than in normal stars. This tendency is not seen in our sample. How-ever, in Landstreet et al. (2009) it is not possible to directly compare the microturbulence velocities of the Am stars with normal stars of the same temperature, because, as Murphy (2014) notes, the temperature distributions do not overlap. We conclude that in our sample the distribution of micro-turblent velocities among the Am stars appears to be the same as that of normal stars. As shown by Landstreet et al. (2009), the line profiles of slowly rotating Am stars show dif-ferent asymmetries and anomalies caused by velocity fields. These asymmetries affect line shapes and equivalent widths and lead to a higher microturbulence velocities in compari-son with chemically normal A stars. However, since the anal-ysis of Landstreet et al. (2009) is based on a sample of stars with low projected rotation velocity (v sin i < 12 km s−1),
it cannot be ruled out that this phenomenon is diluted for faster rotators. It is beyond the scope of this paper to ex-amine this effect in more detail.
As expected, the microturbulent velocity determined for the Ap star is small, ξt= 0.5 ± 0.2 km s−1(e.g. Folsom et al.
2007).
4.4.5 Iron abundances
Figure 6 compares the iron abundances derived from high-resolution spectra, log ǫ(Fe)(spec), with those from the KIC, log ǫ(Fe)(KIC). As can be seen, the differences log ǫ(Fe)(spec)− log ǫ(Fe)(KIC) are strongly correlated with the iron abundance. The same situation occurs for differ-ences between log ǫ(Fe)(spec) and log ǫ(Fe)(H2014), taken from the H2014 catalogue. The Spearman’s and Kendall’s rank correlation coefficients are equal to 0.74 and 0.57, re-spectively. Only four stars (KIC 4150611, 6951642, 7119530, 7299869; the encircled symbols in Fig. 6) do not follow this
Figure 6.Left panel: the differences ∆log ǫ(Fe) = log ǫ(Fe)(spec) − log ǫ(Fe)(KIC) as a function of log ǫ(Fe)(spec). Non-CP and CP stars are plotted by different symbols as explained in the legend. The four most deviant objects are encircled (see the description in the text). The line is the linear fit to all points. Right panel: the distribution of differences ∆ log ǫ(Fe) and their characteristics.
general tendency. KIC 4150611 is a possible triple system classified as F1 V with weak metal lines suggesting spectral type A9. This classification was not confirmed by detailed analysis of chemical abundances, as iron abundance is only 0.16 dex lower than the solar abundance from Asplund et al. (2009). The other elements do not show significant devia-tions from the solar values either. This effect can be caused by analysing a triple object as a single one. Additionally, the rotational velocity of this star is 128 ± 5 km s−1. For
a star with Teff= 7400 K, this causes strong blending of
all metal lines. It is worth mentioning that the differences between effective temperatures derived from the KIC pho-tometry, SED, and high-resolution spectrum are also high for this star. Rapid rotation (v sin i > 120 km s−1) is also likely to be responsible for the deviations in chemical abun-dances for the other three stars. Additionally, the analy-sis of high-resolution spectra resulted in higher iron abun-dances for KIC 4768731, an Ap (SrCrEu) star for which a high iron abundance is expected. The same trend of log ǫ(Fe)(spec)− log ǫ(Fe)(KIC) with iron abundance was noticed by Tkachenko et al. (2013b). We found no correla-tion of log ǫ(Fe)(spec)− log ǫ(Fe)(KIC) differences with ef-fective temperature or surface gravity.
5 PROJECTED ROTATIONAL VELOCITIES Rotational velocity is one of the fundamental parameters that influences stellar evolution. It has been frequently demonstrated that stellar rotation strongly depends on spec-tral type, with most A stars being rapid rotators (e.g. Royer 2009; Abt 2009).
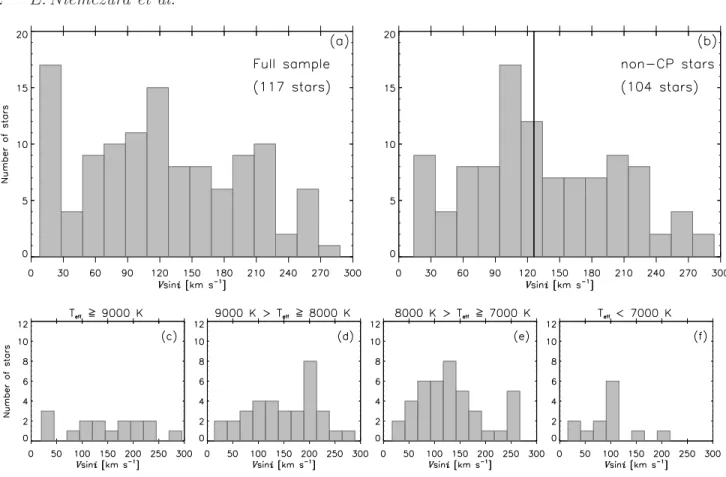
Figure 7 a shows the distribution of derived values of vsin i. The stars analysed have projected rotational veloc-ities ranging from 8 to about 280 km s−1. Stars with v sin i
lower than 40 km s−1 are considered here as slowly rotating stars. There are 21 such objects in our sample. The obvious members of this group are all either Am or Ap (CrSrEu) stars. These objects will be thoroughly discussed in the next section. Another slowly-rotating star, KIC 3231985, also shows small peculiarities its spectrum and was classified as A4 IV Ca weak (A3). Figure 7 b shows the distribution of
vsin i for all non-CP stars. One can see that the peak for slow rotation has disappeared and the mean value of v sin i for this sample is equal to 134 km s−1. The maximum of the distribution is located around 110 km s−1. This result is
con-sistent with the rotational velocities of A stars given in the literature (Royer 2009). Abt (2000) pointed out that most of the normal A0–F0 main-sequence stars have equatorial rota-tional velocities greater than 120 km s−1. Panels c-f in Fig. 7
show distributions of v sin i for stars with different ranges of Teff. Most of the stars with Teff<7000 K have projected
rotational velocities below 100 km s−1, consistent with the
predictions for the late A and early F stars (Royer 2009). There are nine slowly rotating stars in our sam-ple that were not classified as CP objects. Three of them were classified as F stars: KIC 6519869 (F1 IV-Vs), KIC 7661054 (F2.5 V), and KIC 4077032 (F2 IIIs). On aver-age, F stars have smaller rotation velocities than A stars. The rotation velocity drops rapidly from high values (> 100 km s−1) for late A stars to low values (< 20 km s−1)
for late F stars (Noci, Pomilia, & Ortolani 1986; Royer 2009). All slowly rotating non-CP F stars have abun-dance patterns close to solar, except for some elements. For KIC 4077032 heavy and rare-earth elements are overabun-dant, while for KIC 6519869 only abundances of elements derived from weak blends are significantly different from solar. Four of the slow rotators were classified as mid-A stars: KIC 10721930 (A5 IV), KIC 3231985 (A4 IV Ca weak (A3)), KIC 5355850 (A5 IVs), and KIC 8386982 (A4 IV/V:). For KIC 10721930 heavy and rare-earth elements are abundant. For KIC 3231985 almost all elements are over-abundant. This star has been identified as a binary (e.g. Dommanget & Nys 2002; Fabricius et al. 2002). Two ob-jects were classified as early-A stars: KIC 12153021 (A2 IV-V) and KIC 12736056 (A0.5 IIIs).
The occurrence of non-CP A stars with low v sin i has been discussed in many papers (e.g. Takeda et al. 2008; Abt 2009; Royer et al. 2014). Abt (2009) presented this problem in detail, considereding binarity and the amount of time nec-essary for slow rotators to become Ap or Am stars by a diffu-sion mechanism (see also Talon, Richard, & Michaud (2006) and Michaud & Richer (2013)). The frequency of binaries among A stars turned out to be normal. On the other hand,
Figure 7.The distribution of rotational velocities for all analysed stars (panel a) and for all non-CP stars (panel b). Panels c, d, e, and f show distributions of v sin i for stars with Teff>9000 K, 9000 >Teff>8000 K, 8000 >Teff>7000 K, and Teff<7000 K, respectively.
the time-scale for developing peculiarities is rapid for Ap(Si), Ap(HgMn), and Am stars, but slow for Ap(SrCrEu) stars, for which it takes about half of their main-sequence lifetime. According to Abt (2009), if a constant formation rate of field A stars is assumed, about half of the potential Ap(SrCrEu) stars will appear as normal slow rotators and that is why there are normal slow rotators in the A0-A3 group. There-fore, slowly rotating, non-CP stars could be Ap stars that already underwent magnetic braking, but do not yet show chemical peculiarity. Accordingly, the five slowly rotating stars from our sample (KIC 10721930, 12153021, 12736056, 5355850, and 8386982) might become Ap(CrSrEu) stars in the future.
A more probable reason for the low observed v sin i in some A stars is the projection effect. The influence of this effect on the spectral lines of Vega has been investigated by Gulliver et al. (1994). For many years Vega was consid-ered as a standard star with v sin i equal to 24 km s−1 (e.g. Royer et al. 2007). Gray (1985) first suggested that Vega is a rapid rotator seen pole-on. Gulliver et al. (1994) anal-ysed high-resolution, high signal-to-noise spectra of Vega and found out two distinct types of profiles. The strong lines exhibit classical rotational profiles with enhanced wings, but the weak lines have different, flat-bottomed profiles. Gulliver et al. (1994) usedATLAS9model atmospheres and SYNTHEsynthetic spectra to model the spectral lines and confirmed that Vega is in fact a rapidly rotating, nearly pole-on star with a gradient in temperature and gravity in the photosphere. The equatorial rotational velocity of Vega
(Veq= 245 ± 15 km s−1) and inclination (5.1◦±0.3) were
de-rived by fitting the flat-bottomed line profiles of Fe i 4528˚A and Ti ii 4529˚A. To investigate the effect that low incli-nation has on the observed spectrum of a rapid rotator, high-resolution (R > 70000), and very high signal-to-noise (S/N ∼ 1000) spectra are necessary. Takeda et al. (2008) found that lines of ionized elements in the spectrum of Vega show classical profiles, while the lines of neutral elements display very characteristic shapes: from flat-bottomed to re-versed profiles, due to the temperature gradient from the pole to the equator.
Royer et al. (2012) analysed a sample of A stars to find possible rapid rotators seen pole-on. The line profiles in each spectrum were analysed globally, using a Least-Square Deconvolution (LSD) method (Donati et al. 1997; Kochukhov et al. 2010) to enhance the signal and recover the broadening function. To investigate the possibility that the slow rotators in our sample are in fact rapid rota-tors seen pole-on, we followed the methods presented by Gulliver et al. (1994) and Takeda et al. (2008). We used the revised LSD code (Tkachenko et al. 2013a) to calculate the LSD profiles for intrinsic line depths from 0 to 0.6 and from 0.6 to 1.0, which enables the distinction between the line profiles of strong and faint lines in the spectra of the slow rotators. All line lists were computed with the individual parameters of Teff, log g, v sin i, ξtand [M/H] determined in
this paper. The boundary for the separation of line depths was chosen so that the S/N in both LSD profiles, computed from weak and strong lines, were approximately equal. The
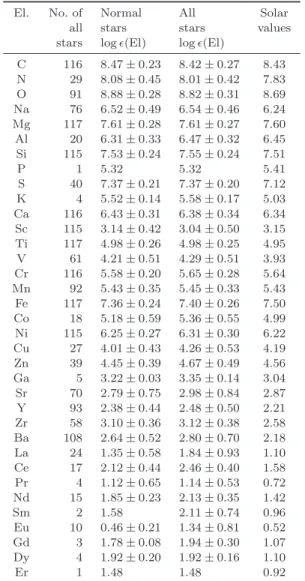
Table 5.Average abundances for the entire sample and the non-CP stars compared to the solar values of Asplund et al. (2009).
El. No. of Normal All Solar
all stars stars values
stars log ǫ(El) log ǫ(El)
C 116 8.47 ± 0.23 8.42 ± 0.27 8.43 N 29 8.08 ± 0.45 8.01 ± 0.42 7.83 O 91 8.88 ± 0.28 8.82 ± 0.31 8.69 Na 76 6.52 ± 0.49 6.54 ± 0.46 6.24 Mg 117 7.61 ± 0.28 7.61 ± 0.27 7.60 Al 20 6.31 ± 0.33 6.47 ± 0.32 6.45 Si 115 7.53 ± 0.24 7.55 ± 0.24 7.51 P 1 5.32 5.32 5.41 S 40 7.37 ± 0.21 7.37 ± 0.20 7.12 K 4 5.52 ± 0.14 5.58 ± 0.17 5.03 Ca 116 6.43 ± 0.31 6.38 ± 0.34 6.34 Sc 115 3.14 ± 0.42 3.04 ± 0.50 3.15 Ti 117 4.98 ± 0.26 4.98 ± 0.25 4.95 V 61 4.21 ± 0.51 4.29 ± 0.51 3.93 Cr 116 5.58 ± 0.20 5.65 ± 0.28 5.64 Mn 92 5.43 ± 0.35 5.45 ± 0.33 5.43 Fe 117 7.36 ± 0.24 7.40 ± 0.26 7.50 Co 18 5.18 ± 0.59 5.36 ± 0.55 4.99 Ni 115 6.25 ± 0.27 6.31 ± 0.30 6.22 Cu 27 4.01 ± 0.43 4.26 ± 0.53 4.19 Zn 39 4.45 ± 0.39 4.67 ± 0.49 4.56 Ga 5 3.22 ± 0.03 3.35 ± 0.14 3.04 Sr 70 2.79 ± 0.75 2.98 ± 0.84 2.87 Y 93 2.38 ± 0.44 2.48 ± 0.50 2.21 Zr 58 3.10 ± 0.36 3.12 ± 0.38 2.58 Ba 108 2.64 ± 0.52 2.80 ± 0.70 2.18 La 24 1.35 ± 0.58 1.84 ± 0.93 1.10 Ce 17 2.12 ± 0.44 2.46 ± 0.40 1.58 Pr 4 1.12 ± 0.65 1.14 ± 0.53 0.72 Nd 15 1.85 ± 0.23 2.13 ± 0.35 1.42 Sm 2 1.58 2.11 ± 0.74 0.96 Eu 10 0.46 ± 0.21 1.34 ± 0.81 0.52 Gd 3 1.78 ± 0.08 1.94 ± 0.30 1.07 Dy 4 1.92 ± 0.20 1.92 ± 0.16 1.10 Er 1 1.48 1.48 0.92
wavelength range used (4890 to 5670 ˚A) included the region between Hβ and the first strong telluric lines. We found no significant difference in profile shapes for any of the in-vestigated stars, which can be attributed to the insufficient quality of our spectra.
6 CHEMICAL ABUNDANCES
In Table 5 the average abundances for the stars in our sam-ple are compared with the photospheric solar values of Asplund et al. (2009). Only the abundances of Mg, Ti, and Fe were derived for all stars. We excluded the O i 7771-5 ˚A triplet from our analysis and used other O i lines (e.g., 5331, 6157, 6158, and 6456 ˚A) that are much less affected by non-LTE effects (e.g. Przybilla et al. 2000). Lines of heavy ele-ments except for Sr, Y, Ba, and rare-earth eleele-ments are very sparse in spectra of A stars. Abundances of these elements were investigated only for slowly and moderately rotating stars and in most cases, only one or two blends were avail-able.
In Fig. 8, the determined average abundances for all stars are compared with the solar abundances of
Asplund et al. (2009). In Fig. 9, histograms show the dis-tribution of abundances of the iron-peak elements, Ti, Cr, Mn, Fe, Sc, and Ca. The average abundances of most of the light and iron-peak elements are close to the solar val-ues. The largest differences occur for the elements repre-sented by weak blends only. Naturally, the abundances of some elements determined for CP stars are significantly dif-ferent from the solar values. For instance, the highest Cr abundance, log ǫ(Cr) = 7.17 ± 0.26, was determined for the Ap CrSrEu star KIC4768731, and the lowest abundances of Sc were derived for Am stars.
We found that apart from 14 CP stars, there are two low-metallicity objects in our sample, KIC 9828226 and KIC 8351193. KIC 9828226 was classified as an A1.5 V star for which the metal line spectrum is weak and matches A0 type. The moderate rotational velocity, 88 ± 9 km s−1,
al-lowed us to obtain the abundances of Mg, Si, Ca, Sc, Ti, Cr, Fe, Ni, Sr, C, and N. All these elements are underabun-dant. KIC 8351193 (HD 177152) was classified as a B9.5: star. With a rotational velocity of 162 km s−1 the spectrum
of this star is almost featureless. It was possible to determine only the abundances of Mg, Ti, and Fe on the basis of single lines. All these elements are underabundant. However, be-cause of the high v sin i, a small error in continuum location significantly changes the results. Tkachenko et al. (2013b) analysed the high-resolution TLS spectrum of this star and obtained Teff= 9980 ± 250 K and log g = 3.80 ± 0.15 dex
from the analysis of Balmer lines. The effective temper-ature and surface gravity obtained in the present paper, Teff(spec) = 10500 ± 250 K and log g(spec) = 4.1 ± 0.1 are
higher than given by Tkachenko et al. (2013b). The high rotational velocities obtained in both papers are consistent within the error bars. Although Tkachenko et al. (2013b) also found a low metallicity for this star, their iron abun-dance of 5.15 dex is much lower than the value obtained in this paper (6.24 dex). The difference is caused mostly by differences in effective temperatures. The effective tempera-tures Teff(SED) and Teff(spec) of KIC 8351193 obtained in
this paper are consistent with each other and with the values 10210 K and 11000 ± 400 K, determined from the SED and Str¨omgren photometry by Balona et al. (2011). On the basis of Kepler data, Balona et al. (2011) classified KIC 8351193 as a “rotationally modulated” star with period of 0.56767 d. We confirm this classification (see Sect. 7).
6.1 Correlation of chemical abundances with other parameters
The analysis of a large sample of stars allowed us to search for correlations between the abundances of chemical ele-ments and stellar parameters. We analysed separately three groups: the CP stars formed one group, and the normal stars were separated into hotter (Teff>7200 K) and cooler
(Teff<7200 K) populations. For some elements, large
scat-ter or a small number of stars with descat-termined abundances prevents the correlation analysis. This is the case for most of the heavy and rare-earth elements. Comparing samples with hotter and cooler stars, we found a larger scatter of abundances for hotter stars, especially for v sin i higher than 150 km s−1. The same effect was observed for the abundances
Figure 8.The difference between the obtained chemical abundances and solar values (Asplund et al. 2009) as a function of the atomic number. The results for non-CP stars are given as filled circles; for CP stars as filled stars.
Figure 9.The distributions of the abundances of the elements: Fe, Sc, Ti, Cr, Mn, and Ca in the analysed sample of stars. The solar abundances taken from Asplund et al. (2009) are shown as vertical lines.
(Gebran & Monier 2008) and Coma Berenices open clusters (Gebran, Monier, & Richard 2008).
No significant correlations of element abundances with effective temperature and surface gravity were found in the normal stars, with absolute values of Spearman’s and Kendall’s correlation coefficients less than ∼ 0.20. No signif-icant correlations between the abundances of most elements
and rotational velocity were found either. Typical relations for some elements are presented in Fig. 10. A small posi-tive correlation was found between the abundances of C and vsin i for hotter stars, with correlation coefficients of about 0.3–0.4 according to both considered statistics. In an inves-tigation of 23 normal A and F stars, Fossati et al. (2008) found no correlation between abundances and rotational
Figure 10.Abundances of different elements as a function of rotational velocity for CP stars (triangles), non-CP stars with Teff>7200 K
(filled circles), and non-CP stars with Teff<7200 K (open circles).
velocity. A larger sample was examined by Takeda et al. (2008), who found negative correlations for C, O, Ca and strong positive correlations for the Fe-peak elements plus Y and Ba, with rotational velocity.
Significant positive correlations with iron abundance in normal stars were found for almost all elements (see Fig. 11). The highest correlation coefficients were obtained for light elements Na, Mg and Si, iron-peak elements Ca, Ti, Cr, Mn, Ni, and heavy elements Sr and Ba, all of which have correlation coefficients larger than 0.50. Less significant pos-itive correlations were obtained for Sr and Y, for which both
correlation coefficients were smaller than 0.40. Takeda et al. (2008) also found strong positive correlations between the abundances of Si, Ti and Ba, and that of Fe.
We classified 21 CP stars in our sample, including 17 Am stars, one Ap CrSrEu, two λ Boo stars and one He-strong B star. We checked for correlations between abun-dances in Am stars and their atmospheric parameters, iron abundances, and rotational velocities. The abundances of most chemical elements appeared to be independent of the effective temperature. The negative correlation determined for O and the positive correlations found for Cu, Zn, and Zr
Figure 11.Abundances of different elements as a function of iron abundance for CP stars (triangles), non-CP stars with Teff>7200 K
(filled circles), and non-CP stars with Teff<7200 K (open circles).
could be caused by the small sample size. We found no cor-relations between abundances and surface gravity. On the other hand, the abundances of Na, Si, Ti, V, Cr, Mn, Ni, Cu, and rare-earth element La were all positively correlated with the iron abundance (Fig. 11). The only element found to be negatively correlated with iron was Zr, with a correla-tion coefficient of −0.20, according to Spearman’s statistic. The abundances of many elements were also found to be strongly correlated with that of iron for non-CP stars.
The correlation between Na and Fe abundances was discussed by Takeda et al. (2012), who performed a
non-LTE analysis of the abundances of alkali elements (Li, Na, and K) determined from the Li i 6708 ˚A, Na i 5682/5688 ˚A, and K i 7699 ˚A lines for 24 slowly rotating A stars (v sin i < 50 km s−1) in the broad temperature range 7000 K < Teff<10000 K. Many of these stars showed Am
peculiar-ities to different degrees. They found a significant trend of Na abundances with Fe, independent of Teff. This means
that Na becomes enriched along with Fe in accordance with the degree of Am peculiarity. The same trend was derived for our sample of stars with a Spearman’s correlation coef-ficient of +0.76. The positive correlation of Na abundance
Table 6.CP stars investigated in this work. KIC number HD number SpC (new)
New Am stars
3441230 kA2hA5mF0 V Am
5199439 225365 kA3hA5mA5 (IV)s Am: 5200084 225410 kA3hA6mF1 (IV) Am
5633448 225463 kA3hA4mA7 V Am
6292398 kA3hA7mA7 V Am:
6292925 kA2.5hA3mA7 (IV) Am:
7767565 196995 kA5hA7mF1 IV Am Known Am stars 8323104 188911 kA2.5hA6mA7 (IV) Am 8703413 187254 kA3hA5mA9 (IV)s Am 9117875 190165 kA3hF0.5mF3 (III) Am 9147002 180237 kA3hA5mF3 V Am 9204718 176843 kA3hA9mF1 (IV) Am Am stars in SB2 systems
8112039 187091 kA3hA5mA5 (IV)s Am:
4660665 kA3hA5mA5 IV Am:
6865077 kA3hA8mA6 (IV) Am
8692626 kA2hA4mA6 (IV) Am:
10616138 kA3hA6mA7 (IV)s Am:
Ap star
4768731 225914 A5 Vp (SrCrEu) λBoo stars
9828226 hA2kA0mB9 Vb.
5724440 187234 F0 Vnn weak met (A5)
with Fe disagrees with the predictions of atomic diffusion theory (e.g. Talon, Richard, & Michaud 2006). The same is true of Si abundances in Am stars, where we see a positive correlation of +0.80, according to Spearman’s statistic, that is not theoretically expected.
No significant correlations with v sin i were found for the abundances of any element, albeit in a small analysed range of v sin i. This contradicts the finding of Fossati et al. (2008) who analysed Am stars in the Praesepe cluster and reported strong correlations between abundances and v sin i of Am stars for all peculiar elements, except for Sc and Ti. One reason for the contradiction may be that the field stars analysed here have different ages and initial chemical com-position.
6.2 Chemically peculiar stars
There are two main classes of CP stars among the main-sequence Population I stars: the metallic line (Am) and the peculiar A stars (Ap). The Am stars manifest overabun-dances of most iron-peak elements and some heavy elements like Zn, Sr, Zr and Ba, and underabundances of Ca and Sc (Gray & Corbally 2009). These anomalies are explained by radiative diffusion in a non-magnetic star (e.g. Richard 2005; Talon, Richard, & Michaud 2006). Their projected ro-tational velocities are generally smaller than those of nor-mal A stars (Abt & Hudson 1971), which permits the seg-regation of elements by diffusion (Abt & Moyd 1973). The
majority of Am stars are members of close binary systems, where their slow rotation results from tidal braking.
The Ap stars form the second group of CP stars with overabundances of some elements, such as Si, Sr, Cr, and rare-earth elements (e.g. Kurtz et al. 2007a,b). Most of these stars have strong magnetic fields with polar field strengths typically of several kG (Hubrig et al. 2005; Kurtz et al. 2006). These stars have much slower rotational velocities than normal A and B stars. The distribution of chem-ical abundances changes both horizontally, with the for-mation of spots, and vertically, where they are stratified (e.g. Ryabchikova, Leone, & Kochukhov 2005; Ryabchikova 2014; Kochukhov et al. 2015). The abundance anomalies and spots are caused by diffusion in the presence of a mag-netic field (e.g. Babel 1993; Turcotte 2003).
There are other classes of CP stars, such as the λ Bootis stars, which are a class of metal-weak population I A stars (Gray & Corbally 2009). They are characterised by a weak Mg II 4481 ˚A line and solar abundances of C, N, O, and S (Gray 2005). Their projected rotational velocity distribu-tion matches that of normal A stars (Abt & Morrell 1995; Gray & Corbally 2009). The metal deficiencies of λ Boo can be distinguished from those of Population II stars on the basis of detailed abundance analyses (Paunzen et al. 2014). This suggests that the abundances of λ Boo stars are re-stricted to the outer layers of their atmospheres and can be explained by accretion of dust-depleted circumstellar mate-rial (Venn & Lambert 1990; King 1994).
There are 20 peculiar A stars in our sample (see Ta-ble 6), which are comprised of 17 Am stars, one Ap star (KIC 4768731), and two λ Bootis candidates (KIC 9828226 and KIC 5724440).
Four of the Am stars were previously known from multicolour photometry (Mendoza 1974) and spectroscopy (Floquet 1975). These are KIC 8323104, 8703413, 9117875, and 9204718. KIC 8323104 has a very low v sin i of 10 ± 1 km s−1, which enabled us to derive the abundances of alkali
elements Na and K. Determinations of Na and K abundances in the atmospheres of Am stars are rare (Takeda et al. 2012), but important for establishing the theory explaining the chemical abundance peculiarities of A stars. The effective temperature of KIC 9117875, at 7300 K, is low in compari-son with other Am stars in our sample. The star falls among the γ Dor stars in the Teff–log g diagram, but it is not a γ Dor
star (see Sect. 7). The fifth known Am star, KIC 9147002 was previously classified as an A2p star by Bertaud (1960). Its abundance pattern is typical of Am stars, with a significant Sc underabundance and strong overabundances of heavy el-ements. The Am stars KIC 8703413, 9117875 and 9204718, were also studied by Catanzaro & Ripepi (2014). Their re-sults are in agreement with the values obtained here, within the errors.
Six newly discovered Am stars are KIC 3441230, 5199439, 5200084, 5633448, 6292398, and 6292925. These have low v sin i and abundance patterns typical of Am stars. A seventh Am star is KIC 7767565, of spectral type kA5hA7mF1 IV, whose chemical abundances are not typi-cal, because Ca and Sc are overabundant. This star has a moderate v sin i of 64 ± 3 km s−1.
KIC 8112039 is a highly eccentric binary, also known as KOI-54 (Welsh et al. 2011; Burkart et al. 2012). Welsh et al. (2011) analysed the high-resolution spectrum
Figure 12.Chemical abundances of Am stars compared with the solar values (Asplund et al. 2009) as a function of the atomic number.
taken in quadrature and determined atmospheric param-eters of both components, finding Teff A and Teff B equal
to 8500 and 8800 K, and surface gravities log g = 3.8 and 4.1, respectively. Both stars appeared to be metal-rich, with [Fe/H] = 0.4 ± 0.2 dex. They also determined low v sin i val-ues for the components, at 7.5 and 4.5 km s−1. The
spec-trum investigated in this paper was taken in conjunction, so that the lines of both stars overlap. From the analysis of our spectrum we derived Teff= 8400 K, log g = 3.7 dex,
[Fe/H] = 0.0 ± 0.13 dex, and v sin i = 8 ± 1 km s−1.
Four other stars were classified as Am stars and be-long to SB2 binary systems: KIC 4660665, KIC 6865077, KIC 8692626, and KIC 10616138. These stars, together with KIC 8112039, will be analysed in a forthcoming paper (Catanzaro et al., in preparation).
The only Ap star in our sample, KIC 4768731, has the spectral type A5 Vp (SrCrEu). According to Mason et al. (2001), the star is the primary of a visual binary with a sep-aration of about 12 arcsec with V = 9.19 mag (primary) and 12.00 mag (secondary). Previously, KIC 4768731 was classi-fied as an A7 star (see Table 2), without indication of chemi-cal peculiarity. The chemichemi-cal pattern of KIC 4768731 is typ-ical for Ap (SrCrEu) stars, with significant overabundances of Cr and Sr (see Fig. 13). All Fe-peak elements, except for Sc, V, and Zn, are overabundant. Additionally, KIC 4768731 was discovered as a rapidly oscillating (roAp) star (Smalley et al., in preparation). Detailed spectral analysis of Ap stars requires taking into account stratification of the elements in their atmospheres. This effect has a substantial impact on spectral lines, so atmospheric parameters determined here from the ionisation and excitation equilibria and wings of hydrogen lines can be incorrect. Results of spectral analysis with stratification of chemical elements for KIC 4768731 will be presented by Niemczura, Shulyak et al. (in preparation). We classified two stars as probable λ Boo stars. The spectral type obtained for KIC 9828226 is hA2kA0mB9 Vb. Its hydrogen lines are very broad, the metal lines are weak, and the magnesium Mg ii 4481 line is especially weak when
Figure 13.Chemical abundances of the Ap star KIC 4768731 compared with the solar values (Asplund et al. 2009) as a function of the atomic number.
compared with the metal line type. The star has v sin i = 88 ± 9 km s−1. KIC 5724440 was given the spectral type
F0 Vnn (weak met (A5)). Its hydrogen lines are broad and shallow – typical for a rapid rotator – and are consistent with an F0 spectral type, whereas its metal lines are weak and are similar in strength to the A5 standard HD 23886. The Ca ii K line is broad but shallow, having the depth of the A3 V standard but the width of the A7 V standard. The moderate resolution spectrum of this star was analysed by Catanzaro et al. (2011), who indicated a problem with the effective temperature determination from Balmer lines. This problem was also noticed in this paper. The Mg ii 4481 in the spectrum of KIC 5724440 is weaker than in the spectrum of a normal star with the same atmospheric parameters. The iron-peak elements and especially Sr are slightly underabun-dant. This supports the λ Bootis classification of this star.