STEREO – Heliospheric Imager
Design, pre-flight and in flight response comparison
Jean-Philippe Halain
a∗, Emmanuel Mazy
a, Jean-Marc Defise
a, Pierre Rochus
aJ. Daniel Moses
b, Jeffrey S. Newmark
b, Clarence Korendyke
b, Russ Howard
bChris Eyles
c*, Richard Harrison
d, Chris Davis
da
Centre Spatial de Liège, 4031 Angleur, Belgium
bNaval Research Laboratory, Washington, DC 20375 d
c
University of Birmingham, Birmingham B15217, UK
dRutherford Appleton Laboratory, OX11 0QX, UK
ABSTRACT
The Heliospheric Imager (HI) is part of the SECCHI suite of instruments on-board the two STEREO observatories launched in October 2006. The two HI instruments provide stereographic image pairs of solar coronal plasma and coronal mass ejections (CME) over a field of view ranging from 13 to 330 R0.
The HI instrument is a combination of two refractive optical systems with a two stage multi-vane baffle system. The key challenge of the instrument design is the rejection of the solar disk light by the front baffle, with total straylight attenuation at the detector level of the order of 10-13 to 10-15. Optical systems and baffles were designed and tested to
reach the required rejection.
This paper presents the pre-flight optical tests performed under vacuum on the two HI flight models in flight temperature conditions. These tests included an end-to-end straylight verification of the front baffle efficiency, a co-alignment and an optical calibration of the optical systems. A comparison of the theoretical predictions of the instrument response and performances with the calibration results is presented. The instrument in-flight photometric and stray light performances are also presented and compared with the expected results.
Keywords: Coronagraph, straylight, calibration
1. HELIOSPHERIC IMAGERS ON STEREO
1.1. The SECCHI suite of instruments
The Solar Terrestrial Relations Observatory (STEREO) mission is a NASA program of two identical spacecrafts launched in October 2006 into Earth-like orbits, one ahead (A) and one lagging (B) the Earth, providing two stereographic observation points of views.
The Sun Earth Connection Coronal and Heliospheric Investigation (SECCHI) is a suite of remote sensing instruments, part of the STEREO payload. The SECCHI instruments observes coronal mass ejections (CMEs), as they can look back at the Earth-Sun line and detect the CME as they approach Earth. A detailed description of SECCHI is in ref. [ 1].
The SECCHI suite includes an Heliospheric Imager (HI) to detect and track the faint emission of CMEs at large distances from the Sun. Within the SECCHI suite, the CMEs will be ideally detected first by the EUV disk imager, then successively by the COR1, COR2 coronagraphs and then by the HI, as the CME is leaving the Sun and becoming fainter.
∗ Correspondence:
- [email protected], phone: +32 4 367 6668, fax: +32 4 367 5613
1.2. Instrument Concept
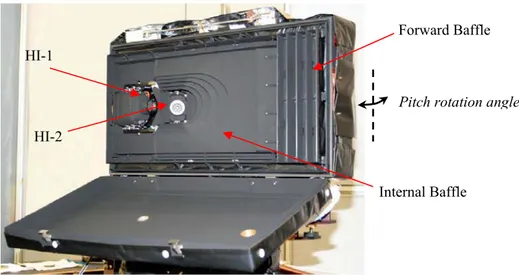
The HI instruments (Figure 1) are providing imaging capabilities over very wide field of view (FOV) of ~85° starting at 12 R0 (solar radii), and provide faint visible light detection capability with irradiance levels down to ~10-15 B0 (where B0
is the solar irradiance at 1 AU). The original concept and its design have been presented in [ 2] and [ 4].
At long elongation from the sun centre, the CME signal is extremely faint, requiring important stray-light suppression from a lot of different sources. At short angular distance from the Sun, the CME's are rather bright, but the Sun is a very bright extended source in direct proximity of the field of view (FOV), which requires an extremely efficient occultation. This leaded to separate the fields of view of the HI instrument in two cameras (HI-1 and HI-2), each one with a specialized optical design and dedicated shading baffles.
• HI-1 camera is viewing the inner heliosphere from 3.65° from the Sun, with a FOV of 20-arcdeg. Its baffle system – named forward baffle – has been optimized to protect the camera from the solar disk emission, taking advantage of the quasi-collimation of the solar flux. This forward baffle is a 5 vanes cascading diffraction system providing an improved level of shadow from the direct solar disk light, grazing to the instrument top side. The rejection level is lower than 10-9 for HI-1 and 10-11 for HI-2, which is a major achievement for the instrument.
• HI-2 camera is viewing the heliosphere from 18.36° from the Sun, with a FOV of 70-arcdeg. This wide-angle optical system is surrounded by a multi-vane protective baffling – named internal baffle - that attenuates reflected light from the bright sources reaching the external surfaces of the instrument. Opposed to the front baffle concept, this internal baffle takes advantage of the vane geometry and absorbing properties of its black paint to damp light by absorption and multiple diffuse reflections.
Figure 1: HI instrument (HI-B flight model during environmental and calibration tests at CSL)
The HI-1 and HI-2 cameras are also potential contributors to stray-light contamination, with the ghosts produced from multi-reflections on the optical surfaces and stray reflections on the inner surfaces of the lens barrel. The performances of the anti-reflective coating being limited by large incidence angles and spectral range, special care was taken to enlarge as much as possible the ghosts that will affect the images, especially in HI-2. By doing so, the ghost contribution becomes a background noise, and does not generate twin stars with field-dependent spacing.
The design of the lens barrel inner geometry has also been optimised by ray-tracing analysis, and some cavities were added to act as light traps. A black chromium coating has been selected for the internal surfaces of the titanium lens barrel to provide additional absorption of the incident rays out of the FOV that are not stopped by the aperture stop. A 10-2 to 10-4 attenuation factor has been reached for all the light that is not focussed on the detector.
The 2048x2048 CCD detectors (13.5µm pixels) are integrated in each of the two cameras focal plane assemblies and passively cooled by dedicated external radiators viewing cold space. The CCD are operated in a shutterless mode with summing and binning modes.
Forward Baffle
Internal Baffle HI-1
HI-2
2. OPTICAL CALIBRATION OF HELIOSPHERIC IMAGERS
The HI Flight Model A and B have been calibrated in the CSL facilities.- The primary objective of these calibrations was to provide an evaluation at system level of the optical response, in term of optical throughput, Point Spread Function (PSF) and straylight. The process of these data was used to develop a database to calibrate the scientific observations that will be gathered with the on-orbit instruments. - The secondary objective was to demonstrate the ability to conduct science operation without a loss/degradation
of data or data interference in flight temperature conditions, as well as verifying command/telemetry databases, compiling trending analysis, collecting operating run time, etc.
The primary objective is presented in this paper.
2.1. Optical calibration setup
The optical tests have been performed at instrument level in simulated flight conditions (pressure and temperature) for each of the two HI instruments separately. In order to reach the primary objective of the optical calibration, a set of two collimators, improved to limit as much as possible their straylight, was necessary. The HI instrument and the collimators were connected to a seismic bloc, providing the required stability. The HI instrument was located on a horizontal fixture mounted on a rotation stage to cover the two optical systems field of views along pitch angle.
• For photometry and PSF measurements in the FOV, an halogen lamp covering HI-1 and HI-2 spectral range was used as source of an F/10 Newtonian collimator providing a 300-mm collimated beam (theoretical divergence of 30-arcsec), whose focal plane is defined by a 400-µm optic fibre.
• For straylight measurement out of the field of view, a 2W continuous diode laser at 670 nm (i.e. in the middle of the HI-1 spectral range) was used to simulate Sun light and Earth light effects, as source of an F/3 refractive collimator providing a 25 x 5-mm² collimated beam (theoretical divergence of 27.5-arcmin), whose focal plane is defined by a 600-µm optic fibre.
The photometric calibration being a key parameter of the instrument performances, two monitoring photodiodes were used to measure the collimated beams to compare with the instrument response, one set for high flux (i.e. straylight measurements) and the other one for small flux (i.e. PSF and photometry measurements).
The HI instrument environment in the vacuum chamber was blackened as much as possible to limit unwanted straylight, and surrounded by additional black panels and black curtains at well-defined locations in the chamber.
2.2. Optical calibration results
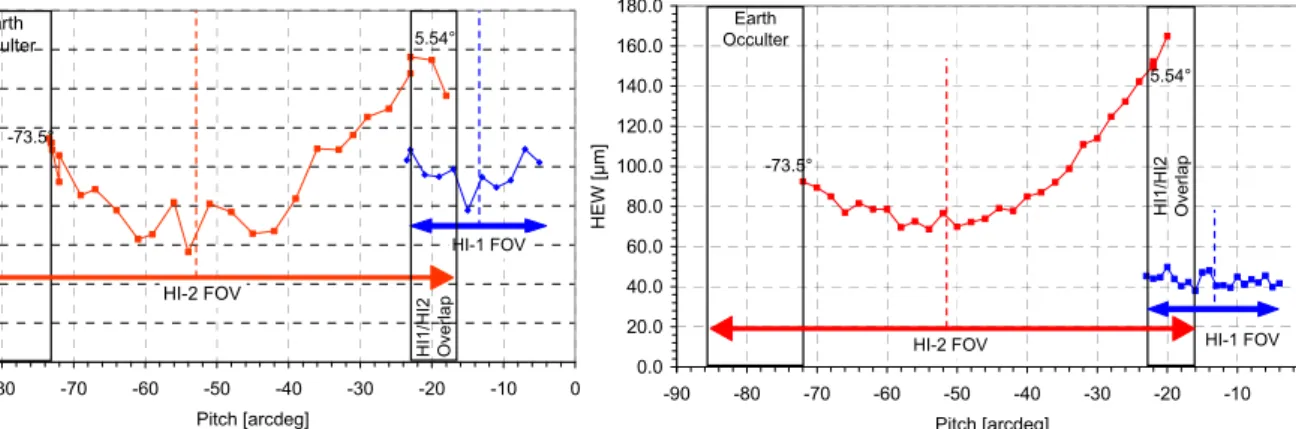
Primary result of the HI instruments calibration is the measured half energy width (HEW) of the HI-1 and HI-2 PSF along the pitch axis of both A and B instruments, given in Figure 2 and 4. One can notice that the HI-2 field of view is limited on one side by the Earth occulter, and that HI-1 and HI-2 field of view overlaps by 5.54-arcdeg. This overlap will be used to cross-calibrate in-flight optical systems.
0 10 20 30 40 50 60 70 80 90 -90 -80 -70 -60 -50 -40 -30 -20 -10 0 Pitch [arcdeg] HE W [ µ m] Earth Occulter HI-2 FOV HI-1 FOV -73.5° 5.54° HI 1/ HI 2 Ov er la p 0.0 20.0 40.0 60.0 80.0 100.0 120.0 140.0 160.0 180.0 -90 -80 -70 -60 -50 -40 -30 -20 -10 0 Pitch [arcdeg] HEW [µ m] Earth Occulter HI1 /HI2 Over la p -73.5° 5.54°
HI-2 FOV HI-1 FOV
The total light flux entering the optical system was computed in the HI-1 and HI-2 FOV, on-axis measurement, assuming respectively a 16 mm and 7mm entrance pupil for 1 and 2. Optics subsystem transmission over the respective HI-1 and HI-2 spectral band-passes, ref. [ 6], were used to compute the optical throughput, the vignetting into the FOV, and the detector conversion factor in photon/DN @670nm. The linearity range of the detector has also been measured at one pitch angle of the HI-1 and HI-2 respective FOV by means of a set of increasing intensities.
The distortion was computed with respect to undistorted optical systems: D(α) = α - g(α), where α is the angular location in field of view and g(α) the distortion function. A best fit with polynomial functions was first performed, but a least-squares fitting of the spots centroids by an AZP projection model was then considered to obtain a reference for in-flight images: g(α) = (µ + 1) sin α / (µ + cos α) with an off-axis distance onto the detector r = f . g(α), where f is the paraxial focal length and µ the resulting distortion parameter.
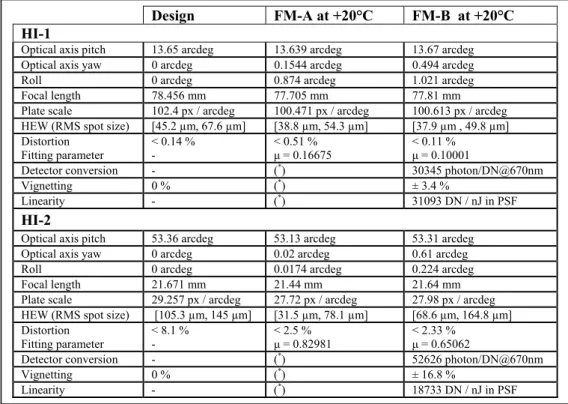
Table 1 summarizes the results obtained under vacuum for each camera of both HIA and HI-B instruments at +20°C with detectors at -80°C, with alignments results versus instrument reference cubes, compared with design values
Table 1: HI optical main characteristics (* Photometry was limited for HI-A due to smearing in calibration images)
2.3. End-to-end straylight measurements
Straylight tests were previously performed on forward baffle and cameras at sub-system level, ref. [ 6]. The flight units vacuum calibration sequences was the opportunity to test the straylight at instrument level, including the internal baffle. An end-to-end straylight test required the detection of extremely faint light level. During HI-A calibration campaign, the background level in the chamber and in the collimators was too high to reach this level. The chamber improvement for the HI-B testing allowed reaching the goal.
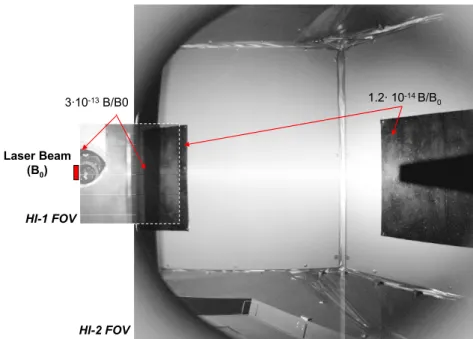
Figure 4 shows the images acquired at 0° pitch angle (i.e. sun pointing direction) in HI-1B and HI-2B with rejections values computed using beam flux and photometric results of the cameras, in B/B0 where B0 is the beam intensity. The images show the inside of the vacuum chamber black enclosure, and in particular some super-black panels and black curtains that were used to obtain some reference surfaces to compute the background level. The measurements of this background level confirm the forward baffle efficiency and indicate that the stray light requirement, ref. [ 3], is met for both optical systems, even if some part of black enclosure are brighter due to chamber internal reflections. The instrument door, which was not fully deployed during the test for mechanical reasons, is also visible.
Design FM-A at +20°C FM-B at +20°C HI-1
Optical axis pitch 13.65 arcdeg 13.639 arcdeg 13.67 arcdeg Optical axis yaw 0 arcdeg 0.1544 arcdeg 0.494 arcdeg
Roll 0 arcdeg 0.874 arcdeg 1.021 arcdeg
Focal length 78.456 mm 77.705 mm 77.81 mm Plate scale 102.4 px / arcdeg 100.471 px / arcdeg 100.613 px / arcdeg HEW (RMS spot size) [45.2 µm, 67.6 µm] [38.8 µm, 54.3 µm] [37.9 µm , 49.8 µm] Distortion Fitting parameter < 0.14 % - < 0.51 % µ = 0.16675 < 0.11 % µ = 0.10001
Detector conversion - (*) 30345 photon/DN@670nm
Vignetting 0 % (*) ± 3.4 %
Linearity - (*) 31093 DN / nJ in PSF
HI-2
Optical axis pitch 53.36 arcdeg 53.13 arcdeg 53.31 arcdeg Optical axis yaw 0 arcdeg 0.02 arcdeg 0.61 arcdeg
Roll 0 arcdeg 0.0174 arcdeg 0.224 arcdeg
Focal length 21.671 mm 21.44 mm 21.64 mm
Plate scale 29.257 px / arcdeg 27.72 px / arcdeg 27.98 px / arcdeg HEW (RMS spot size) [105.3 µm, 145 µm] [31.5 µm, 78.1 µm] [68.6 µm, 164.8 µm] Distortion Fitting parameter < 8.1 % - < 2.5 % µ = 0.82981 < 2.33 % µ = 0.65062
Detector conversion - (*) 52626 photon/DN@670nm
Vignetting 0 % (*) ± 16.8 %
Laser Beam (B0)
3·10-13B/B0 1.2· 10-14 B/B0
HI-1 FOV
HI-2 FOV
Figure 4: HI-1 (left part) and HI-2 FM-B (right part) image combination FOV for 0-arcdeg pitch angle source
Figure 5 shows the HI-1 images taken at increasing off-pointing pitch angles between the incident beam representing the Sun direction and the instrument main axis (0.17º, 0.33º, 0.5º, 0.66 and 1.0º). In these images, the vacuum chamber appendix is visible with the F/10 collimator, the F/3 collimator simulating Sun is not visible as located out of the FOV. An annulus-like pattern appears at 0.33-arcdeg and progressively dominates the background.
Ray-tracing simulations have identified this ring pattern as a reflection on the last two retainers of the HI-1 lens barrel (Figure 11).
0 0.17 0.33
0.5 0.66 1.0
As shown on Figure 6, when the incident beam approaches the border of HI-1 FOV, the straylight patterns progressively reduces until being focused when in the FOV. Figure 6 also shows that similar ring pattern is present on the other side of the FOV, with dimension increasing with pitch offset.
In FOV
2.5 3.5 4 4.5 5
24 25 26 27 30
Figure 6 : Spot image in HI-1 FM-B from 2.5 to 30-arcdeg pitch angles
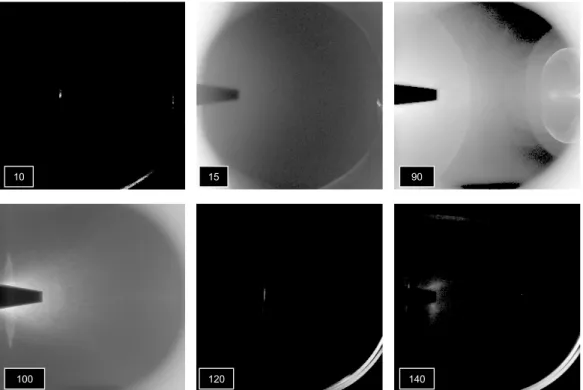
Figure 7 shows HI-2 images taken at some out-of-FOV pitch angles, i.e. below 18.3-arcdeg and above 88.3-arcdeg. These images should be compared with right side of Figure 4. The images are dominated by ghost artefacts that come from reflection on the CCD and on some particular lenses surfaces. Some diffusion on the Earth occulter is also producing some additional ghosts. The internal baffle edges, which are in the FOV, are also visible as they reflect light for some particular angles. Additional straylight measurements in HI-2 were limited by the chamber background and the limited light source power.
10 15 90
100 120 140
3. HI INSTRUMENT IN-FLIGHT PERFORMANCES
The HI-A and HI-B instruments first light were respectively obtained on 13th December 2006 and 11th January 2007.
Both instruments are nominal and present the expected performances.
3.1. Straylight performances
The calibration results provided a photometric conversion between detector unit value and Sun Intensity (B0) which are 1
DN/sec ~ 7.5 10-14 B/B
0 and ~ 1.7 10-14 B/B0 for HI-1 and HI-2 respectively. Considering these conversion factors and
when removing the coronal background from the images, at 0-arcdeg pitch angle, the straylight level due to the direct Sun can be estimated to 3.10-12 B/B
0 and 2.10-14 B/B0 for HI-1 and HI-2 respectively.
HI-1 straylight
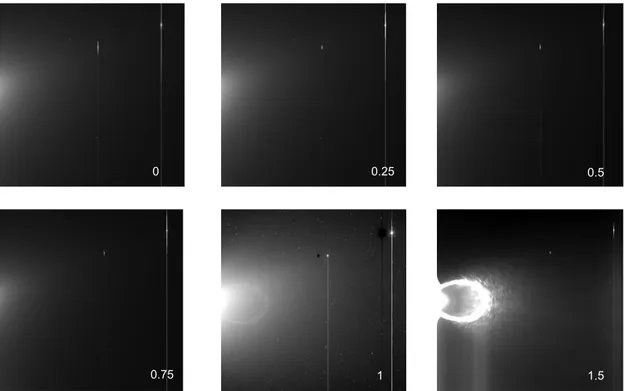
On 30th January, the STEREO-A off-pointed in pitch (0.25º, 0.5º, 0.75º, 1.0º and 1.5º towards Sun) which allowed to
obtain the off-pointed images of Figure 8 which can be compared to the calibration results of Figure 5, taking into account that the HI instruments have been off-pointed by +20-arcmin on the spacecraft relatively to Table 1 pitch optical axis pointing values, i.e. the HI-1 optical axis is 13.98-arcdeg instead of 13.65-arcdeg.
0 0.25 0.5
0.75 1.0 1 1.5
Figure 8: HI-1A off-pointing on 30th January 2007
The plot of Figure 9 gives a comparison between the theoretical forward baffle rejection [ 4] and the detector central line pixels values (converted in B/B0) measured during the instrument calibration and the in-flight off-pointing sequence: - The theoretical curve includes forward baffle diffraction and a lens barrel out of FOV attenuation of 3.10-2 (ref. [ 6]).
- The calibration curve is limited by the chamber background ~ 3.10-13 B/B0 over the whole FOV, and modulated in
first half of the FOV by chamber internal elements that produce artefacts. The beginning of the calibration curve however starts at 8.2 10-13 B/B0 very close to the theoretical value of 7.8 10-13 B/B0 at this angle.
- The flight curve is a zodiacal-background removed set of values along central line and corresponds to a pitch offset angle of +4.8arcmin (the closest value to be compared with calibration and theoretical plots). It starts at a value of 2.9 10-12 B/B0 and has a slightly different slope. The pitch value is probably not the only explanation for the
differences, as other straylight sources are not taken into account in the model like the Earth and the zodiacal light reflections. These values will be refined with the improved cameras photometry that will be performed using stars.
1E-15 1E-14 1E-13 1E-12 1E-11 1E-10 1E-09 1E-08 1E-07 1E-06 1E-05 1E-04 1E-03 1E-02 1E-01 0 4 8 12 16 20 24 FOV [arcdeg] V a lu e al ong c e nt ra l l ine [B /B 0] HI-1 FOV Theoretical curve HI-1A flight HI-1B calibration
Figure 9: HI-1 rejection level comparison (theory, calibration, and in-flight)
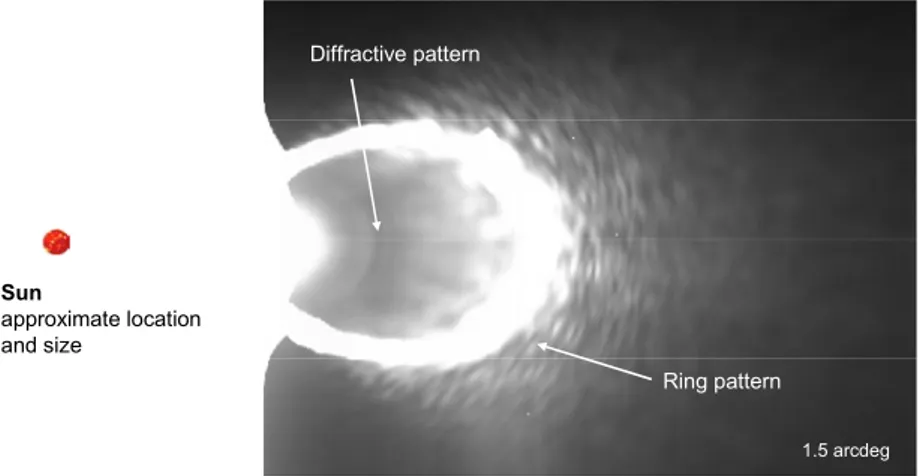
A detail (Figure 10) of the straylight pattern obtained at 1.5-arcdeg pitch off pointing shows the combination of a linear diffractive pattern (forward baffle Fresnel diffraction [ 2] and [ 3]) and a ghost ring pattern, already noticed in calibration results (Figure 5). The Sun approximate location and size is represented for comprehension.
Diffractive pattern Ring pattern 1.5 arcdeg Sun approximate location and size
Figure 10: Detail of the HI-1A diffractive pattern obtain at 1.5-arcdeg pitch off-pointing
Ray-tracing simulations were conducted to understand this ring pattern. It was identified that it is produced by a reflection on the last two retainers of the HI-1 lens barrel for incident rays at the border of the FOV (Figure 11), the further out of the FOV the larger the ring pattern, corresponding to results of Figure 6.
Figure 11: HI-1 ray-tracing result for increasing pitch angles of light source out of the FOV
FOV border – 15-arcdeg FOV border –3-arcdeg FOV border – 7-arcdeg
In beginning of February 2007, the Earth entered the HI-1B FOV. The images of Figure 11 correspond to the Earth located at 30-arcdeg and 26-arcdeg from Sun direction, i.e. 7-arcdeg and 3-arcdeg above the HI-1 FOV. A ring pattern very similar to the ones obtained with the ray-tracing model (Figure 11) and measured during calibration (Figure 6) is clearly visible. No diffractive additional linear pattern is present in Figure 11, which indicates that the linear pattern of Figure 10 is well produced by the forward baffle diffraction.
30 26
Figure 12: HI-1B pattern observed with Earth at border of FOV
HI-2 Straylight
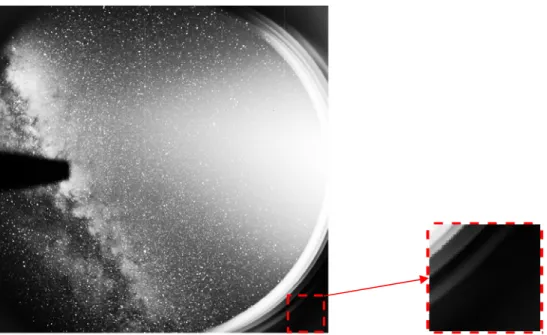
Figure 13 is a typical HI-2A image. The internal baffle edges are visible, as located in the square FOV, but thanks to the good dynamic range of cameras it does not produce any background on the rest of the image.
Figure 13: HI-2 typical image during early months of the mission (Earth not in the FOV)
The primary explanation of the edges illumination is Earthshine. The further the spacecraft will be from the Earth the lower this effect will be. End of January 2007, the Earth was very close of the spacecraft and passed through the HI-2B FOV during two weeks, producing the images of Figure 14 (where the Earth location is given in pitch angle versus sun pointing direction), showing the Earth influence in internal baffle straylight level, together with many additional ghosts. When plotting the average value of a 100-px square corner located at internal baffle location in the FOV (see Figure 13 – right part) over months, the first passes through the FOV are clearly identified, showing the dependence of the internal edges straylight level with Earth.
In FOV
90
140 120 100
80 50 20 10
Figure 14: Earth crossing HI-2B FOV
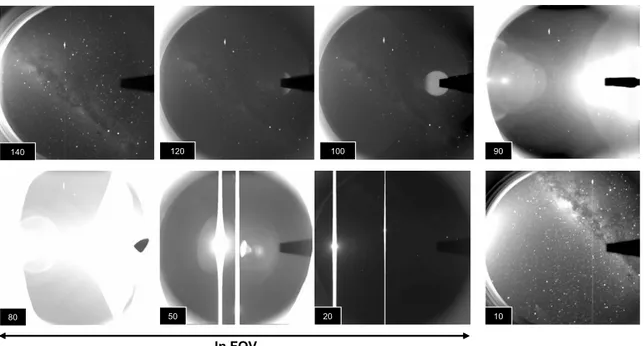
The STEREO-A off-pointing in pitch (0.25º, 0.5º, 0.75º, 1.0º and 1.5º) towards Sun allowed obtaining the off-pointed images of Figure 15. This sequence shows that the forward baffle shadow at HI-2 level is progressively reduced, increasing the straylight level of the internal edges. This gives a second explanation to the internal edges illumination in nominal pointing. The internal baffle is indeed in the deep shadow of the forward baffle but the camera sensitivity is so high that sun diffracted and zodiacal light reflections on the internal edges are visible. However the Earthshine is the primary contributor and a better analysis of the HI-2 straylight will be only possible when the Earth will far enough from the spacecrafts.
0 0.25 0.5
0.75 1.0 1 1.5
3.2. Optical performances Point Spread Function
The PSF measured in flight images are consistent with pre-launch calibration values, as shown in Table 2, where values are given in pixels. The HI-2B PSF is slightly less good than the other optics, as already noticed during the on-ground calibration. It has however minor impact on primary science aspects, even if star subtraction and stellar photometry are consequently more difficult.
Table 2: Calibration and in-flight PSF comparison
Calibration PSF In-flight PSF FWHM HEW FWHM HEW HI-1A 3 – 4 3 – 4 3 – 4 3 – 4 HI-2A 3 – 6 3 – 6 3 – 8 4 – 6 HI-1B 3 – 4 3 – 4 3 – 4 3 – 4 HI-2B 3 - 10 3 – 12 3 – 12 5 – 16
A PSF model of the 4 cameras is also construction. The complexity of the HI-2B PSF will however require a multiple parameters model. Preliminary results indicate that 4 parameters will be the minimum, with hypothesis of circular symmetry of the PSF around detector centre. For the 3 other cameras, the PSF model will be much more basically achieved.
Photometry
The measured optics transmission [ 5] and detector quantum efficiency allow to obtain the photon rates per pixel for HI-1 and HI-2 of respectively 2.1013 ph / pixel / second and 3.1014 ph / pixel / second, for a solar spectral flux at 1AU
The F-Corona light profile background can usually be fitted with an R-n profile up to 1-arcdeg of elongation [ 7]. A
similar fit of the measured F-corona intensity at a number of points across centre-line of HI-1 and HI-2 FOV can be performed with n = 2.38 and 1.85 for HI-1 and HI-2 respectively.
The per pixel detection threshold due to the Zodiacal background for an exposure Teff (i.e. the Zodiacal background associated noise at 1σ), is BF.PhU.Teff where BF is the fitted Zodiacal background and PhU the photon rates per pixel.
This threshold is at 9 10-14 B0 and 2.3 10-15 B0 for HI-1 and HI-2 respectively, for summed images of 30 and 50 nominal
exposure duration respectively, i.e. 1200s and 4950s effective exposure time. Any additional signal will only be detected if superior or equal to this 1σ noise and faint signal detection will be obtained with a Teff exposure.
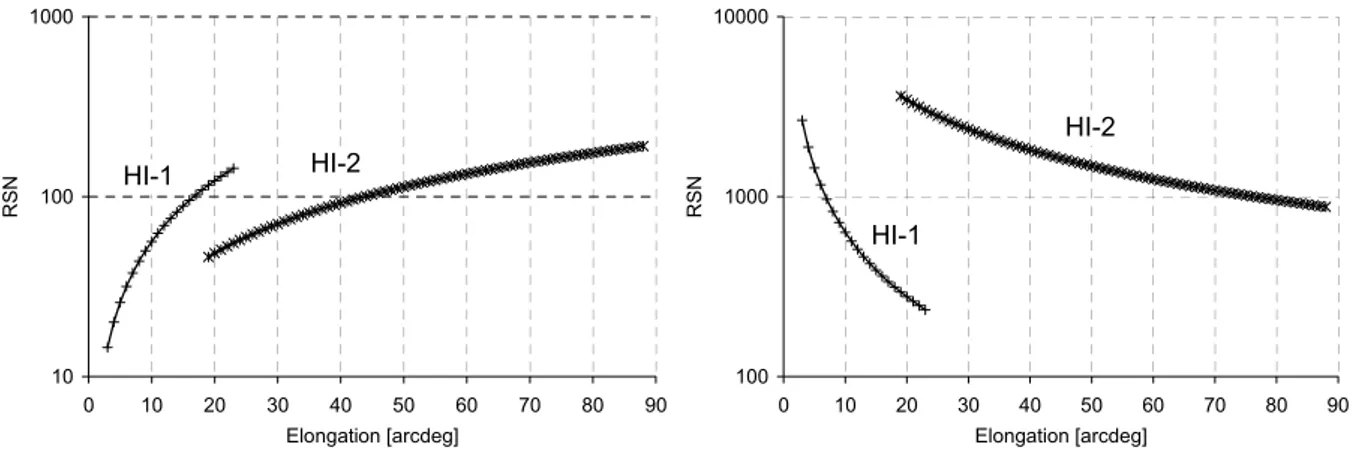
The S/N ratio can for example be plot for a 10-12 B0 constant light over elongation, and for the R-n zodiacal light (1.10-10
at 3-arcdeg, to 5.10-13B0 at 88-arcdeg of elongation), as shown on Figure 16.
10 100 1000 0 10 20 30 40 50 60 70 80 90 Elongation [arcdeg] RS N HI-1 HI-2 100 1000 10000 0 10 20 30 40 50 60 70 80 90 Elongation [arcdeg] RS N HI-2 HI-1
Figure 16: S/N ratio with elongation for a 10-12 B0 signal (left) and a R-n zodiacal light (right)
A confirmation of these results with improved photometry, the detector linearity and an improved flat field of the four cameras are under computation using star-fields, and will be presented in a next paper.
CONCLUSIONS
The Heliospheric Images (HI) optical systems have been optically calibrated at CSL at flight unit system level in representative vacuum and thermal conditions. High attention has been taken to design and improve the test setup in order to achieve an end-to-end straylight measurement in flight conditions down to a 10-13 level, which demonstrated the
baffle systems efficiency.
Preliminary flight images show that in-flight straylight is similar to the pre-flight calibration results, with a Sun light rejection level of 3.10-12 B/B
0 and 2.10-14 B/B0 for HI-1 and HI-2 respectively. In particular, the Sun limb straylight level
in HI-1 was compared for in-flight and calibration results, with theoretical plots.
A detail of the straylight pattern measured during calibration and spacecraft pitch off-points was presented. The Earth passes through the HI-1 cameras FOV was the opportunity to validate the ray-tracing model of this pattern, and these passes confirm Earth influence on the internal baffle HI-2 straylight. When Earth will be further from spacecrafts, HI-2 straylight will be analysed in more details.
Preliminary photometric results were presented with in-flight vs. calibration PSF comparison. Optical performances analysis based on flight images will be continued using stars-fields, with the goal to provide a PSF model over the cameras field of views, to improve the photometry and to obtain a flat-field of the four cameras.
ACKNOWLEDGEMENTS
The Heliospheric Imager instruments are developed by the University of Birmingham (UK), the Centre Spatial de Liège (B), the Naval Research Laboratory (USA), the Rutherford Appleton Laboratory (UK) and The Belgian contribution to the STEREO program is funded by the Belgian Federal Science Policy Office (BELSPO), through the Belgium ESA/PRODEX program. The UK contribution is funded by Particle Physics and Astronomy Research Council (PPARC). STEREO/SECCHI is funded under NASA contract S-13631-Y.
REFERENCES
1. R.A Howard, J.D. Moses, D.G. Socker and the SECCHI consortium, "Sun Earth connection coronal and heliospheric investigation"; SPIE 4139, 2000.
2. Buffington, A. Jackson, B.V. and Korendyke, C.M., “Wide-angle stray-light reduction for a spaceborne optical hemispherical imager,” Applied Optics, 35, No. 34, pp. 6669-6673, 1996.
3. D.G. Socker, R.A. Howard, C.M. Korendyke, G.M. Simnett, D.F. Webb, “NASA Solar Terrestrial Relations Observatory (STEREO) mission heliospheric imager”, SPIE 4139, 2000.
4. J.M. Defise, J.Ph. Halain, E. Mazy, P. Rochus, R. A. Howard, J. D. Moses, D. G. Socker, G. M. Simnett, D. F. Webb, "Design of the Heliospheric Imager for the STEREO mission" SPIE 4498, 2001.
5. J.M. Defise, J.Ph. Halain, E. Mazy, P. Rochus, R. A. Howard, J. D. Moses, D. G. Socker, R. Harrison, G. M. Simnett, "Design and tests for the Heliospheric Imager of the STEREO mission" SPIE 4853, 2003.
6. E. Mazy, J.Ph. Halain, J M. Defise, P. Ronchain, R. A. Howard, J. D. Moses, C. Eyles, R. Harrison, "Design and Performances of the Heliospheric Imager for the STEREO Mission" SPIE 5962, 2005
7. S. Koutchmy and P.L. Lamy, “ The F-corona and the circum-solar dust evidences and properties,” in “Properties and Interactions of the Interplanetary Dust,” IAU Colloq. 85, pp. 63-74, 1985.