INTRODUCTION
Biological invasions and seed dispersal are
two major topics in plant ecology. As they are
considered as the second cause of biodiversity
loss worldwide (C
RONK& F
ULLER1995, P
ARKERet al. 1999), biological invasions have attracted
much attention in the last decade (P
YSEKet al.
2004). Seed dispersal can be regarded as a key
process in the survival and distribution of plant
species. Hence, dispersal analysis is important to
understand the success of invasive species.
Stud-ies on alien specStud-ies dispersal abilitStud-ies are of
cru-cial interest to understand plant invasion patterns
and dynamics in the field (H
ARPER1977, D
AUERet al. 2006). Although much has been written on
the dispersal capacities of invaders, the number of
detailed studies of dispersal ability and realized
SEED RAIN PATTERN OF THE INVASIVE WEED SENECIO INAEQUIDENS
(ASTERACEAE)
© 2008 Royal Botanical Society of BelgiumArnaud M
ONTY1,3,*, Charles S
TAINIER2,3, Frederic L
EBEAU2, Nora P
IERET1and Grégory M
AHY11Gembloux Agricultural University (FUSAGx), Laboratory of Ecology, Passage des Déportés 2, B - 5030 Gembloux, Belgium
2 Gembloux Agricultural University (FUSAGx), Mechanics and Construction Department, Passage des Déportés 2, B - 5030, Gembloux, Belgium
3 Equally contributing authors
(*Author for correspondence: e-mail: monty.a@fsagx.ac.be)
Received 27 April 2007; accepted 8 August 2007.
A
BSTRACT. — Dispersion capacity of alien invasive plants is a key feature for
understand-ing invasion processes and risks. Here, we present an experimental study focussunderstand-ing on the seed
rain pattern of Senecio inaequidens, an African plant widespread throughout Europe, under
common favourable dispersal conditions. One hundred achenes from two Belgian populations
underwent a drop time in still air experiment in order to assess linear correlation between
sev-eral morphological traits and terminal velocity. Variation in morphological traits was measured
for 250 additional achenes per population. The trait best correlated to terminal velocity was the
square root of the plume loading. We then used this trait to model terminal velocity using a
lin-ear regression (r
2of 79.7%). With this regression and imposing ecological parameters such as
wind speed, turbulences and height of release to be representative of favourable dispersal
con-ditions, we established a Gaussian tilted plume model to predict the seed rain pattern of the
species. A wind tunnel experiment consequently permitted to validate the model. Under a wind
speed of 5 m s
-1with 2% turbulences along the vertical axis, and height of release of 0.40 m,
99.8 % of achenes were dispersed within 100 meters, with a maximum deposition rate at 5.2 m
from the parent plant. Uplifted achenes, not forecasted by the model, represent 6.25% of all
achenes.
K
EY WORDS. — Senecio inaequidens, Gaussian model, invasive plant, plume loading, seed
rain pattern.
dispersal patterns is surprisingly low (H
IGGINSet
al. 2001).
The spatial distribution of seeds around their
source is called a ‘seed shadow’ or ‘seed rain
pat-tern’, a density curve of landing probabilities
(W
ILLSON& T
RAVESET1993, J
ONGEJANS& S
CHIP -PERS1999). Models used to predict seed shadows
range from simple phenomenological to complex
mechanistic models. Phenomenological models
are based on fit to observed data on seed
disper-sal. Those models generally describe the seed
number-distance relationships as leptokurtic
(with a higher peak and longer tail than a normal
distribution). From the peak outwards, seed
den-sities generally fit a negative exponential curve or
sometimes a negative power function (O
KUBO&
L
EVIN1989, W
ILLSON& T
RAVESET1993).
Although these empirical models are simple and
fit some datasets reasonably well, they are only
based upon parameters that are not measured or
controlled independently, such as wind speed,
release height or terminal velocity. Therefore,
these models do not allow extrapolation from one
situation to another nor do they provide any
understanding of the underlying mechanisms.
Detailed mechanistic models were developed to
predict dispersal of anemochorous plants (O
KUBO& L
EVIN1989, G
REENE& C
ALOGEROPOULOS2002, N
ATHANet al. 2002, T
ACKENBERG2003,
S
OONSet al. 2004). Unlike phenomenological
models, these mechanistic models describe the
probability distributions of seeds and should be
applicable over infinite distances and under any
circumstances (B
ULLOCK& C
LARKE2000). Some
of these models have the advantage to take into
account the seed uplift, which is supposed to be
responsible for very long distance dispersal.
Unfortunately, they have to be very accurate to
give satisfactory results. Another shortcoming is
that validating patterns with real data and
obtain-ing basic input data is complicated (N
ATHANet al.
2002, T
ACKENBERG2003, S
OONSet al. 2004).
Between phenomenological and mechanistic
approaches, Gaussian models represent simple
and yet poorly explored seed shadow models.
These models generally compute the horizontal
and vertical distribution of wind-borne particles
under the influence of diffusion and advection.
For particles with non-negligible weight, such as
most plant diaspores, the Gaussian tilted plume
model is used, which takes gravitational settling
into account (e.g., C
SANADY1963). The most
important species-specific characteristic used in
wind dispersal models is the terminal velocity
(Vt), i.e., seed fall velocity in still air. It is
rela-tively easy to measure and has been used as an
index of relative dispersal ability among species
(S
HELDON& B
URROWS1973, M
ATLACK1987,
S
CHULZet al. 1991, A
NDERSEN1992, 1993,
K
AHRS1994, A
SKEWet al. 1997, T
ACKENBERGet
al. 2003). Dispersal capability of wind-dispersed
propagules, including terminal velocity, can often
be successfully predicted from their
morphologi-cal characteristics (S
HELDON& B
URROWS1973,
M
ORSE& S
CHMITT1985, M
ATLACK1987, C
ODY& O
VERTON1996, S
OONS& H
EIL2002). Besides
the selection of a pertinent, and yet pragmatic
model of seed dispersal, the problem of model
validation is of crucial importance. Wind tunnels
provide repeatable controlled experimental
condi-tions to generate seed shadows and validate seed
dispersal models.
Senecio inaequidens DC. is a perennial
herbaceous Asteraceae. It was originally
distrib-uted in Lesotho and on the South African west
coast, on river edges and in stony meadows
(E
RNST1998). It was accidentally introduced in
Europe in the early 20
thcentury via the wool trade.
During several decades it was only found in the
vicinity of a few wool-processing areas
(G
UILLERMet al. 1990, E
RNST1998). From 1950
onwards, S. inaequidens expanded throughout
western, central and southern Europe, and to
envi-ronments outside the wool industry. By the 1970s,
the species was considered as a weed in
agricul-tural areas in France, especially in vineyards
(G
UILLERMet al. 1990), as well as in road ditches
and in grazing meadows where it is unpalatable to
livestock. By the 1990s, it was also recorded in
natural habitats (M
ICHEZ1995). S. inaequidens
has a highly effective production of capitula over a
long flowering period (i.e., six months). Tubula
and ligula become wind-dispersed achenes,
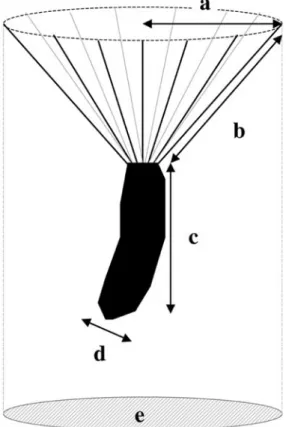
pro-vided with an unbeaked pappus (Fig. 1). Some
individuals can produce up to 1500 capitula
dur-ing a flowerdur-ing period (M
ONTY, unpublished
data). Each capitulum bears roughly one hundred
achenes (L
OPEZ-G
ARCIA& M
AILLET2005).
With this study we aimed at evaluating the
dispersal capacity of the achenes of the invasive
S. inaequidens, on a hundred-metre scale, using a
Gaussian modelling approach. We then tested the
model with wind tunnel data. Also, our aim was
to test the adequacy of this approach under
com-mon favourable dispersal conditions in order to
provide the basis for future studies on the factors
affecting dispersal of this species.
MATERIAL AND METHODS
ANALYSIS OF MORPHOLOGICAL TRAITS AND DETERMINA
-TION OF A PROXY FOR TERMINAL VELOCITY
To run a Gaussian model, terminal velocity of the particle is the only characteristic needed. However, our approach included a validation test of the selected model in a wind tunnel. In this validation experiment, achenes were captured on a sticking paper and were no longer available for direct terminal velocity measure-ments. We thus needed to find a proxy for terminal velocity based on morphological traits.
S. inaequidens propagules were collected in
December 2004 in two populations located in waste lands in Belgium: Seraing (50°36’9.1’’N; 05°29’46.0’’E; alt.120 m; population area 350 m2) and Antwerpen (51°14’37.4’’N; 04°23’12.3’’E; alt. 2 m; population area 700 m2). In both populations, five capitula were ran-domly collected on five ranran-domly selected individuals. Capitula were stored at ambient temperature in pierced boxes insuring uniform spread of plume fibres. Terminal settling velocity was measured on two achenes per capit-ulum: one external (at the periphery of the receptacle) and one internal (near the centre of the receptacle) (50 achenes per population). The achene-pappus unit was dropped down a transparent vertical Plexiglas tube (diameter 139 mm; height 2 m). The Plexiglas tube was connected to the ground with a copper wire to discard static electricity interferences. The descent was timed by an observer with an electronic stopwatch (precision: 0.01 s) along one meter, where terminal velocity was assumed to be reached (SHELDON& BURROWS1973).Three repli-cate measurements were made per achene. From the same capitula, five external and five internal additional achenes were randomly picked and measured (250 achenes per population). The following morphological traits were measured on all achenes: (1) total propagule mass
(achene-pappus unit, in mg; precision: 0.1mg); (2) achene mass (without pappus, in mg); (3) pappus mass (mg) calculated as the difference (1)-(2); (4) pappus length (mm; precision: 0.1 mm); (5) pappus radius (radius of the wider circle made by the pappus, in mm); (6) achene length (without pappus, in mm); (7) maximal and (8) minimal achene diameters (without pappus, in mm) Fig. 1). The following trait combinations were calculated: (9) achene flattening [(8)/(7)]; (10) pappus mass-radius ratio [(3)/(5)]; (11) achene-pappus mass ratio [(1)/(3)]; (12) plume loading. The latter was defined as the ratio of the total propagule mass (1) to the area of the horizontal projection of the wider circle made by the pappus (Fig. 1) (AUGSPURGER& FRANSON1987, MATLACK1987). It was preferred to the square root of the seed mass divided by the horizontal projection of the wider circle made by the pappus, which is sometimes used instead (SOONS& HEIL
2002), to allow comparison with a more abundant litera-ture. Both trait combinations were highly correlated any-way (r = 0.949).
Fig. 1. S. inaequidens propagule with (a) pappus
radius; (b) pappus length; (c) achene length; (d) one achene diameter and (e) area of the horizontal projec-tion of the wider circle made by the pappus, used to cal-culate the plume loading.
Fig. 2. Schematic representation of (a) tilting plume model dispersion; (b) seed rain pattern and (c) seed rain
Population, individual, capitulum and position (internal/external) differences for those morphological traits were analysed using nested ANOVA on the 500 achenes dataset with position nested within capitulum, capitulum nested within individual and individual nested within population, all of them being random fac-tors. We calculated the linear correlation (Pearson’s r) coefficient between morphological traits on the one hand, either directly measured or mathematically trans-formed (square, square root, logarithm, exponential) and terminal velocity on the other hand, to find the best morphological proxy trait of terminal velocity. In addi-tion, linear regression (with stepwise selection) using least-square estimation was used to model terminal velocity by morphological proxy. All statistical analy-ses were executed using MINITABver. 13.20 (MINITAB
Inc., State College, Pennsylvania).
MODELLING SEED RAIN PATTERN
Model construction
A Gaussian tilted plume model was selected with the aim to predict the seed rain pattern of S.
inae-quidens based on terminal velocity estimations.
Gauss-ian models (PASQUILL 1962, HANNA et al. 1982) are
commonly used to study very light particle dispersal, such as atmospheric pollutants or aircraft spray drift (e.g., STAINIERet al. 2006). However, they have also
been applied to spore dispersal (GREGORYet al. 1961,
FITT& MCCARTNEY1986). With some adaptations they can be used for heavier particle dispersal (OKUBO&
LEVIN1989) where the wind direction is considered as the centre line of the propagule flow. On the perpendi-cular direction to the wind, the distribution has a Gaussian shape with an increase of amplitude while moving downwind from the source. This is the Gauss-ian tilted plume model (Fig. 2a), which extends the Gaussian models to cases where particles have a non-negligible settling velocity. A major shortcoming of these models is that they cannot explicitly simulate par-ticle uplift.
In computing the deposition rate for those parti-cles, this model ignores bouncing or resuspension of particles hitting the ground and assumes that deposition due to diffusion is negligible compared to sedimenta-tion. So, the deposition rate on the ground is given by: (eq. 1), where Vt is the terminal deposition velocity. The expression for the concentration of particles at the ground level is (OKUBO& LEVIN1989):
(eq. 2), where n is the number of particles at source, u is the mean wind speed along X direction at height of release
H. Generally, n = nx(the effective number of particle at distance x) and standard deviations syand szdepend on
x (PASQUILL1962), but one can simplify by ignoring the decay in n and assuming that n is constant (OKUBO&
LEVIN1989).
Since our main interest is to study how far S.
inaequidens achenes move downwind, we suppressed
the crosswind distribution (along y axis, which is Gaussian) by integrating in that direction (OKUBO& LEVIN 1989). The result, called the
crosswind-integrated deposition (CWID), is given by (eq. 3) and represents the seed rain pattern along the X axis.
(eq. 3) To model the seed rain pattern of S. inaequidens, environmental parameters were imposed to mimic favourable and generally encountered dispersal cir-cumstances, with steady winds on a flat open field. Height of release was 0.4 m, similar to the mean capit-ula height observed in Belgian popcapit-ulations (PIERET, unpublished data). A constant wind speed of 5 m s-1 was selected, corresponding to the minimal wind speed needed to detach all the achenes from the recep-tacle (PIERET& STAINIER, unpublished data). It repre-sents a frequently encountered wind in open areas over the flowering season in northwestern Europe. For instance, in the Lonzée (central Belgium) meteor-ological station, such a wind was reached (at 0.4 m high) 68 days (31.7%) over the 2005 flowering season (June – December). Turbulences along the Z axis were fixed at 2% of wind speed along the X axis. As it appeared that terminal velocity exhibited a high intraspecific variation among achenes, the model was adapted to take into account this variability within achene populations rather than simply considering the mean observed terminal velocity. In order to be
consistent with the experimental conditions imposed in the wind-tunnel validation, the terminal velocity of achenes was derived from the morphological proxy trait using the linear regression fitted above. The values used by the model are no direct estima-tions but the centres of proxy trait classes given in Table 1.
Table 1. Plume loading classes (kg m-2) considered for
terminal velocity estimations from morphological measurements.
Class Minimum Maximum
1 0 0.005 2 0.005 0.01 3 0.01 0.015 4 0.015 0.02 5 0.02 0.025 6 0.025 0.03 7 0.03
-The model was set up using MATLAB ver. 7.1
(MATHWORKSInc., Natick, Massachusetts). It provided a curve of crosswind-integrated deposition along X axis, i.e., the seed rain pattern of the species in the con-sidered environmental conditions.
Model validation
The model was validated in a controlled dispersal experiment in the low-speed wind tunnel of the Mechanics and Construction Department of the Gem-bloux Agricultural University. The environmental con-ditions in the tunnel for validation were imposed to be the nearest to those used for model fitting. The tunnel is a closed loop re-circulating wind tunnel designed around a 1200 mm diameter axial blower driven by a 22 kW electric motor with a variable speed controller. To stabilize turbulence intensity, the wind tunnel has a 1 m long honeycomb of 200 mm edge square tubes with a monoplane windbreak grid upstream and a porous textile sheet downstream. The test section of the wind tunnel is 2 m wide, 2 m high, 6 m long and located 1 meter downstream of the fabric. The blower located at the loop opposite to the test section draws air through the tunnel at the desired velocity within the range 0-6 m s-1. The wind speed and the turbulences are controlled by a triaxial supersonic anemometer (preci-sion: 0.05 m s-1).
Three capitula were collected in Gembloux on December 2004 (50°34’27.1’’N; 04°41’15.8’’E; alt. 140 m, population area 400 m2) and stored at ambient temperature in pierced boxes. A capitulum
was maintained vertically ahead of the blowing engine on a pedestal at 0.40 m above the ground and hidden by a cylindrical plastic bowl. The ground was covered with a 6-metre-long adhesive paper reaching the end of the test section of the tunnel. The bottom of the test section (at the opposite of the blowing engine) was covered with a vertical collector (textile), which allowed achene fixation. During the experiment, tur-bulences, defined as the ratio of the standard devia-tion of the wind speed along the axis considered to the average wind speed along the wind direction (X axis), reached 7% (Y axis), 2% (Z axis) and 3% (X axis). The experiments began when the wind reached 5 m s-1 and remained constant. The bowl was then lifted up so that the achenes could disperse. After measuring their distance from the capitulum on the adhesive paper, or their distance from the floor on the vertical collector, achenes were collected for the same mor-phological measurements as described above. Besides morphological measurements, aborted or non-aborted aspect was noted for each achene (binary character). Aborted achenes are typically flat and whitish. Data of the three capitula were pooled for analysis. As there were no replications, no direct adjustment test could be statistically conducted.
With the morphological proxy trait of the achenes, along with the regression equation of Vt previously described, we defined a prediction interval around this regression with a = 0.2. By definition this interval, limited by hyperboles presented in equations (4) and (5), contains 80% of the data of the drop time in still air experiment
(eq. 4)
(eq. 5) Using these two equations instead of the termi-nal velocity regression in the constructed model, we produced two crosswind deposition curves, “model min” and “model max”. These curves encompass the seed rain pattern provided by the model in the imposed environmental conditions. If 80% of the real dispersion data in the wind tunnel are situated between equations (4) and (5), henceforth referred to as the 80% interval, the model is considered as valid (Fig. 3).
Fig 3.
RESULTS
P
OPULATION,
INDIVIDUAL,
CAPITULUM AND POSITION EFFECT ON PROPAGULE TRAITS AND TERMINAL VELOCITYIn the drop time in still air experiment, no
difference was found between populations for any
morphological trait or for terminal velocity (Table
2). A significant part of the variability in
morpho-logical traits was explained either by individuals,
by capitula and/or by the position of the achene
on the receptacle. Individual differences were
sig-nificant (at 0.05 level) for most traits, showing
important intra-population variability. External
and internal achenes significantly differed for
most traits. These differences were particularly
marked for pappus morphology (31.5% and
45.7% of the variance explained by achene
posi-tion for pappus length and pappus radius,
respec-tively). External achenes had a smaller pappus but
a similar mass, and, therefore, a greater plume
loading. Terminal velocity differed among
indi-viduals and positions. The major part (85.0%) of
the variability was explained by the achene
posi-tion, with lower Vt for central achenes.
M
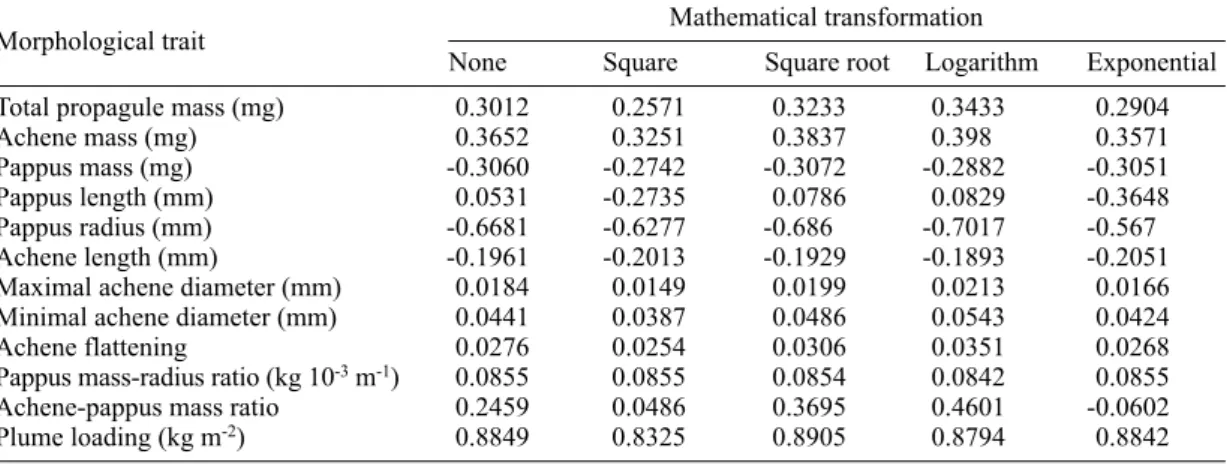
ORPHOLOGICAL PROXY TRAITS AND TERMINAL VELOCITY REGRESSIONTerminal velocity values in the drop time in
still air experiment ranged from 0.171 to 0.513 m s
-1(mean = 0.309 m s
-1; SD = 0.066 m s
-1).
The quantitative morphological trait best
correlated with terminal velocity was the square
root of plume loading (SRPL) (r = 0.891; Table
3). This trait is thus a suitable proxy trait for
ter-minal velocity estimations. Using this proxy
trait, terminal velocity regression was fitted as
follows:
Vt = -0.0192 + 2.53 * SRPL
(eq. 6)
The coefficient of determination was 0.797.
Any additional variable in the model did not
increase the coefficient by more than 0.025 so this
equation was selected and used in the model to
provide terminal velocity values estimated from
achene morphology (Fig. 4).
T able 2. Nested ANOV A to investigate the ef
fects of individual, capitulum and propagule position (centre vs. edge) on morphological trait
s and terminal velocity
. T rait Individuals (population) Capitulum (individuals) Position (capitulum) df MS F P df MS F P df MS F P T
otal propagule mass (mg)
8, 400 0.0397 3.358 ** 40, 400 0.01 18 3.886 *** 50, 400 0.003 1.921 *** Achene mass (mg) 7, 360 0.03 a 3.98 ** 36, 360 < 0.01 a 3.12 *** 45, 360 < 0.01 a 1.95 *** Pappus mass (mg) 7, 359 0.002 a 6.15 *** 36, 359 < 0.01 a 1.77 * 45, 359 < 0.01 a 1.64 ** Pappus length (mm) 8, 399 9.66 a 9.2 *** 40, 399 1.05 1.13 n.s. 50, 399 0.9324 6.02 *** Pappus radius (mm) 8, 400 4.926 2.948 * 40, 400 1.6709 1.124 n.s. 50, 400 1.487 6.83 *** Achene length (mm) 8, 400 2.3412 1 1.69 *** 40, 400 0.2003 3.966 *** 50, 400 0.0505 5.00 ***
Maximal achene diameter (mm)
8, 400 0.0083 3.639 ** 40, 400 0.0023 1.199 n.s. 50, 400 0.0019 1.348 n.s.
Minimal achene diameter (mm)
8, 399 0.02 a 5.19 *** 40, 399 < 0.01 a 1.25 n.s. 50, 399 < 0.01 a 1.19 n.s. Achene flattening 8, 399 0.150 a 2.74 * 40, 399 0.0548 1.12 n.s. 50, 399 0.0489 0.97 n.s.
Pappus mass-radius ratio (g m
-1) 7, 359 < 0.01 a 8.82 *** 36, 359 < 0.01 a 1.97 * 45, 359 < 0.01 a 0.76 n.s.
Achene-pappus mass ratio
7, 359 19102 a 0.99 n.s. 36, 359 19362 a 0.99 n.s. 45, 359 19468 1.1 1 n.s. Plume loading (mg mm -2) 8, 400 < 0.01 a 2.319 * 40, 400 < 0.01 a 1.099 n.s. 50, 400 < 0.01 a 4.554 *** T erminal velocity (m s -1) 8, 200 2.586 2.336 * 40, 200 1.1 1 0.74 n.s. 50, 200 1.5 61.98 *** Note. ***: P < 0.001; **: 0.001 ≤ P < 0.01; *: 0.01 ≤ P < 0.05; n.s.: not significant;
M
ODEL VALIDATIONAmong the 192 dispersed propagules in the
three pooled wind-tunnel experiments, 101
(52.6%) fell on the horizontal 6-metre-long
col-lector and 91 (47.4%) on the vertical one.
Among the latter, 21 were collected above 0.4 m
and cannot be considered for the Gaussian tilted
plume model, as the model cannot simulate
uplift. The case of those uplifted achenes is
treated separately. Fig. 5 shows the horizontal and
vertical repartition of the remaining 171 achenes
considered in the wind tunnel, along with
the modelled curve and the earlier described
80% interval. Horizontally 77.2% and vertically
75.7%, were inside this 80% interval. The model,
therefore, does not reach proper validation, but
can be considered as reasonably fitting the achene
dispersal in the wind tunnel.
S
EED RAIN PATTERNOnce the model constructed, the seed rain
pattern under the selected environmental
condi-tions was assessed. Fig. 6 shows the curve of the
cumulated crosswind-integrated deposition for
each plume loading class (Table 1) against the
distance from the source (step 0.05 m). On a flat
open area, under a 5 m s
-1stable wind and for an
average height of release, 32.10% of the
dis-persed achenes are deposited in the nearest 6 m
from the mother plant, with a peak at 5.2 m;
63.19% are dispersed within 10 m, and 99.83%
within 100 m.
The 21 uplifted achenes (10.94% of all
dis-persed achenes) were collected from 0.43 to
0.86 m above ground. Nine of them were
aborted. Viable uplifted achenes represented
6.25% of all dispersed achenes. They were
not significantly different from non-uplifted
achenes for achene mass (Mann-Whitney test;
W = 12036; P = 0.431), pappus surface
(Mann-Whitney test; W = 12019; P = 0.752) and plume
loading (Mann-Whitney test; W = 12132; P =
0.688).
Table 3. Pearson’s coefficient of correlation (r), calculated between all morphological traits on the one hand, as
measured or mathematically transformed, and terminal velocity on the other hand.
Mathematical transformation Morphological trait
None Square Square root Logarithm Exponential
Total propagule mass (mg) 0.3012 0.2571 0.3233 0.3433 0.2904
Achene mass (mg) 0.3652 0.3251 0.3837 0.398 0.3571
Pappus mass (mg) -0.3060 -0.2742 -0.3072 -0.2882 -0.3051
Pappus length (mm) 0.0531 -0.2735 0.0786 0.0829 -0.3648
Pappus radius (mm) -0.6681 -0.6277 -0.686 -0.7017 -0.567
Achene length (mm) -0.1961 -0.2013 -0.1929 -0.1893 -0.2051
Maximal achene diameter (mm) 0.0184 0.0149 0.0199 0.0213 0.0166
Minimal achene diameter (mm) 0.0441 0.0387 0.0486 0.0543 0.0424
Achene flattening 0.0276 0.0254 0.0306 0.0351 0.0268
Pappus mass-radius ratio (kg 10-3m-1) 0.0855 0.0855 0.0854 0.0842 0.0855
Achene-pappus mass ratio 0.2459 0.0486 0.3695 0.4601 -0.0602
Plume loading (kg m-2) 0.8849 0.8325 0.8905 0.8794 0.8842
Fig. 4. Model equation for predicting terminal velocity
DISCUSSION
The Gaussian tilted plume model provided
a seed rain pattern for the environmental
condi-tions that we imposed. It did not reach proper
validation at the 80% level, but fitted the data
obtained in the wind tunnel reasonably well. The
produced pattern corresponds to a simplified
sit-uation as compared to field conditions, as
sev-eral hypotheses were assumed for model fitting
(no resuspension of seeds, n constant, negligible
deposition due to diffusion). The validation
experiment was limited to three dispersal events
and showed a good agreement between
pre-dicted and mesured data only for short distances.
The seed rain pattern is only efficient under the
environmental conditions considered for model
construction: flat area, wind speed around 5 m s
-1, low turbulences and release height of 0.40 m.
Under these conditions, most achenes deposit in
the vicinity of the parent plant: 63.2% within 10
m; 99.8% within 100 m. The maximum
deposi-tion rate is reached at 5.2 m. In the field,
maxi-mum winds and turbulences can be higher than
those considered. Under those conditions the
global seed rain pattern may be more spread out
and the proportion of uplifted seeds can be
higher, especially in the case of gusts.
Neverthe-less, the wind speed considered is such that most
(if not all) achenes are detached from the
recep-tacle. If wind speed increases gradually, most
achenes are already dispersed when faster winds
occur, even if achene abscission was shown
not to be independent of wind speed (G
REENE2005). If wind speed increase is not gradual,
gusts may however make the seed rain pattern
different. Other aspects, such as topography or
surrounding vegetation and shape of the parent
plant (N
IKLAS1984) may also impact seed rain
pattern in the field, so that the real pattern may
dramatically differ from that modelled here.
Besides, the invasion pattern of S. inaequidens
was shown not to be isotropic: the species seems
to disperse preferentially along roadsides and
railways, which act like corridors along which
stronger winds are more often reached (E
RNST1998).
Fig. 5. Horizontal (a) and vertical (b) repartition of the 171 non-uplifted achenes dispersed in the wind tunnel,
along with the modelled curve and the 80% interval (“model min” and “model max”). Dots represent the proportion of achenes per 5 cm class along the horizontal and vertical collectors. Circled measurement dots are outside the 80% interval. In the second figure, height is along the horizontal axis whereas it is vertical in the wind tunnel.
Fig. 6. Seed rain pattern of S. inaequidens. The curve
is shown for the nearest 100 m from the parent plant. Percentage of deposition was calculated every 0.05 m.
The settling terminal velocities measured for
S. inaequidens in this study are comparable to
those given by E
RNST(1998) for populations in
the Netherlands. However, they are relatively low
compared to other Asteraceae: among 39 species
for which terminal velocity values were found in
the literature and ranked increasingly, S.
inae-quidens ranked eleventh (S
HELDON& B
URROWS1973, M
ATLACK1987, S
CHULZet al. 1991,
A
NDERSEN1992, 1993, K
AHRS1994, A
SKEWet al.
1997, T
ACKENBERGet al. 2003). This indicates
that S. inaequidens has a relatively high potential
for exploiting favourable wind conditions. As
generally reported for Asteraceae, the square root
of the plume loading was the best proxy trait for
terminal velocity (A
UGSPURGER1986, M
ATLACK1987, A
NDERSEN1993, but see S
OONS& H
EIL2002). Our assessment of terminal velocity by
regression on the square root of the plume loading
showed an acceptable precision compared to
other studies (M
ATLACK1987, A
NDERSEN1993,
C
ODY& O
VERTON1996). As terminal velocity of
a wind-dispersed diaspores is a major component
of its dispersal ability (G
REENE& J
OHNSON1986,
M
ATLACK1987), our results indicate that S.
inae-quidens achenes with low plume loading have a
longer dispersal distance, i.e., light propagule
and/or large pappus will be the best
characteris-tics for dispersion.
In the context of plant invasion, estimating
the tail of the seed shadow is of particular interest
as it can have very important consequences on the
colonisation rate of new sites (P
ORTNOY& W
ILL -SON1993). Although our model and experimental
approach are not explicitly designed to evaluate
rare long distance events, some interesting
insights may be gained from both the modelled
seed shadow and the observed dispersal pattern in
the wind tunnel. Our model suggests a capacity
for dispersal up to 200 m under favourable and
relatively common wind conditions over the
flowering season. Measuring seed dispersal
capacity beyond tens of metres directly in the
field is usually constrained by experimental
design. Because of the necessity to keep sampling
effort constant over increasing distances, the
number of seed traps should be doubled when
doubling distances (B
ULLOCK& C
LARKE2000).
This results in unmanageable experimental
designs. We demonstrated that simple
mechanis-tic models, such as the Gaussian plume model,
with morphological seed characteristics that are
relatively easy to measure such as plume loading,
might help to understand the vulnerability of
neighbouring unoccupied sites to colonisation
from established populations.
In addition to seed included in the tail of the
seed shadow, it has long been known that seed
uplift is a key mechanism for long distance
disper-sal (N
ATHANet al. 2002). In our experiment 6.25%
of viable achenes were uplifted. These were not
forecasted by the model. Long-distance dispersal
may therefore represent up to 6.25% even under
wind conditions with low turbulences. In
compar-ison, in a study of another Asteraceae with a high
dispersal capacity, Cirsium vulgare, K
LINKHAMERet al. (1988) found that just over 10% of the
dis-persed seeds were caught by updrafts and were
carried out of the study area (more than 32 m).
Studying the dispersal of Crepis praemorsa,
S
KARPAASet al. (2004) found that 4% of the seeds
were uplifted and carried away from the
popula-tion. In a recent study on the wind-dispersed
inva-sive Conyza canadensis (Asteraceae), D
AUERet
al. (2006) found that seeds regularly dispersed at
least 500 m from the source population despite
that 99% of seeds were found in the nearest 100
m. As one S. inaequidens plant can produce up to
1500 capitula annually (M
ONTY, unpublished
data) bearing roughly 100 achenes each (L
OPEZ-G
ARCIA& M
AILLET2005), the seed rain (total
amount of achenes produced per year) of S.
inae-quidens can reach 150 000 achenes plant
-1y
-1under favourable conditions. A single large S.
inaequidens individual can thus potentially
gener-ate more than 9 000 uplifted achenes out of the
population (i.e., more than 200 m away from the
parent). This value is found for low turbulent
con-ditions in the wind tunnel; hence it may be an
underestimation compared to natural conditions.
This represents an important colonisation
poten-tial, but information on post-dispersal survival is
needed to predict long-distance colonisation.
Diaspore weight and dispersal structure are linked
to separate ecological functions, which may lead
to contrasting forms of selection during invasion.
Diaspores with lower plume loadings will be the
best disperser for colonisation of new areas, but
heavier seeds are more likely to produce large and
vigorous seedlings (B
LACK1956, D
OLAN1984),
and, therefore, presumably confer an advantage in
competition and fitness. According to this, one
may expect that seeds with low plume loading and
heavier seeds, i.e., larger pappus surface, would be
favoured during invasion, thanks to a higher
prob-ability to found new populations. Yet, our results
do not support this hypothesis because uplifted
achenes were not morphologically different from
others.
The present study shows how a seed
disper-sal modelling approach resulted in valuable
infor-mation about further S. inaequidens invasion. The
Gaussian tilted plume model might be generalised
to other anemochorous alien species if
long-distance dispersal is not the major focus, at least if
one acknowledges the limitations of the model
about seed uplift.
ACKNOWLEDGEMENTS
Wind-tunnel experiments were made possible thanks to Marie-France Destain and the research staff of the Mechanics and Construction Department of the Gembloux Agricultural University. Guy Buchet pro-vided technical assistance during the research project. We thank Marc Aubinet, Sonia Vanderhoeven, Ingrid Parmentier and Julien Piqueray for helpful comments on the methodology and the manuscript. For wind speed data, we thank Christine Moureaux and Marc Aubinet. The research was supported by the projects FRFC 2.4556.05 from the Belgian F.N.R.S. (Fonds National de la Recherche Scientifique) and by the Bel-gian Science Policy, and is part of the project “INPLANBEL: Invasive Plants in Belgium: Patterns, Processes and Monitoring (contract EV/16/27A)”. Arnaud Monty holds a doctoral grant from the F.N.R.S.
REFERENCES
ANDERSENM.C., 1992. — An analysis of variability in seed settling velocities of several wind-dispersed Asteraceae. Am. J. Bot. 79: 1087-1091.
ANDERSENM.C., 1993. — Diaspore morphology and
seed dispersal in several wind-dispersed Aster-aceae. Am. J. Bot. 80: 487-492.
ASKEWA.P., CORKERD., HODKINSOND.J. & THOMPSON
K., 1997. — A new apparatus to measure the rate of fall of seeds. Funct. Ecol. 11: 121-125.
AUGSPURGERC.K., 1986. — Morphology and dispersal
potential of wind-dispersed diaspores of neotropi-cal trees. Am. J. Bot. 73: 353-363.
AUGSPURGERC.K. & FRANSONS.E., 1987. — Wind
dis-persal of artificial fruits varying in mass, area, and morphology. Ecology 68: 27-42.
BLACKJ.N., 1956. — The influence of seed size and depth of sowing on the emergence and early vegetative growth of subterranean clover
(Tri-folium subterraneum L.). Aust. J. Agr. Res. 7:
98-109.
BULLOCKJ.M. & CLARKER.T., 2000. — Long distance
seed dispersal by wind: measuring and modelling the tail of the curve. Oecologia 124: 506-521. CODYM.L. & OVERTONJ.M., 1996. — Short-term
evo-lution of reduced dispersal in island plant popula-tions. J. Ecol. 84: 53-61.
CRONKQ.C.B. & FULLERJ.L., 1995. — Plant invaders:
The threat to natural ecosystems: 241 p.
Chap-man and Hall, London.
CSANADY G.T., 1963. — Atmospheric dispersal of
heavy particles. First Canadian Conference on
Combustion and Fuel Technology. Ottawa. DAUER J.T., MORTENSEN D.A. & VANGESSEL M.J.,
2006. — Temporal and spatial dynamics of long-distance Conyza canadensis seed dispersal. J.
Appl. Ecol. 44: 105-114.
DOLANW., 1984. — The effect of seed size and
mater-nal source on individual size in a population of
Ludwigia leptocarpa (Onagraceae). Am. J. Bot.
71: 1302-1307.
ERNSTW H.O., 1998. — Invasion, dispersal and
ecol-ogy of the South African neophyte Senecio
inae-quidens in the Netherlands: from wool alien to
railway and road alien. Acta Bot. Neerl. 47: 131-151.
FITTB.D. & MCCARTNEYH.A., 1986. — Spore disper-sal in relation to epidemic models. In: LEONARD
K.J., FRYW.E. (eds.). Plant disease
epidemiol-ogy. Vol. 1, pp. 311-345. MacMillian Publishing
Company, New York.
GREENED.F., 2005. — The role of abscission in
long-distance seed dispersal by the wind. Ecology 86: 3105-3110.
GREENED.F. & CALOGEROPOULOSC., 2002. — Measur-ing and modellMeasur-ing seed dispersal of terrestrial plants. In: BULLOCKJ.M., KENWARDSR.E., HAIL
R.S. (eds.). Dispersal Ecology, pp. 3-23. Black-well Science, Oxford.
GREENE D.F. & JOHNSON E.A., 1986. — Dispersal
capacity and seed production in anemochorous plants. Oecologia 68: 629-631.
GREGORY P.H., LONGHURST T.J. & SREERAMULA T.,
1961. — Dispersion and deposition of airborne
Lycopodium and Ganoderma spores. Ann. Appl. Biol.L 49: 645-658.
GUILLERMJ.L., LEFLOC'HE., MAILLETJ. & BOULET
C., 1990. — The invading weeds within the Mediterranean Basin. In: DICASTRIF., HANSEN
A.J., DEBUSSCHE M. (eds.). Biological
inva-sions in Europe and the Mediterranean Basin.,
pp. 61-84. Kluwer Academic Publishers, Dor-drecht.
HANNA S.R., BRIGGS G.A. & HOSKERR.P., 1982. —
Handbook on atmospheric pollution. 102 p.
Tech-nical information centre, Department of Energy, Washington D.C.
HARPER J.L., 1977. — Population biology of plants:
892 p. Academic Press, Orlando.
HIGGINS S.I., RICHARDSON D.M. & COWLING R.M.,
2001. — Validation of a spatial simulation model of a spreading alien plant population. J. Appl.
Ecol. 38: 571-584.
JONGEJANSE. & SCHIPPERSP., 1999. — Modelling seed
dispersal by wind in herbaceous species. Oikos
87: 362-372.
KAHRS J., 1994. — Aerodynamic properties of weed seeds. Int. Agrophysics 8: 259-262.
KLINKHAMERP.G.L., DEJONGT.J. & VANDERMEJDEN
E., 1988. — Production, dispersal and predation of seeds in the biennial Cirsium vulgare. J. Ecol.
76: 403-414.
LOPEZ-GARCIA M. & MAILLETJ., 2005. — Biological characteristics of an invasive African species.
Biol. Invasions 7: 181-194.
MATLACKG.R., 1987. — Diaspore size, shape, and fall
behavior in wind-dispersed plant species. Am. J.
Bot. 74: 1150-1160.
MICHEZJ.M., 1995. — Le séneçon du Cap, de la laine à la vigne. Phytoma 468: 39-41.
MORSED.H. & SCHMITTJ., 1985. — Propagule size, dispersal ability, and seedling performance in
Asclepias syriaca. Oecologia 67: 372-379.
NATHAN R., KATUL G.G., HORN H.S., THOMAS S.M.,
ORENR., AVISSARR., PACALAS.W. & LEVINS.A., 2002. — Mechanisms of long-distance dispersal of seeds by wind. Nature 418: 409-413.
NIKLAS K.J., 1984. — The motion of windborne
pollen grains around conifer ovulate cones: implications on wind pollination. Am. J. Bot. 71: 356-374.
OKUBOA. & LEVINS.A., 1989. — A theoretical
frame-work for data analysis of wind dispersal of seeds and pollen. Ecology 70: 329-338.
PARKERI. M., SIMBERLOFFD., LONSDALEW. M., GOOD
-ELLK., WONHAMM., KAREIVAP.M., WILLIAMSON
M.H., HOLLE B.V., MOYLE P.B., BYERS J.E. &
GOLDWASSER L., 1999. — Impact: toward a
framework for understanding the ecological effects of invaders. Biol. Invasions 1: 3-19.
PASQUILL F., 1962. — Atmospheric diffusion: 297 p.
Van Nostrand, London.
PORTNOYS. & WILLSONM., 1993. — Seed dispersal
curves: Behavior of the tail of the distribution.
Evol. Ecol. 7: 24-44.
PYSEKP., RICHARDSOND.M., REJMANEKM., WEBSTER
G.L., WILLIAMSONM.H. & KIRSCHNERJ., 2004. — Alien plants in checklists and floras: towards better communication between taxonomists and ecologists. Taxon 53: 131-143.
SCHULZ B., DORINGJ. & GOTTSBERGER G., 1991. — Apparatus for measuring the fall velocity of anemochorous diaspores, with results from two plant communities. Oecologia 86: 454-456. SHELDONJ.C. & BURROWSF.M., 1973. — The dispersal
effectiveness of the achene-pappus units of selected Compositae in steady winds with con-vection. New Phytol. 72: 665-675.
SKARPAASO., STABBETORPO.E., RONNINGI. & SVEN
-NUNGSENT.O., 2004. — How far can a hawk's
beard fly? Measuring and modelling the dispersal of Crepis praemorsa. J. Ecol. 92: 747-757. SOONSM.B. & HEILG.W., 2002. — Reduced
coloniza-tion capacity in fragmented populacoloniza-tions of wind-dispersed grassland forbs. J. Ecol. 90: 1033-1043. SOONSM.B., HEILG.W., NATHANR. & KATULG.G.,
2004. — Determinants of long-distance seed dis-persal by wind in grasslands. Ecology 85: 3056-3068.
STAINIERC., ROBAYEV., SCHIFFERS B. & LEBEAUF.,
2006. — Modelling the spray drift by a Gaussian tilting plume model. Aspects Appl. Biol. 77: 281-287.
TACKENBERGO., 2003. — Modelling long-distance
dis-persal of plant diaspores by wind. Ecol. Monogr.
73: 173-189.
TACKENBERG O., POSCHLOD P. & BONN S., 2003. —
Assessment of wind dispersal potential in plant species. Ecol. Monogr. 73: 191-205.
WILLSONM. & TRAVESETA., 1993. — The ecology of
seed dispersal. In: Fenner M. (ed.). Seeds: The
ecology of regeneration in plant communities,