HAL Id: hal-01518739
https://hal.archives-ouvertes.fr/hal-01518739v2
Submitted on 30 Nov 2017
HAL is a multi-disciplinary open access archive for the deposit and dissemination of sci-entific research documents, whether they are pub-lished or not. The documents may come from teaching and research institutions in France or abroad, or from public or private research centers.
L’archive ouverte pluridisciplinaire HAL, est destinée au dépôt et à la diffusion de documents scientifiques de niveau recherche, publiés ou non, émanant des établissements d’enseignement et de recherche français ou étrangers, des laboratoires publics ou privés.
To cite this version:
Lucas Bourreau, Véronique Bouteiller, Franck Schoefs, Laurent Gaillet, Benoit Thauvin, et al.. On-site Corrosion Monitoring - Reliability. International RILEM Conference on Materials, Systems and Structures in Civil Engineering Conference segment on Electrochemistry in Civil Engineering, Aug 2016, LYNGBY, Denmark. 10 p. �hal-01518739v2�
ON-SITE CORROSION MONITORING – RELIABILITY
Lucas Bourreau (1), Véronique Bouteiller (2), Franck Schoefs (3), Laurent Gaillet (4), Benoît Thauvin (5), Julien Schneider (6), Samuel Naar (7)
(1) CONCRETE, Siège Social, F78350 Jouy-en-Josas, France
(2) Université Paris Est, IFSTTAR, MAST, SDOA, F77447 Marne la Vallée, France
(3) LUNAM Université, Université de Nantes, GeM, CNRS UMR 6183, Research Institute in Civil Engineering and Mechanics, France, IUML FR CNRS 3473, Sea and Littoral research Institute
(4) LUNAM Université, IFSTTAR, MAST, SMC, F44344 Bouguenais, France (5) CEREMA DTer Ouest, F22015 Saint-Brieuc, France
(6) CEREMA DTer IdF, F77171 Sourdun, France
(7) CONCRETE, Agence Ouest, F44115 Haute-Goulaine, France
Abstract
The European countries have a great number of reinforced concrete bridges and many of them are suffering from corrosion. Prior to define a repair strategy, a precise and reliable diagnosis of the corrosion state of the reinforcing bars is mandatory. In order to carry out this inspection, many challenges remain especially for the RC structures exposed to a marine environment.
The assessment strategy is based on the choice of Non Destructive Techniques taking into account their precision, location, number of measurements, the environmental conditions and duration. Currently, more empirical approaches are used by structure's owners and we propose to implement statistical methods as well as data mining for a more reliable and optimal diagnosis.
Within the DéCoF-Ré project, the diagnosis tools and the evaluations made afterwards are established from data obtained on different piers of a real bridge, based on NDT such as visual inspection of the degradations, rebar's localization, half-cell potential mapping, electrical concrete resistivity mapping and corrosion rate measurements performed in 2015. The first results are presented. They concern the effect of environment on the reliability of diagnosis. An additional durability study based on the analysis of durability indicators (such as chloride profiles) will be conducted in 2016.
1. Introduction
Corrosion of steel rebar in concrete is the main cause of degradation of reinforced concrete (RC) structures [1, 2]. In new structures, steel is in a passive state due to the high alkalinity of
the concrete (pH~13). However, with time, full carbonation of the concrete cover or chloride ions penetration up to the rebar level can induce an active corrosion of the steel. At the steel/concrete interface, the formation of iron oxides which volume can be 2 to 6.5 times higher than the iron itself, internal stress occurs which can induce cracks, delamination or even spallings in concrete [3]. The reinforcement corrosion can also lead to a reduction of the steel cross section that will modify the carrying capacity of the structure, reducing its service level, and even its service life and eventually ending up to the structure's collapse [1-3].
For reinforced concrete structures exposed in a marine environment, steel reinforcement corrosion is mainly due to the chloride penetration in the concrete cover. Chloride contamination can affect bridge elements submerged in sea water, in the tidal zone, in the splash zone above high tide and in the atmospheric zone [4-7].
For steel structures, different exposure zones had already been defined: atmospheric, splash, tidal and submerged zones [8] from two interreg projects (Medachs and Duratinet). Literature on corrosion of RC structure due to chloride contamination mainly comes from laboratory tests [9-13] or accelerated marine exposure under controlled climatic conditions. Investigations on corrosion’s state of RC structure exposed to a marine environment for a long time are scarce [14-16]. Therefore, in order to improve the understanding of the real corrosion behaviour, “on-site” studies are needed.
This paper presents preliminary results on half-cell potential measurements performed on a bridge in a marine environment in France and proposes a numerical treatment of the data that will highlight the tide effect.
2. Materials and methods
2.1 Description of the multi-span bridge
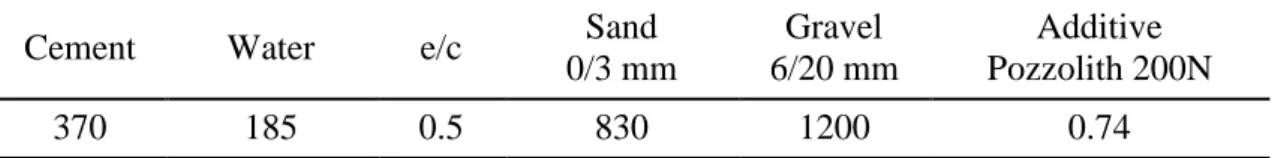
The île de Ré bridge is located in the French Atlantic coast. It was built in 1987-1988 to provide an access to the Ré Island from La Rochelle mainland. The bridge has a total length of 2928.5 meters, a width of 15 meters and a maximum height of 30 meters above the sea. Among its 28 piers, 24 piers (P4 to P27) are in the sea as illustrated in Fig.1. Piers were raised using a concrete composition based on a CPJ 45 RPM cement that today would correspond to a CEM II/B cement (Tab. 1).
Figure 1: Description of the île de Ré bridge.
Table 1: Concrete mix composition (in kg/m3). Cement Water e/c Sand 0/3 mm Gravel 6/20 mm Additive Pozzolith 200N 370 185 0.5 830 1200 0.74 Shipping chanel
2.2 Investigated zones
Corrosion diagnosis was performed on 15 piers (14 in seawater using a vessel and 1 on the beach). The measurements presented in this paper are those that were carried out on the most exposed side of the investigated piers (Fig. 2) meaning dominant winds (WSW for La Rochelle with 30 km/h mean speed), daily sunshine and strongest wetting/drying cycles. Measurements were performed during the rising tide, thus allowing the concrete to dry and to oxygenate. The investigated area's dimensions are: height 3m and width 1.85m. Measurements were performed for the same height between +3.95 and +6.95 m CD (where water heights are expressed relative to Chart Datum (CD) corresponding to La Rochelle – La Pallice harbour in France). The investigated area, as shown on Fig. 3, includes 3 exposure zones (tidal, splash and atmospheric) which boundaries are defined by tidal coefficients according to corrosion of steel structures [8], one of the objective of the paper is to analyse is this discretization is convenient for RC structures also:
- Mean High Water Springs (MHWS) is defined by a tidal coefficient of 95 for water height of +6.00 m CD;
- Mean High Tide (MHT) is defined by a tidal coefficient equal to 70for water height of +5.45 m CD.
Figure 2: Top view of the pier. Figure 3: Investigated area, corresponding exposure zones and water heights.
2.3 Corrosion diagnosis methodology
Corrosion diagnosis methodology was divided in six steps. The first step consisted in finding the general bridge's information from the archives. The following steps were then realised using a vessel. The second step consisted in a visual inspection of the piers to obtain a general degradation state (rust spots, leachings, cracks, etc.). The third step aimed at locating the reinforcements (horizontal and vertical rebars) using a ground penetrating radar (EasyScan 1.6 GHz, GSSI®). In the fourth step, concrete electrical resistivity was measured using a Wenner probe (Resipod 5 cm, PROCEQ®). The fifth and sixth steps were dedicated to the electrochemical measurements, respectively half-cell potentials (Canin+ (copper/saturated copper sulphate electrode (CSE, +318 mV vs NHE), PROCEQ®) and corrosion rates (GalvaPulse, Germann Instrument®). The half-cell potential method is the most common non-destructive measurement used in corrosion diagnosis [7, 11-13]. In this paper, only the measurements performed along the horizontal reinforcements with a 5 cm spacing (meaning 36 readings per horizontal) are presented. Depending on the piers, 14 to 16 horizontal reinforcements are present in the three meters high investigated area.
North West
3. Results and discussion
3.1 Potential data and interpretation
Corrosion evaluation by using half-cell potential measurements is the most typical procedure for the inspection of RC structures. However the interpretation of the measurements can result tricky.
The ASTM C876-91 standard [12] indicates a direct correlation between fixed potential values and the probability of corrosion (this standard has been massively discussed and a new version was published in 2009 [13]). Potential values less than -350 mV/CSE are attributed to a high probability of corrosion (>90%). Assuming this interpretation, from the whole measurements realised on the bridge, the pier's zones with heights lower than +4.95 m CD would present a 90% probability of corrosion. However this conclusion is not confirmed by the visual inspection observations.
In a COST-509 document published in 1997 [17], for large surveyed areas, potential values were represented as frequency distributions (10 to 20 mV class) or cumulative probability. A first estimation of the corrosions state was made by looking at the potential gradients: potential differences greater than 150 – 200 mV indicate corrosion of the area with lower potentials. However no dimensions of the "large area" were mentioned. Assuming this interpretation, a high risk of corrosion is observed for all the piers with potential differences between 340 and 555 mV considering the whole inspected area (3x1.85m). For pier B, presented on Fig. 4a, the difference is equal to 515 mV (max=-115 mV, min=-630 mV). If the considered large area is divided in 3 horizontal zones of 1x1.85m, potential differences for each zone become equal to: 140 mV for Zone 1 (bottom), 170 mV for Zone 2 (middle) and 330 mV for Zone 3 (top). As expected, risk of corrosion depends on the dimensions of the considered area.
In 2001, the RILEM technical committee 154 [11] recommended an interpretation which consisted in considering larger gradients ∆E/∆x based on the potential maps (for example an equicontour line plot with a maximum potential interval of 50 mV) in order to locate areas of corroding reinforcement. However no value of the "larger gradients" was mentioned. But in the literature, a larger gradient of 8mV/cm is generally used to indicate a high risk of corrosion [15, 18]. Equicontour larger gradient plot for pier B is presented on Fig. 4b, gradient is superior at 8mV/cm only on the top right corner. Moreover in the RILEM recommendations, potential mapping results should be combined in a useful way with other non-destructive methods such as resistivity mapping. However, in the case of this bridge, the resistivity values were not so useful regarding the reinforcement and its corrosion risk because of the rather thick concrete cover (≈8cm).
The equicontour potential line plot of Pier B (Fig. 4a) shows that the potentials are less and less negative with increasing heights. Considering the bottom part of the investigated area, potentials are in the range -700 to -650 mV (+3.95 and +4.30 m CD). These low values can be explained because the reinforced concrete is in the tidal zone meaning that the concrete is saturated of seawater and lacks of oxygen [11-13, 18-21]. For the top part of the investigated area, potentials are in the range -150 to -100mV (+6.60 and +6.95 m CD) because concrete is dry and oxygenated.
a) b)
Figure 4: Half-cell potential maps of pier B, equicontour potential line plot (a) and equicontour potential gradients ∆E/∆x plot (b).
From literature data it has been proved that potential readings can be very negative without significant presence of corrosion [7, 11]. This phenomenon can be induced by concrete cover, concrete resistivity and oxygen availability [11, 19-21]. This latter is very likely in marine environment for elements in submerged or in tidal zones. Therefore, the observations of the vertical potential gradient may not be due to the corrosion process but to the environment. In the next section of this paper, a model to characterize the tide’s effect on the potentials is proposed.
3.2 Modelling method
First, using a criterion of no damage from visual corrosion, four piers (upon 15) have been selected as "reference" piers. For each of these four piers, the mean value (μEcorr) and the
standard deviation (σEcorr) have been calculated for each horizontal reinforcement (in the
three meters high investigated zone, there are 14 rebars and 36 measures were performed per rebar). In order to delete the outliers values from the main trend, the absolute potential values which were not included in the range defined by μEcorr+/- 3 σEcorr [22], were deleted of the
dataset (~3% of the original values were removed). Then, the mean trend for the bridge was defined for each horizontal rebar taking into account the four reference piers by calculating the mean potential value and the standard deviation. The curve presented in Fig. 5 is representative of the tide’s effect on the corrosion potential values.
In a second step, the different behaviours visually observed on Fig. 5 were distinguished using a mathematical approach: the slope between two potential values was computed by accounting its uncertainty. These mathematical results are presented on Fig. 6. The slope range corresponding to the Behaviour 1 is defined by considering the extreme value on the left as the lower value. Once a slope value is lower than this extreme value a behaviour modification is considered. The same method is used to define the slope range corresponding to the Behaviour 3, the extremal value on the right as the highest value. Other slopes values
0 0,5 1 1,5 3,95 4,45 4,95 5,45 5,95 6,45 6,95 -700 -650 -600 -550 -500 -450 -400 -350 -300 -250 -200 -150 -100 -50 0
Ecorr in mV/CSE Gradient in
mV/cm 0 2 4 6 8 10 12 14 0 0,5 1 1,5 3,95 4,45 4,95 5,45 5,95 6,45 6,95
correspond to the Behaviour 2. Boundaries between two different behaviours are represented by two vertical lines.
Figure 5: Mean corrosion potential trend of the bridge versus water height (based on four reference piers).
Figure 6: Experimental slope and evolution of slope values for defining corrosion behaviour.
In a third step, a linear regression is used to fit each of the three behaviours and the error of measurement (ξC) which is the sum of the statistical error (ξCStat) and the repeatability error
(ξCRep) is included. The statistical error is negligible as the mean potential value is calculated
upon 144 experimental values for each horizontal rebar. The repeatability error is unknown for on-site measurement, but at least the device error (+/-5 mV for the Canin+’s bar electrode), noted ξCCanin, was considered. The error of measurement is just considered equal to the
device error. Results are presented on Fig. 7. Solid line corresponds to the fit using experimental data, dashed line corresponds to the fit taking into account the error of measurement. Grey straights (solid or dashed) represent potential evolution into the boundaries between two different behaviours. The parameters of the linear regression are
Behaviour 1
Behaviour 2
given in Tab. 2. Coefficients of determination (R²) are very good in each case, excepted for Behaviour 3 with a value of 0.21 that corresponds to a horizontal line.
Figure 7: Mean corrosion potential with the error of measurement, tide’s effect law and change in slope corresponding to a change in the exposure zone versus water height.
Table 2: Linear regression’s description corresponding to the three behaviours.
Number of experimental points Slope (mV/m) Y-intercept (mV) R² Behaviour 1 4 235.9 -1522.8 0.9897 Behaviour 2 3 125.4 -939.3 0.9112 Behaviour 3 5 12.4 -297.1 0.2108 3.3 Discussion
Tab. 3 resumes the boundaries results found in the previous section together with the theoretical ones defined for steel structures [8] (Fig. 3). Boundaries between two different behaviours can be correlated to the water height and associated tidal coefficient. Boundaries between splash/atmospheric zones are very close to the theoretical ones. But they are quite different for tidal/splash zones. Those boundary differences may be explained by: first, theoretical boundaries have been defined for steel structures, corrosion behaviour may be different for RC structures. Second, theoretical boundaries have been defined for a very calm sea and ideal climatic conditions, but those particular environmental conditions are very rare. Sea level depends on several parameters, for example wind creates waves and a low atmospheric pressure provokes an increase of sea level and inversely.
Table 3: Boundaries between 2 exposures zones in meters CD and associated tidal coefficient.
Tidal and Splash zones Splash and Atmospheric zones
Water height Tidal coefficient Water height Tidal coefficient
Theoretical 5.45 70 6.00 95 Modelling 4.83 - 5.03 42 - 52 5.64 - 5.89 78 - 90 Behaviour 1 Behaviour 2 Behaviour 3
Pier A Pier B Pier C
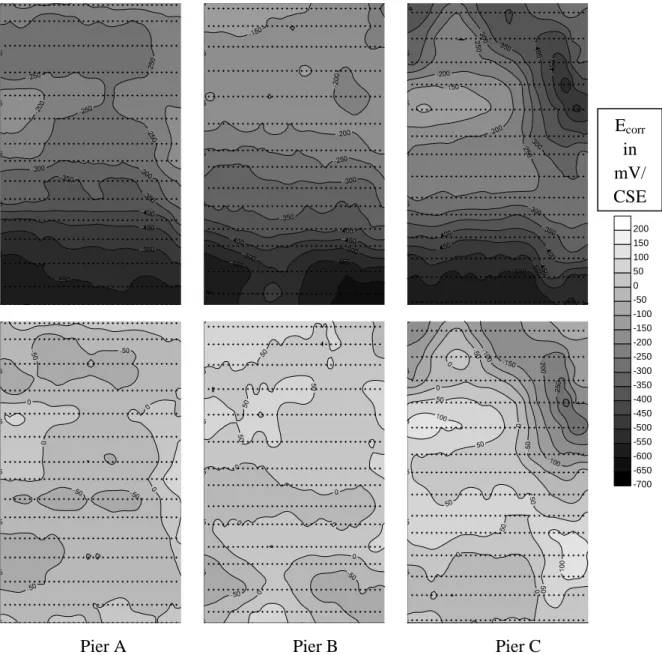
Figure 8: Half-cell equi-potential map for 3 piers before modelling (at the top) and after modelling (at the bottom).
In order to check the validity of the found mathematical law which supposed to represent the tide’s effect on the corrosion potential, three piers have been selected: 2 of them (Piers A et B) are supposed to be passive whereas the third one (Pier C) presents an important anodic area. These piers have been selected visually, using the equicontour potential line plot from the raw potential data, which are presented at the top of Fig. 8. The anodic area on the Pier C is easily recognizable, but no one of the standard or recommendations prove it. Reference corrosion potential, calculated from found mathematical law, are subtracted to every experimental potential values, 36 per rebar. At the bottom of the Fig. 8 the equicontour potential line plot after using the mathematical law are represented.
Based on the COST-509 [17] interpretation, conclusions from gradient potentials are different: from raw data, the three piers rather indicate a high risk of corrosion state with
-700 -650 -600 -550 -500 -450 -400 -350 -300 -250 -200 -150 -100 -50 0 50 100 150 200 Ecorr in mV/ CSE 0 0,5 1 1,5 3,95 4,45 4,95 5,45 5,95 6,45 6,95 0 0,5 1 1,5 3,95 4,45 4,95 5,45 5,95 6,45 6,95 0 0,5 1 1,5 3,95 4,45 4,95 5,45 5,95 6,45 6,95 0 0,5 1 1,5 3,95 4,45 4,95 5,45 5,95 6,45 6,95 0 0,5 1 1,5 3,95 4,45 4,95 5,45 5,95 6,45 6,95 0 0,5 1 1,5 3,95 4,45 4,95 5,45 5,95 6,45 6,95
potential gradients for Piers A, B and C respectively equal to 435, 515 and 505 mV. After correction, gradient potentials of Piers A and B are respectively 177 and 183 mV meaning no risk of corrosion while for Pier C, the 463mV gradient potential confirms an active corrosion state.
4. Conclusions and outlooks
This paper presents a modelling method used to take into account the tide’s effect on the corrosion potential. Half-cell potential’s measurements of horizontal reinforcement of 4 bridge’s piers without visual damage and without electrochemical anomalies (like anodic area) have been used as reference. From these results, the following conclusions can be drawn:
- 3 zones with a different corrosion potential behaviour have been identified, boundaries between these zones correspond to the values used to describe the different exposure zones (tidal, splash and atmospheric zones);
- The tide’s effect has been deleted from original data. Modified maps highlight anodic and cathodic areas and COST-509’s recommendation can be used to determine the corrosion’s risk of a pier, which was not possible before modelling of the tide effect. The outlooks of this work are:
- In order to study the tide effect on half-cell potential values, the measurements will be performed during the falling tide and compared to those obtained for rising tide; - The influence of exposure conditions (wind and sun) will be studied based on the
half-cell potential measurements performed on two opposite sides of the pier taking into account the impact of falling / rising tide;
- This modelling method will be applied to others NDT measurements (concrete electrical resistivity and corrosion rate);
- This modelling method would be useful to compare the corrosion state of different structures on the Atlantic coast.
Acknowledgments
The French project DéCoF-Ré (Decision Corrosion Fiabilité – Ré) is a cooperative study between several partners: IFSTTAR, Université de Nantes & Capacité SAS, Cerema (Dter Ouest and Dter IdF), CONCRETE and the Département de la Charente-Maritime.
The authors acknowledge the Département de la Charente-Maritime (A. Audouin-Dubreuil) and CONCRETE Sarl (M. Brouxel) for their financial supports.
The authors are very grateful to R. Queguiner, F. Landrin, J. Schneider from Cerema, W. Traverst from IFSTTAR and M. Roche from University of Nantes for performing the measurements and they also thank M. Barbier and the Atlantique Scaphandre team for their help with the vessel.
[1] Broomfield, J. P., Corrosion of steel in concrete – Understanding, investigations and repair, London: E&FN SPON, 1997
[2] Bentur, A. et al, Steel corrosion in concrete – Fundamentals and civil engineering practice, London: E&FN SPON, 1997
[3] Bhargava, K. et al, Modelling of time to corrosion-induced cover cracking in reinforced concrete structures, Cem Concr Res 35 (2005), 2203-2218
[4] CETMEF, Altération du béton en site maritime, (2012)
[5] Costa, A. and Appleton, J., Chloride penetration into concrete in marine environment – Part I: Main parameters affecting chloride penetration, Mater Struct 32 (1999), 252-259 [6] Costa, A. and Appleton, J., Chloride penetration into concrete in marine environment –
Part II: Prediction of long term chloride penetration, Mater Struct 32 (1999), 354-359 [7] Montemor, M. F., Chloride-induced corrosion on reinforcing steel: from the fundamentals
to the monitoring techniques, Cem Concr Compos 25 (2003), 491-502
[8] Boero, J., Fiabilité des infrastructures portuaires: Approche innovante d’analyse et de modélisation probabiliste des données d’inspection, PhD thesis, Université de Nantes (2010)
[9] Elsener, B., Half-cell potential mapping to assess repair work on RC structures, Cons and Build Mat 15 (2001), 133-139
[10] Bertolini, L. et al, Corrosion of steel in concrete: prevention, diagnosis, repair, Weinheim: Wiley Vch Verlagsgesellschaft Mbh, 2004
[11] Elsener, B., RILEM TC 154-EMC : Electrochemical techniques for measuring metallic corrosion – Recommendations – Half-cell potential measurements – Potential mapping on reinforced concrete structures, Mater Struct 36 (2003), 461-471
[12] ASTM C876-91, Standard test method for half-cell potentials of uncoated reinforcing steel in concrete, American Society for Testing and Materials, USA (1999)
[13] ASTM C876-09, Standard test method for half-cell potentials of uncoated reinforcing steel in concrete, American Society for Testing and Materials, USA (2009)
[14] Breysse, D. et al, Accounting for variability and uncertainties in NDT condition assessment of corroded RC-structures, Eur J Environ Civ Eng 13 (2009), 573-592
[15] Poupard, O. et al, Corrosion damage diagnosis of a reinforced concrete beam after 40 years natural exposure in marine environment, Cem Concr Res 36 (2006), 504-520
[16] Thomas, M.D.A. and Matthews, J.D., Performance of pfa concrete in a marine environment – 10-year results, Cem Concr Compos 26 (2004), 5-20
[17] Cox, R. N. et al, Corrosion and protection of metals in contact with concrete, COST-509 Final Report (1997), 168
[18] Benchmark des poutres de la Rance, Final Report (2005), 146
[19] Gonzalez, J. A. et al, Considerations on reproducibility of potential and corrosion rate measurements in reinforced concrete, Corr Sci 46 (2004), 2467-2485
[20] Hussain, R.R. and Ishida, T., Influence of connectivity of concrete pores and associated diffusion of oxygen on corrosion of steel under high humidity, Cons and Build Mat 24 (2010), 1014-1019
[21] Hussain, R.R., Underwater half-cell corrosion potential bench mark measurement of corroding steel in concrete influenced by a variety of material science and environmental engineering variables, Measurement 44 (2011), 274-280
[22] Schoefs, F. et al, Assessment of ROC curves for inspection of random fields, Struct Saf 31 (2009), 409-419