HAL Id: hal-02263631
https://hal-mines-albi.archives-ouvertes.fr/hal-02263631
Submitted on 5 Feb 2020
HAL is a multi-disciplinary open access
archive for the deposit and dissemination of
sci-entific research documents, whether they are
pub-lished or not. The documents may come from
teaching and research institutions in France or
abroad, or from public or private research centers.
L’archive ouverte pluridisciplinaire HAL, est
destinée au dépôt et à la diffusion de documents
scientifiques de niveau recherche, publiés ou non,
émanant des établissements d’enseignement et de
recherche français ou étrangers, des laboratoires
publics ou privés.
Supercritical water gasification of glycerol for Hydrogen
production using response surface methodology
Ibtissem Houcinat, Nawel Outili, Hassen Abdesslam Meniai, Elsa
Weiss-Hortala
To cite this version:
Ibtissem Houcinat, Nawel Outili, Hassen Abdesslam Meniai, Elsa Weiss-Hortala.
Supercriti-cal water gasification of glycerol for Hydrogen production using response surface methodology.
IREC 2019 - 10th International Renewable Energy Congress, Mar 2019, Sousse, Tunisia. pp.1-6,
�10.1109/IREC.2019.8754520�. �hal-02263631�
Supercritical water gasification of glycerol for
Hydrogen production using response surface
methodology
HOUCINAT Ibtissem, OUTILI Nawel
*
, MENIAI AbdesslamHassen
Chemical process faculty LIPE, Constantine3 University
Constantine, Algeria *[email protected]
WEISS-HORTALA Elsa RAPSODEE Center
CNRS-UMR 5302, IMT Mines Albi Albi, France
Abstract— Supercritical water gasification is a promising
technology for the treatment of wet biomass and hydrogen. In this work, supercritical water gasification of glycerol was carried out in mini autoclaves to conduct a hydrogen production optimization study, using the central composite design of experiments. The effect of five operating conditions on the production of syngas by supercritical gasification has been studied namely, temperature (400-600 ° C), residence time (5min30s-124min30s), initial concentration of glycerol (3,79-25,21% weight), pressure (20.21 MPa-29.76 MPa) and KOH catalyst quantity (0-2% weight). The results revealed that a high temperature and a long residence time are desirable for hydrogen production and gasification efficiency, the temperature is the most positive effect on both responses, and the presence of potassium hydroxide as a catalyst has a considerable effect on hydrogen production. However, a long residence time is not necessary when handling at high temperature. Also, the increase in the initial glycerol concentration has a negative effect, while the pressure change has no significant effect. According to the models, a maximum of hydrogen produced and gasification efficiency are obtained when the operating conditions are temperature = 599.89 ° C, residence time of 60.7957 min, a pressure of 21.3 MPa for an initial glycerol concentration of 3.79 wt% and in the presence of 0.102 wt% KOH.
Keywords— supercritical water gasification; glycerol; H2 production; gasification efficiency
I. INTRODUCTION
Hydrogen is a clean and renewable energy vector [1], it is the cleanest fuel with zero carbon emission [2], its combustion
leads only to the production of water H2O [3]. Hydrogen is
often used for the treatment of heavy crude oil, the production of hydrocarbons from the hydrogenation process, the valorization of bio-oils, the manufacture of ammonia and methanol by chemical synthesis [4].
Due to the depletion of fossil energy, biomass as a source of renewable and environmentally friendly energy is a feedstock of hydrogen production [5], by biochemical or thermo chemical conversion [6], the production of hydrogen biochemically is sufficient for practical application, while thermo chemical conversion allows high hydrogen production with better energy efficiency [7]. Thermo chemical methods of hydrogen production are: pyrolysis, conventional gasification, and supercritical water gasification. Pyrolysis is a process of decomposition of carbonaceous materials, by the action of heat (up to 1000 °C) in the absence of oxygen producing a solid (charcoal), condensable vapors (organic oils and water) and
combustible permanent gases (CO, H2, CH4 and other light
hydrocarbons C2-C3) and incombustible (CO2) [8].
Conventional gasification aims at the conversion of an organic charge into combustible gas, the reaction product is therefore a combustible gas (CO, H2, CH4, H2O, N2) generated at high
temperature (800 to 900 °C), under pressure or not, and an inert residue [9]. In the case of wet biomass, these processes are difficult to handle and have low energy efficiency [10]. To solve this problem, a process using the properties of water has been started, this process is supercritical water gasification, which consists of carrying a wet biomass under conditions above the critical temperature and pressure of water (Tc ≥374_°C, Pc≥22.1MPa), thus producing a mixture of recoverable gases composed mainly of (H2, CH4, CO2, CO and
some light hydrocarbons) [11]. This process doesn’t require a drying step which makes it less expensive compared to conventional gasification and pyrolysis [12]. In addition, supercritical water gasification of biomass has a high hydrogen yield with sufficient pressure for storage and transport [13]. Therefore, gasification in supercritical water treated different real biomasses such as fruit pulp [14], wheat straw [15], sawdust [7], sugar cane bagasse [16] and olive oil waste [17]. Also, it was applied for model biomass such as cellulose [7],
glucose [18], lignin [19], and glycerol [20], in tubular reactors [15, 21], or batch reactors [16, 22].
The literature on experimental studies shows a variety of operating parameters whose effect has been tested on the rate of hydrogen production such as temperature [20], initial concentration [22, 23], residence time [24] and pressure[22], as well as the presence of catalyst [25].
In order to control the selectivity of hydrogen production, an assembly of operating conditions and the presence of alkaline catalyst is essential. For this fact, an optimization study is required and many researchers have used the surface response methodology as an optimization tool.
The response surface methodology (RSM) using central composite design (CCD) was investigated on the hydrothermal gasification of lignin for the first time by K. Kang et al. [26], in a batch reactor, whose main objective was the optimization of the hydrogen yield by the effect of three parameters, the temperature, the pressure and the water / biomass ratio. A.Raheem et al. [27] have studied the influence of temperature, ZnO-Ni-CaO catalyst load and residence time for the hydrothermal gasification of algae studying several design responses (fractions of H2, CO, CO2 and CH4).
However, in the last few years there has been a growing interest in glycerol as a biomass source of renewable energy, because of its growing generation, and availability at low cost, as a byproduct of biodiesel production by transesterification of vegetable oils[28, 29]. For these reasons, and in order to produce hydrogen, several researchers have studied gasification in supercritical water glycerol experimentally [20-24], but very few researchers have carried out optimization studies on this biomass. From our bibliographic research only F.Yan et al. [30] studied the supercritical water gasification of crude glycerol, using the central composite experimental design to optimize hydrogen production from crude glycerol, and to study the effect of glycerol concentration, temperature and KOH concentration.
So, usually, optimization studies of supercritical gasification considered three parameters in their used experimental design. The present work focuses on a modeling study of the glycerol supercritical water gasification process, and the influence of five operating parameters, temperature, residence time, pressure, initial concentration and presence of potassium hydroxide as catalyst, on hydrogen production, using a central composite design, leading to quadratic correlations between the response and the studied factors.
II. MATERIALSANDMETHODS
A. Reagents
The glycerol (C3H8O3) used in this study was purchased
from SIGMA ALDRICH, with a purity of 99.9% and glycerol solutions were prepared with ultrapure water. The experiments were conducted with solutions containing pure glycerol of concentrations in the range [3,8-25,21% weight], in the
presence of an alkaline catalyst, potassium hydroxide KOH with concentrations in the range [ 0-2%weight].
B. Experimental protocol
The experiments were carried out in the RAPSODEE laboratory of IMT- Mines of Albi in France, in mini autoclaves of internal volume of 5 ml. The volume of glycerol solutions were calculated using the density (ρ) depending on the desired temperature and pressure conditions. This solution was introduced to the reactors with the appropriate quantity of potassium hydroxide as catalyst.
The reactor was in stainless steel 316, with inner and outer diameters of 8.5 and 31.4 mm, respectively. The copper seal ensured tightness between the two parts of the autoclave [31]. When the solution was introduced into the reactor, and after closure, the reactor was installed in the oven (Nabertherm L5 / 11 / P320) previously heated to the desired temperature. A time of 9 minutes was necessary to the oven to achieve the desired temperature. Once the residence time of the reaction was reached, the reactor was installed under a hood for 20 minutes to be cooled to ambient temperature. Once the reactor was open, the manometer measured the overpressure (used to calculate the volume of total gas produced). Then, the gaseous and liquid phases were recovered and analyzed.
The recovered gases were analyzed by gaseous micro chromatography (Agilent PGC-3000), identifying and quantifying in few seconds the produced gases: H2, CO, CO2,
CH4, C2H4, C2H6, C3H8 and C4H10. Gas yield was defined as
concentration of gas divided by initial concentration of glycerol.
C. Design of experiments
The central composite design was chosen because of its efficient estimation of the quadratic terms in the second degree model, by studying the effect of 5 operating parameters Temperature (T), residence time (ts), initial glycerol concentration (Ci), pressure (P), and potassium hydroxide as catalyst (Cat), with five levels for each factor as presented in table1. The studied responses of the design were: hydrogen production, gasification efficiency and gas yield. 52 experiments were carried out as suggested by the used CCD. The real factors variation according to the experiments as well as the experimental responses measurements are shown in tables I and II.
The H2 yield is calculated as follows:
TABLEI. INTERVALS OF VARIATION OF THE STUDIED REAL-CODED FACTORS.
Variable Units Symbols
Ranges and Levels
-2,38 -1 0 +1 +2,38 Temperature °C T 400 458 500 542 600 Residence time min ts 5.5 40 65 90 124.5 Glycerol concentration Wt % Ci 3.8 10 14.5 19 25.21 Pressure MPa P 20.2 23 25 27 29,76 Potassium hydroxide catalyst (KOH) Wt% Cat 0 0.6 1.0375 1.475 2.078
In order to determine the optimal condition for a target objective, the H2 yield is related to the responses using a
second order models expressed as follows:
(2)
Where Y is the studied response, ai are the model
coefficients and xi the i factor
III. RESULTS AND DISCUSSIONS
First we carried out the 52 experiments as presented in table2 and the ai models coefficients are estimated for each studied response, using Minitab16 for data treatment of CDD experimental design.
The experimental results of the H2 yield are shown in
Table II:
TABLEII. CENTRAL COMPOSITE MATRIX DESIGN WITH REAL VALUES OF
FACTORS AND EXPERIMENTAL H2 YIELD.
Run T ts Ci P Cat YH2 (experimental) 1 458 40 10 23 0,6 0,40060 2 542 40 10 23 0,6 0,65959 3 458 90 10 23 0,6 0,57200 4 542 90 10 23 0,6 0,67492 5 458 40 19 23 0,6 0,29346 6 542 40 19 23 0,6 0,47693 7 458 90 19 23 0,6 0,25373 8 542 90 19 23 0,6 0,45387 9 458 40 10 27 0,6 0,22064 10 542 40 10 27 0,6 0,66533 11 458 90 10 27 0,6 0,53968 12 542 90 10 27 0,6 0,53005 13 458 40 19 27 0,6 0,14161 14 542 40 19 27 0,6 0,42988 15 458 90 19 27 0,6 0,31280 16 542 90 19 27 0,6 0,45814 17 458 40 10 23 1,475 0,52780 18 542 40 10 23 1,475 0,71939 19 458 90 10 23 1,475 0,50800 20 542 90 10 23 1,475 0,60490 21 458 40 19 23 1,475 0,30548 22 542 40 19 23 1,475 0,52000 23 458 90 19 23 1,475 0,36633 24 542 90 19 23 1,475 0,49413 25 458 40 10 27 1,475 0,48838 26 542 40 10 27 1,475 0,82298 27 458 90 10 27 1,475 0,68719 28 542 90 10 27 1,475 0,64337 29 458 40 19 27 1,475 0,24939 30 542 40 19 27 1,475 0,53612 31 458 90 19 27 1,475 0,48735 32 542 90 19 27 1,475 0,46723 33 400,107 65 14,5 25 1,0375 0,29718 34 599,893 65 14,5 25 1,0375 0,58585 35 500 5,54 14,5 25 1,0375 0,12527 36 500 124,46 14,5 25 1,0375 0,51314 37 500 65 3,7971 25 1,0375 1,29991 38 500 65 25,2029 25 1,0375 0,41237 39 500 65 14,5 20,2432 1,0375 0,16676 40 500 65 14,5 29,7568 1,0375 0,32425 41 500 65 14,5 25 0 0,42929 42 500 65 14,5 25 2,07806 0,70090 43 500 65 14,5 25 1,0375 0,34295 44 500 65 14,5 25 1,0375 0,38951 45 500 65 14,5 25 1,0375 0,31733 46 500 65 14,5 25 1,0375 0,36428 47 500 65 14,5 25 1,0375 0,37327 48 500 65 14,5 25 1,0375 0,38562 49 500 65 14,5 25 1,0375 0,39709 50 500 65 14,5 25 1,0375 0,36428 51 500 65 14,5 25 1,0375 0,31733 52 500 65 14,5 25 1,0375 0,37327 A. Models
The complete quadratic model of the second degree describing the hydrogen production according to the operating parameters (in real value) is as follows:
(3) The coefficients of determination (R2) of the mathematical
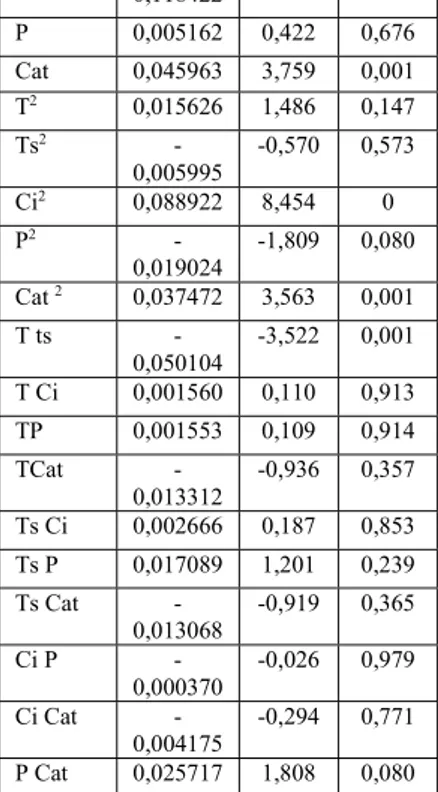
models describing hydrogen production is 0.896. Table III presents the regression coefficients and the significance tests for all the parameters studied and their interactions with a statistical risk of 5%.
TABLEIII. REGRESSION COEFFICIENTS AND SIGNIFICATION TESTS FOR
HYDROGEN PRODUCTION AND GASIFICATION EFFICIENCY.
Source H2 Coef t P Constant 0,363912 14,390 0 T 0,080551 6,588 0 Ts 0,035061 2,868 0,007 Ci - -9,686 0
0,118422 P 0,005162 0,422 0,676 Cat 0,045963 3,759 0,001 T2 0,015626 1,486 0,147 Ts2 -0,005995 -0,570 0,573 Ci2 0,088922 8,454 0 P2 -0,019024 -1,809 0,080 Cat 2 0,037472 3,563 0,001 T ts -0,050104 -3,522 0,001 T Ci 0,001560 0,110 0,913 TP 0,001553 0,109 0,914 TCat -0,013312 -0,936 0,357 Ts Ci 0,002666 0,187 0,853 Ts P 0,017089 1,201 0,239 Ts Cat -0,013068 -0,919 0,365 Ci P -0,000370 -0,026 0,979 Ci Cat -0,004175 -0,294 0,771 P Cat 0,025717 1,808 0,080
Coef=regression coefficients of the model, t-value=Student test value, P-value= probability value
According to Table III, all the main factors have a significant effect on the production of hydrogen except the pressure (p-value >0.050). As reported in [32, 33], a strong pressure is in favor of the water gas-shift reaction,
methanation of the CO and CO2, but reduces the rate of
decomposition reaction of the biomass by radical reaction. This explains why the pressure has no significant effect on hydrogen production and gasification efficiency.
The initial concentration of glycerol has the most significant but negative effect t = 9.686, pvalue = 0 and t = -3.451, p-value = 0.002, respectively, an increase in the initial concentration causes a decrease in the hydrogen produced. If we compare experiments 37 and 38, when initial concentration of glycerol rises from 3.79wt% to 25.21wt% the hydrogen
production decreases from 1.29 to 0.41 mol of H2 / mol of
glycerol and gasification efficiency decreases from 52. 4658 to 26. 7958%.
For hydrogen production, the remaining significant parameters having a positive effect on hydrogen production can be classified as follows: Temperature> presence of catalyst (KOH)> residence time.
The residence time has a positive effect on H2 production,
with a PH2-value = 0.007 and the interaction between
temperature and residence time is the only interaction which has an effect on the production of hydrogen, an increase in temperature and residence time together affects negatively the production of hydrogen. So, in the case of high temperatures, it is not necessary to take a long residence time [34].
B. Optimisation
First, we illustrate the surface plots and contours for the H2
production in terms of the most important factors affecting them as presented in fig. 1 to 4.
Fig.1 is the three-dimensional graphical representation of the surface area of the hydrogen produced which shows the effect of the temperature and the initial concentration of glycerol, when the residence time is at 65 minutes, the pressure is held at 25 MPa, the catalyst at 1.038 wt%. The graph indicates that the decomposition of glycerol into supercritical water is an overall endothermic process as there is a general trend that as the temperature increases, hydrogen production and gasification efficiency has increased.
24 18 0,5 12 1,0 400 1,5 6 500 600 H2 Ci T ts 65 P 25 Cat 1,038 Hold Values Surface Plot of H2 vs Ci; T
Fig. 1. Surface plot of H2 yield
More detailed information about the effect of glycerol initial concentration and temperature on the hydrogen production, are in the contour plot. Fig. 2 allows to determine approximately the best combination of operating parameters allowing a maximum of hydrogen produced. The graph shows when a residence time is equal to 40 minutes, a pressure of 23 MPa and 0.6 wt% of KOH, the temperature is greater than 570 ° C, allow a maximum hydrogen production higher than 1.4 mol of H2 / mol of glycerol, using an initial concentration of
less than 5wt%. T Ci 595 570 545 520 495 470 445 420 25 20 15 10 5 ts 40 P 23 C at 0,6 Hold Values > – – – – – – < 0,2 0,2 0,4 0,4 0,6 0,6 0,8 0,8 1,0 1,0 1,2 1,2 1,4 1,4 H2/C 3H8O3i
Contour Plot of H2 vs Ci; T
Fig. 2. Contour plot for H2 production (residence time= 40 min, Pressure=
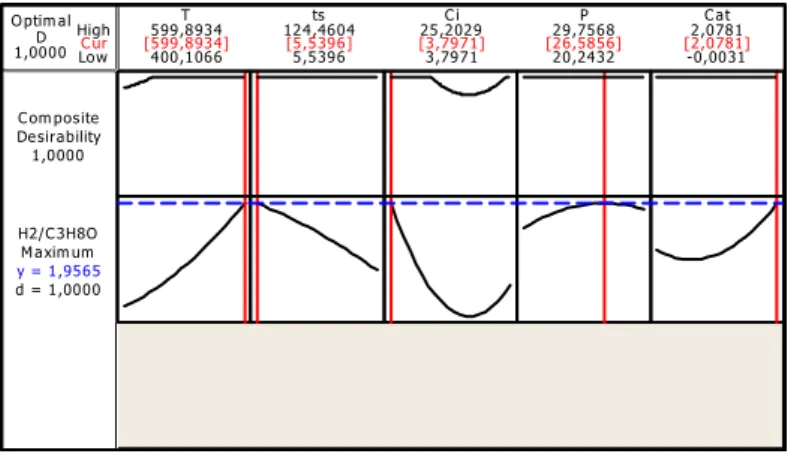
Then, the optimizer of Minitab was used to obtain the exact optimal operating conditions for a maximum desired response. Figure 5 enables a comparison of the two cases: operating conditions obtained from the optimization of the hydrogen yield. C ur High Low 1,0000D O ptim al d = 1,0000 M axim um H2/C 3H8O y = 1,9565 1,0000 Desirability C om posite -0,0031 2,0781 20,2432 29,7568 3,7971 25,2029 5,5396 124,4604 400,1066 599,8934T ts C i P C at [599,8934] [5,5396] [3,7971] [26,5856] [2,0781]
Fig. 3. Minitab results from the optimizer for the hydrogen production. The optimum factors for the maximum hydrogen yield are presented in Table III, 3.7971 wt% of glycerol concentration and 2.0781 wt% of KOH catalyst, make it possible to obtain 1.9565 mol of hydrogen / mol of glycerol, at optimal conditions of a temperature of 599.8934 ° C, a residence time of 5.5396 minutes and a pressure of 26.5856 MPa.
TABLEIV. OPTIMAL CONDITIONS AND CORRESPONDING OPTIMAL RESPONSES
FOR A MAXIMUM OF HYDROGEN PRODUCTION.
Optimal conditions Valu es Temperatur e Residenc e time Initial concentratio n of glycerol Pressur e Presence of catalyst(KO H) Real 599.8934 ° C 5.5396 minutes 3.79 wt% 26.585 6 MPa 2.0781 wt%
H2 (mol of hydrogen / mol of glycerol)
1.9565
TABLEV. OPTIMAL CONDITIONS AND CORRESPONDING OPTIMAL RESPONSES
FOR A MAXIMUM OF GASIFICATION EFFICIENCY AND HYDROGEN PRODUCTION.
Optimal conditions Values Temperature Residence
time concentration Initial of glycerol Pressure Presence of catalyst(KOH) Real 599.8934 ° C 60.7957 minutes 3.79 wt% 21.3MPa 0.102 wt% Optimal responses
The composition of the produced syngas changes according to the operating conditions of the reaction. For the optimized conditions, fig. 7 presents the detailed composition of the synthesis gas obtained with the optimal conditions allowing a maximum production of hydrogen only, and a maximum of hydrogen yield and gasification efficiency, respectively.
Fig. 4. Composition of the synthesis gas mixture product obtained according
to the objective of optimization.
IV. CONCLUSION
In this research, the supercritical water gasification of pure glycerol was studied in the presence of alkaline catalyst (KOH) in mini autoclaves, using the surface response methodology (RSM) and the central composite design (CCD), this allowed to obtain a mathematical model of the second degree describing the production of hydrogen and gasification efficiency according to five operating parameters: temperature, residence time, initial glycerol concentration, pressure and presence of catalyst (KOH), and to study the effect of these parameters on the response studied. The significance tests showed that the initial concentration of glycerol had the most significant negative effect, while the pressure had no significant effect. However, temperature and residence time have a positive effect, and the presence of catalyst has a positive effect on hydrogen production. The interaction between temperature and residence time has a negative effect on the production of hydrogen, this is explained by the fact that a long residence time is not necessary when handling at high temperatures.
The operating conditions obtained for an optimization
aimed at a maximum of hydrogen produced of 1.95 mol of H2
/ mol of glycerol, are of temperature = 599.8934 ° C, residence time = 5.5396 min, a pressure of 26.5856 MPa for an initial glycerol concentration of 3.7971 wt% and in the presence of 2 wt% of KOH.
REFERENCES
[1] Douette AMD, Turn SQ, Wang W, Keffer VI. “Experimental investigation of hydrogen production from glycerin reforming”. Energy & Fuels, Vol. 21(6), pp.3499–3504, 2007.
[2] A. Bahadar, M. Bilal Khan. “Progress in energy from microalgae: A review. Renewable and Sustainable Energy Reviews”.Vol. 27, pp.128-148, 2013.
[3] Levin, D. B.; Pitt, L.; Love, M. “Biohydrogen production: Prospects and limitations to practical application.” International Journal of Hydrogen Energy. Vol. 29 (2),pp.173−185, 2004.
[4] K. Nath, D. Das.” Hydrogen from biomass. Current Science”.vol. 85 (3), pp. 265-271, 2003.
[5] Turner J, Sverdrup G,Mann MK, Maness PC, Kroposki B, Ghirardi M, Evans RJ, Blake D. “Renewable hydrogen production”. International Journal of Energy Research. Vol. 32, pp. 379–407, 2008.
[6] B. Yan, J. Wu, C. Xie, F. He, C. Wei. “Supercritical water gasification with Ni/ZrO2 catalyst for hydrogen production from model wastewater of polyethylene glycol”. Journal of Supercritical Fluids. Vol. 50, pp.155-161, 2009.
[7] L.J. Guo, Y.J. Lu, X.M. Zhang, C.M. Ji, Y. Guan, A.X. Pei. “Hydrogen production by biomass gasification in supercritical water: A systematic experimental and analytical study.” Catalysis today. vol129 , pp.275-286, 2007.
[8] D. Ballerini. « Les biocarburants: répondre aux défis énergétiques et environnementaux des transports ». Editions Technip. 2011.
[9] MOLETTA René. » Le traitement des déchets ». Editions Tec&Doc Lavoisier. 2009.
[10] A.Kumar, D. Jones, M. Hanna. “Thermochemical biomass gasification: A review of the current status of the technology”. Energies. vol . 2 (3), pp.556−581, 2009.
[11] Ruiz JC, Boutin O. « Gazeification de biomasse en eau supercritique ». Edition Technique de l’ingenieur.. Saint Denis. France. 2013.
[12]M. Ni, D.Y.C. Leung, M.K.H. Leung, K.Sumathy, “An overview of hydrogen production from biomass”, Fuel Process Technol. Vol. 87 , pp.461-472, 2006.
[13] L. Zhang, C.C. Xu, P. Champagne. “Overview of recent advances in thermo-chemical conversion of biomass”. Energy Conversion Management. Vol. 51, pp.969-982, 2010.
[14] D.Elif, A. Nezihe. “ Hydrogen production by supercritical water gasification of fruit pulp in the presence of Ru/C”, International Journal of Hydrogen Energy. Vol. 41 (19), pp.8073−8083, 2016.
[15] S.Nanda, S.N. Reddy, Dai-Viet N. Vo, Bichitra N. Sahoo, J.A. Kozinski. “Catalytic gasification of wheat straw in hot compressed (subcritical and supercritical) water for hydrogen production”. Energy Science &Engineering. Vol. 6(5): 448- 459, 2018.
[16] Ebrahimi-Nik, Mohammadali, M. Almassi, M. Javad Sheikhdavoodi, A.Kruse, H.Bahrami. “Gasification of sugarcane bagasse in supercritical water: effect of pressure and reaction time”. The 9 th International Energy conference.
[17] E.Kıpçak, Onur O. Sogut, M.Akgun. “Hydrothermal gasification of olive mill wastewater as a biomass source in supercritical water”. The Journal of supercritical fluids. Vol. 57 (1), pp.50-57, 2011.
[18]: X.H. Hao, L.J. Guo, X. Mao, X.M. Zhang, X.J. Chen. “Hydrogen production from glucose used as a model compound of biomass gasified in supercritical water”. International Journal of Hydrogen Energy. Vol 28(1), pp.55-64. 2003.
[19]: F.L. P. Resende, S. A. Fraley, M. J. Berger and P.E. Savage. “Noncatalytic gasification of lignin in Supercritical Water”. Energy Fuels, vol. 29 (3), 1776–1784, 2015.
[20]: B.F. Tapah, R.C.D. Santos, G.A. Leeke. “Processing of glycerol under sub and supercritical water conditions”. Renewable Energy. Vol. 62: 353-361, 2014.
[21]: Y. J. Lu, H. Jin, L. J. Guo, X. M. Zhang, C. Q. Cao, and X. Guo. “Hydrogen production by biomass gasification in supercritical water with a fluidized bed reactor”. International Journal of Hydrogen Energy. Vol. 33( 21), pp. 6066–6075, 2008.
[22] Wu M. Study of process of conversion of biomass to supercritical water to obtain hydrogen. Application to glucose, glycerol and bio-glycerol. Etude de procedes de conversion de biomasse en eau supercritique pour l’obtention d’hydrogène. Application au glucose, glycerol et bio-glycerol.. French: Universite de Toulouse. Unite de recherche RAPSODEE; Toulouse France, 2012.
[23] A.J. Byrd, K.K. Pant , Ram B. Gupt. “Hydrogen production from
glycerol by reforming in supercritical water over Ru/Al2O3 catalyst”.
Fuel. Vol. 87 (13-14), pp. 2956-2960, 2008.
[24] S. Guo, L. Guo, C. Cao, J. Yin, Y. Lu, X.Zhang. “Hydrogen production from glycerol by supercritical water gasification in a continuous flow tubular reactor”. International Journal of Hydrogen Energy. Vol. 37(7), pp.5559-5568, 2012.
[25]: Z.Ge, H. Jin. L. Guo. “Hydrogen production by catalytic gasification of coal in supercritical water with alkaline catalysts: Explore the way to complete gasification of coal”. International Journal of Hydrogen Energy. Vol. 39(34), pp. 19583-19592, 2014.
[26] K.Kang, R. Azargohar, Ajay K. Dalai and H. Wang. “Noncatalytic Gasification of Lignin in Supercritical Water Using a Batch Reactor for Hydrogen Production: An Experimental and Modeling Study”. Energy & Fuels. Vol. 29(3), pp.1776-1784, 2015.
[27] Abdul Raheem, Guozhao Ji, Asif Memon, Siva Sivasangar, Wei Wang, Ming Zhao,Yun Hin, Taufiq-Yap. “Catalytic gasification of algal biomass for hydrogen-rich gas production: Parametric optimization via central composite design”. Energy Conversion and Management. vol 158, 2017.
[28] R. N. Reddy, S. S. Patel, Sai Kumar Nair and Y.V.N.S. Suvikram, “Preparation of Hydrogen from Glycerol via Steam Reforming Process”, INSTITUTE OF TECHNOLOGY, NIRMA UNIVERSITY, AHMEDABAD – 382 481, 08-10 DECEMBER, 2011.
[29] Pagliaro M, Ciriminna R, Kimura H, Rossi M, Della Pina C. “From Glycerol to Value-Added Products. Angew ». Chemical International Edition. Vol.46, pp.4434-4440, 2007.
[30] F.Yang, M.A. Hanna, David B. Marx and Runcang Sun. “Optimization of hydrogen production from supercritical water gasification of crude glycerol—byproduct of biodiesel production”. International Journal of Energy Research. Vol.37(13), 2013.
[31] Q. M. Yu-Wu , E. Weiss-Hortala , R. Barna , H. Boucard & S. Bulza. “Glycerol and bioglycerol conversion in supercritical water for hydrogen production”. Environmental Technology. Vol. 33(19), pp. 2245-2255, 2012.
[32] G. W. Huber, J. W. Shabaker and J. A. Dumesic. “Raney Ni-Sn Catalyst for H2 Production from Biomass-Derived Hydrocarbons”. Science. Vol. 300, pp. 2075-2078, 2003.
[33] M. Watanabe, H. Inomata, M.Osada, T.Sato, T. Adschiri, K. Arai. “Catalytic effects of NaOH and ZrO2 for partial oxidative gasification of n-hexadecane and lignin in supercritical water”. Fuel. Vol. 82(5), pp. 545-552, 2003.
[34] Y. J. Lu, L. J. Guo, C. M. Ji, X. M. Zhang, X. H. Hao and Q. H. Yan, "Hydrogen production by biomass gasification in supercritical water: A parametric study." Int J Hydrogen Energy, vol. 31, pp. 822-831, 2006.