HAL Id: hal-03084744
https://hal.archives-ouvertes.fr/hal-03084744
Submitted on 29 Dec 2020
HAL is a multi-disciplinary open access
archive for the deposit and dissemination of
sci-entific research documents, whether they are
pub-lished or not. The documents may come from
teaching and research institutions in France or
abroad, or from public or private research centers.
L’archive ouverte pluridisciplinaire HAL, est
destinée au dépôt et à la diffusion de documents
scientifiques de niveau recherche, publiés ou non,
émanant des établissements d’enseignement et de
recherche français ou étrangers, des laboratoires
publics ou privés.
1.73 eV AlGaAs/InGaP heterojunction solar cell grown
by MBE with 18.7% efficiency
Ahmed Ben Slimane, Amadeo Michaud, Olivia Mauguin, Xavier Lafosse,
Adrien Bercegol, Laurent Lombez, Jean-Christophe Harmand, Stéphane Collin
To cite this version:
Ahmed Ben Slimane, Amadeo Michaud, Olivia Mauguin, Xavier Lafosse, Adrien Bercegol, et al..
1.73 eV AlGaAs/InGaP heterojunction solar cell grown by MBE with 18.7% efficiency. Progress in
Photovoltaics, Wiley, 2020, 28 (5), pp.393-402. �10.1002/pip.3249�. �hal-03084744�
1.73 eV AlGaAs/InGaP heterojunction solar cell grown by MBE
with 18.7% efficiency
Ahmed Ben Slimane
1,2, Amadeo Michaud
3, Olivia Mauguin
4, Xavier Lafosse
4, Adrien
Bercegol
1,5, Laurent Lombez
1,2, Jean-Christophe Harmand
4, Stéphane Collin
1,4*1
Institut Photovoltaïque d'Ile-de-France (IPVF), Palaiseau, 91120, France
2
CNRS, Institut Photovoltaïque d’Ile de France (IPVF), UMR 9006, 91120 Palaiseau, France
3
Total New Energies, 91120 Palaiseau, France
4
Centre de Nanosciences et de Nanotechnologies (C2N), CNRS, Université
Paris-Sud/Paris-Saclay, 91120, France
5
EDF R&D, 91120 Palaiseau, France
*[email protected]
Abstract:
We report on AlGaAs-based heterojunction solar cells grown by solid source molecular beam epitaxy (MBE). We investigate InGaP and AlGaAs material quality and we demonstrate significant efficiency improvements by combining the best of each alloy: a thick p-AlGaAs base with tunable bandgap, and a thin 50 nm n-InGaP emitter separated by a thin intrinsic AlGaAs layer. We report a certified solar cell conversion efficiency of 18.7 % with a 2-µm-thick AlGaAs layer and a bandgap of 1.73 eV, suitable for high efficiency Si-based tandem devices.
Keywords:
MBE, III-V solar cells, 1.7eV, heterostructure, AlGaAs, InGaP
Introduction:
Recently, two-terminal and four-terminal III-V/Si tandem solar cells have reached efficiencies above 33% under one-sun illumination, through careful bandgap engineering and incremental material choice improvement [1], [2]. Particularly, AlGaAs and InGaP alloys have received much attention, as they show great promises for the realization of single junction solar cells with direct bandgaps near 1.73 eV, suitable for high efficiency Si-based tandem dual junction devices, according to detailed balance modeling [3]–[6].
There are two main approaches for multi-junction III-V on Si solar cells. In a two-terminal approach, III-V cells can be directly grown on Si cells. However, large lattice mismatch and thermal expansion coefficient between III-V and Si still limit their efficiencies [7]. Alternatively, III-V cells can be bonded on Si [1], [8]. This two-terminal approach requires current matching and a bandgap near 1.73eV for maximum efficiency in dual junction devices [9]. In a four-terminal approach, III-V cells can be mechanically stacked on Si bottom cells. This method does not require current matching and the maximum efficiency is less sensitive to the top cell bandgap [2], [10], [11]. Both methods are viable for optimal III-V on Si solar cells, yet they require high efficiency III-V cells to reach tandem efficiencies above 33%. It is worth mentioning that dual junction III-V/Si record devices are based on InGaP top cells [1], [2], with a bandgap near 1.9 eV higher than the optimal value for two-terminals.
The key challenge in improving the III-V top cell is to optimize material properties and the bandgap. Early researches focused on AlGa As based alloys for the III-V top cell, since this material offers an attractive
flexibility allows the bandgap engineering of a fully AlxGa1-xAs photovoltaic homo-structure simply by varying
the aluminum (Al) composition. However, AlGaAs solar cell efficiencies were limited, mainly due to aluminum-oxygen (Al-O) deep level contaminations during growth [13], [14]. Thus, in the past years, most efforts have shifted towards InGaP-based homojunction solar cells. Lattice-matched In0.49Ga0.51P grown on GaAs has a
bandgap around 1.9 eV, a relatively good radiation hardness, low process sensitivity, and low interface recombination rate [12], [15], [16]. Despite the good material properties of InGaP, its widespread development may be limited by the scarcity of indium [17]–[20]. In addition, the bandgap of InGaP grown on GaAs is constrained to 1.8-1.9 eV with less flexibility as compared to AlGaAs.
To grow AlGaAs and InGaP alloys, two techniques are mainly used: molecular beam epitaxy (MBE) and metal organic vapor phase epitaxy (MOVPE). Both face the same challenge of improving material properties to raise efficiencies. For AlGaAs cells, incremental growth optimization of the alloy led to short circuit current (Jsc)
improvements [21]. The reduction of defect concentrations related to the formation of DX-centers resulted in state of the art AlGaAs solar cells with a bandgap around 1.7 eV and efficiencies up to 16.9 % [22], with best results achieved by MOVPE. For InGaP cells, growth temperature tuning led to efficiencies up to 16.6 % for MBE grown single junction solar cell [23]. Also, an enhancement of the open-circuit voltage (Voc) was observed
by optimizing the atomic ordering of InGaP on miscut substrates [24]. A deep junction design with a back mirror for photon recycling led to a record high efficiency of 20.8 % for MOVPE grown InGaP solar cells [25]. Finally, a graded bandgap structure with a 21.4 % efficiency was announced recently [26], [27]. It should be mentioned that record efficiencies of solar cells grown by MBE are generally lower than those grown by MOVPE. It is attributed to the lower growth temperature in MBE, resulting in more defect states and deep centers. Nevertheless, MBE proved to be an effective tool for basic research, with reduced residual contaminants such as oxygen and carbon, and an accurate control of fluxes that enable abrupt doping profiles and heterostructures. In this work we aim at bridging the gap between AlGaAs and InGaP solar cell efficiencies and between MBE and MOVPE growth methods by improving the quality of MBE-grown materials and by designing AlGaAs/InGaP heterostructure solar cells.
In this letter, we first investigate single-junction solar cells made of AlGaAs and InGaP homojunctions grown by MBE. We show that their performances are limited by the material quality of n-AlGaAs and p-InGaP, respectively. We overcome these limitations by combining a very thin n-In0.49Ga0.51P emitter with a thick
p-Al0.25Ga0.75As base. The reported heterostructure exhibits a certified efficiency of 18.7 % with a bandgap of 1.73
eV perfectly suited for III-V/Si tandem dual junction solar cells. Thanks to the flexibility of the AlGaAs alloy, similar heterostructures can be adapted to multi-junction solar cells.
Experimental procedure
The epitaxial growth of the solar cell structures was performed with a RIBER compact 21 solid-source MBE machine equipped with both arsenic and phosphorous-valved cracker cells. Standard p-type GaAs (100) substrates are used. The growth rates are approximately 1 µm/h for GaAs and Al0.51GaAs, and 0.5 µm/h for the
other layers. The typical growth conditions are a beam-equivalent pressure (BEP) of 1x10⁻⁵ Torr with a V/III
ratio of 20 at 550°C for arsenic-based layers, and a V/III ratio of 8 at 500°C for phosphorus-based layers. Beryllium and Silicon were used as p-type and n-type dopants, respectively. Standard photolithography, wet chemical etching, and metal evaporation steps were performed to separate the mesa structures. The cell size is 0.3×0.3 cm2. The front metal grid made of Ni/Ge/Au is not annealed [28] and the full-area back contact on the
rear of the substrate is made of Ti/Au. The front n-GaAs contact layer is removed by chemical etching using the front electrodes as a mask. For each structure, the results presented in the following (except in Fig. 6) are representative of the average performances of 5-10 devices. The best cells presented in Fig. 6 have an additional anti-reflective coating (ARC) layer made of 65 nm thick SiNx, and larger surface areas of 0.5×0.5 cm2 with
smaller metal grid spacing (shading of 5-6%).
I-V characteristics of the solar cells were measured using a solar simulator providing one-sun AM1.5G irradiance. External quantum efficiency (EQE) measurements were carried out with a Xenon light source, a monochromator, a microscope objective, and contact needles in a four-point contact configuration. Si calibrated diodes were used for reference. The Jsc is determined from the EQE measurements. RHEED measurements were performed during the growth, the beam equivalent fluxes were determined, and the compositions were confirmed using X-Ray Diffraction measurements on test samples. Diffractograms were performed to determine the lattice mismatch and crystalline properties in InGaP and calibrate Al concentration in AlGaAs, grown on GaAs
substrate. High Resolution X-Ray Diffraction (HRXRD) geometry θ / 2-θ scans were measured at room temperature (25°C) around [0 0 4] reflection peak of GaAs, by means of a multi-configuration X'Pert Pro MRD PANalytical diffractometer with a sealed tube Cu K-α 1 radiation, equipped with an incident beam monochromator Ge (2 2 0)×4.
For photoluminescence (PL) measurements, the samples were illuminated with a 532 nm continuous wave laser with an incident power of P=380W/cm. Spectrally-resolved PL images were collected by a hyperspectral imager. Mean values on the illumination spot are taken, yielding an IPL spectrum for each structure investigated. The
spectral resolution is 2nm.
For structure optimization, study of recombination mechanism, band diagrams and doping profiles near interfaces, we used the SCAPS simulation software developed by the university of Ghent, Belgium [29]. The minority carriers diffusion lengths for p-type (Ln) and n-type (Lp) materials were estimated from comparing
simulated and measured external quantum efficiencies (EQE). They are directly related to the drift-diffusion model in the emitter, the base, and the depletion region [16], [30], [31]. Semiconductor parameters used in the model were taken from references [32]–[41].
For the analysis of the electronic characteristics of the solar cells, J-V dark and 1 sun J(V)-Jsc were fitted using a two-diode model, with fixed diode idealities of 1 and 2 [28], [42].
Results and discussion
1. Solar cell structure
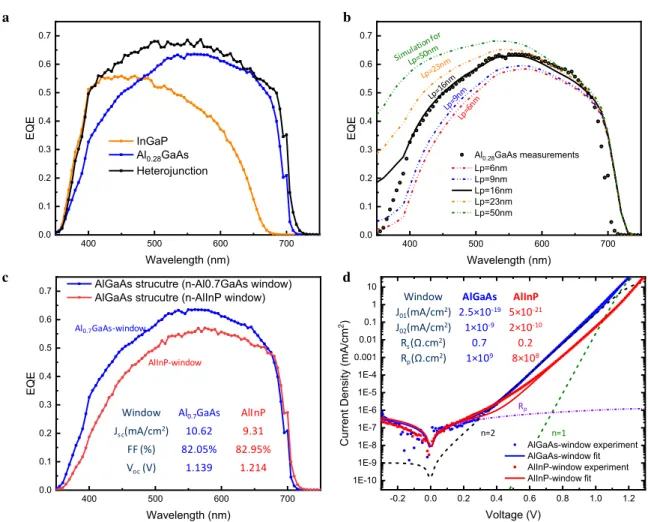
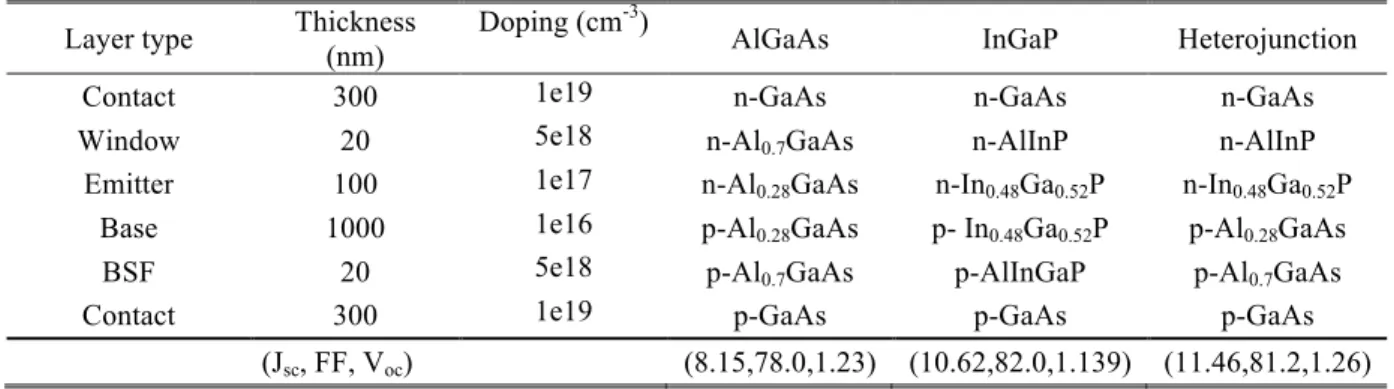
We first study and compare two conventional n-p homojunction solar cells made of AlGaAs and InGaP. The complete stacks are described in Table I, and the corresponding EQE are plotted in Fig. 1(a).
1.1 AlGaAs homojunction
The AlGaAs solar cell is based on an Al0.28GaAs n-p absorber sandwiched between two barriers: a n-Al0.7GaAs
window layer and a p-Al0.7GaAs back surface field (BSF) layer. The EQE exhibits a steep decrease at short
wavelengths. A photocurrent loss of 0.41mA/cm2 as compared to the InGaP cell is calculated from the EQE for
wavelengths below 480 nm (Fig 1(a)). The low collection efficiency in the top n-Al0.28GaAs emitter layer is
attributed to DX-centers related to the Si doping [43]. They result in a high density of deep defects, which act as non-radiative recombination centers and reduce the minority carrier lifetime and mobility [22], [44], [45]. Neglecting the effect of surface recombination, the hole diffusion length Lp in the emitter can be estimated by
comparing simulations results obtained for various Lp with EQE measurements, see Fig 1(b). We find a good
agreement between simulations and experiments over the 400-670nm spectral range impacted by Lp. We
extracted from the fit a hole diffusion length of 16 nm, much lower than the 100 nm emitter thickness. This issue can be circumvented by lowering the Al composition, or by using Se dopant for n-type Al0.28GaAs layer [43].
We have also replaced the n-Al0.7GaAs window layer by a n-AlInP layer, with no other changes in this AlGaAs
structure. Results are shown in Fig. 1(c,d). The increase in Voc of 75mV is consistent with the 5-fold decrease of
the J02 component of the dark J-V (ΔVoc=2kT/q*ln(5)=80mV). It is related to the higher valence band offset at
the Al0.25GaAs/AlInP interface, which limits non radiative recombination (see the band diagrams in Fig 3(e)).
However, this improvement occurs at the expense of the carrier collection efficiency. 1.2 InGaP homojunction
The InGaP solar cell is based on an n-p In0.49Ga0.51P homojunction with a slightly higher bandgap, a
phosphorus-based n-AlInP window layer and a p-AlInGaP BSF layer (structure detailed in Table I). In Fig. 1(a), the decrease of the EQE in the long-wavelength range (above 500 nm) is an indication of collection issues in the base layer, translated into a photocurrent loss of 3.81 mA/cm2 as compared to the AlGaAs cell (calculated with EQE for
λ>480 nm). Similarly, to the previous analysis, we have compared the EQE measurement with simulation results and we estimated a minority carrier diffusion length of the order of Ln~250 nm, much smaller than the 1000 nm
base thickness. This assessment is consistent with our time resolved fluorescence imaging measurements, which resulted in Ln=258 nm and a minority carrier lifetime of 2.3 ns in InGaP layers grown in the same conditions and
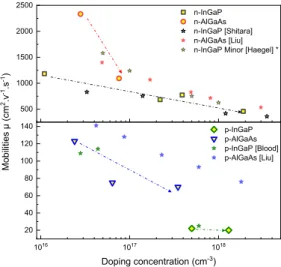
It is known that the material quality of p-InGaP is limited by carrier mobilities and the choice of dopants. Fig. 2
shows the results of Hall effect measurements for InGaP and AlGaAs layers. We see a decreasing mobility as a function of doping, typical of free majority and minority carrier mobility trends and comparable to other values reported in the literature [37], [38], [49]–[52]. Thus, to optimize solar cell performances, the choice of a low p-type doping level should ensure good minority and majority carrier mobilities. However, cracked phosphorous used in MBE growth induces a significant n-type doping residual up to 1e16 cm-3, limiting well-controlled
p-type doping in InGaP structures to concentrations higher than ~1e17 cm-3. Moreover, the choice of p-type
dopants is limited: carbon is amphoteric and its activation rate in InGaP is very low due to self-compensation, leading to n-type doping [53], and Be doping in InGaP promotes O incorporation and increases non-radiative recombination [54], [55]. Finally, p-AlGaAs have higher carrier mobilities than p-InGaP and appear as a better choice (see Fig. 2).
1.3 Heterostructure
To overcome the limitations of previous AlGaAs and InGaP homojunctions related to the poor quality of n-AlGaAs and p-InGaP, respectively, we have combined the best of each structure. It results in a heterojunction made of a thick p-AlGaAs base with a bandgap that can be tuned with the Al content, and a thin n-InGaP with a slightly higher bandgap, as described in Table I. The heterostructure relies on a p-AlGaAs base with better carrier mobilities than p-InGaP, and a n-InGaP emitter for passivation purposes with a lower DX center density than in n-AlGaAs. The spectral response of the p-Al0.28GaAs/n-In0.48Ga0.52P heterojunction shown in Fig. 1(a)
evidences high carrier collection efficiency at both short and long wavelengths.
The bandgap tunability of the p-AlGaAs base layer in the heterostructure is the key for further optimization of our solar cell. Fig. 3(a) shows EQE measurements with tuned Al compositions of 0.37, 0.28 and 0.25, corresponding to direct bandgaps of 1.88eV, 1.77eV and 1.73eV, respectively [12]. As a result, the reduction of the Al concentration induces a decrease of Voc, and an increase of Jsc. It also induces an improvement of the
material quality due to the reduction of DX center defects related to the Al-content. Moreover, the band offset at the Al0.25GaAs/InGaP hetero-interface has a beneficial effect on the dark current and Voc (see Fig. 3(e)) [56],
[57]. In particular, Fig. 3(b) shows a strong increase of the dark current for x=0.37. We also note an increased fill factor (FF) for AlGaAs solar cells with lower Al content.
These observations are confirmed by photoluminescence spectroscopy results obtained on a calibrated hyperspectral imager. It gives access to the absolute intensity of PL emission for each composition of AlGaAs, as displayed in Fig 3(c). This emission is measured in absolute units (e.g. luminance), and is directly related to the quasi-Fermi level splitting Δ𝜇 inside the absorber material [58]. By fitting the acquired spectra with the generalized Planck law [59], we obtained precise values for the bandgap Eg and Δ𝜇 displayed in the table Fig
3(d). Consistently with previous results from EQE fits, the bandgap increases by 40 mV when x increases from 0.25 to 0.28. The values are slightly higher than those determined by EQE (1.77 eV instead of 1.73 eV for x=0.25, and 1.81 eV instead of 1.77eV for x=0.28).It is due to the fact that the fitting model also includes sub-bandgap absorption [59]. Δ𝜇 decreases by 15 mV between x=0.28 and x=0.25, with high values due to the high fluence of the laser (approx. 1000 suns). The difference between the bandgap and quasi-Fermi level splitting, Eg
-Δ𝜇, is a good figure of merit of the quality of the material [60]. It confirms the lower non-radiative recombination observed for x=0.25 (Fig 3(d)), and underlines again the utmost importance to decrease Al content and DX-related defects.
Therefore, considering all previous arguments, the Al0.25GaAs alloy is the best choice for the p-type base in the
heterojunction. Thus, our optimized solar cell structure is: a heterojunction p-Al0.25GaAs/n-InGaP sandwiched
between a p-Al0.51GaAs BSF layer and an n-Al0.53In0.46P window layer.
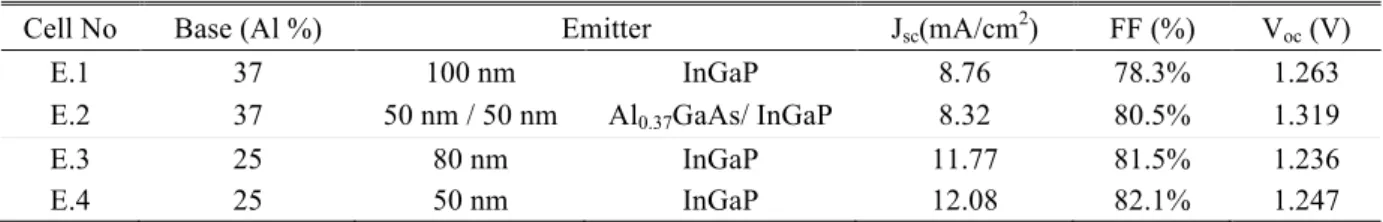
2. Optimization of the emitter thickness
We now study the effect of the emitter thickness and composition. First, two similar layer structures with 37% Al in the base layer and different emitter compositions were grown (Table II): cell E.1 is made of a 100 nm-thick InGaP emitter, and cell E.2 is made of 50 nm of Al0.37GaAs and 50 nm of InGaP. Here, the core idea was to split
the emitter to keep the Al0.37GaAs as a buffer for a continuous growth at the important base/emitter interface.
However, we observe a decrease in Jsc that might be due to the deterioration of the emitter quality related to
DX-center defects in the n-AlGaAs layer as discussed above [43]. The increase in the Voc is related to the higher
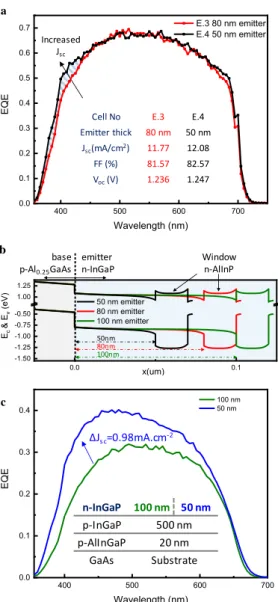
Second, two similar structures with a 25% Al composition in the base layer and with different emitter thicknesses were grown: E.3 and E.4 have an n-InGaP thickness of 80 nm and 50 nm, respectively. The corresponding band structures are shown in Fig. 4(b). Using the same simulation procedure as in Fig. 1(b), we estimated the hole diffusion length in the n-InGaP layer to about Lp=30 nm. At short wavelengths (< 500nm),
minority carriers generated in the emitter are impacted for thicknesses larger than the diffusion length, reducing the collection probability. It explains the lower EQE observed in Fig. 4(a) for the 80 nm-thick n-InGaP emitter layer. Performances of the corresponding solar cells are given in Table II. We have also grown two InGaP structures with different n-InGaP emitter thicknesses: 50 nm and 100 nm. The stacks are similar to the InGaP homojunction of Table I, with a thinner base and no AlInP window layer (see the inset in Table in Fig 4(c)). The EQE increases significantly for the thinner n-InGaP emitter layer, and confirms the impact of the short hole diffusion length of about Lp=30 nm.
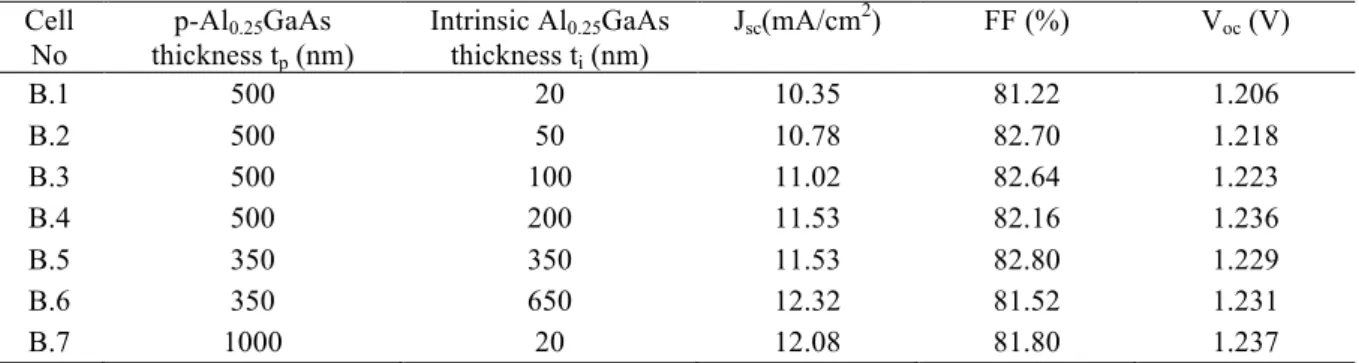
3. Optimization of the base thickness and doping profile
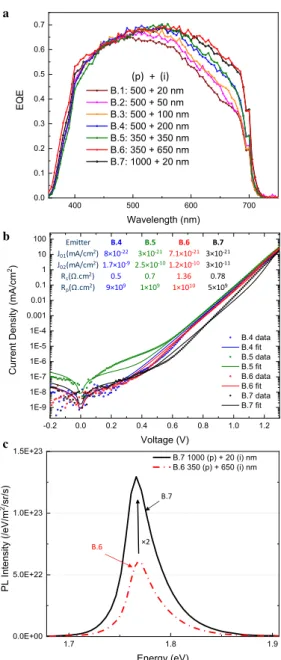
One of the main problems of AlGaAs material is the formation of deep level defects related to Al-O complexes during the growth. In the following, we have varied both the p-doped base and the intrinsic AlGaAs layer thicknesses. By increasing the total AlGaAs thickness, one can expect to quickly degrade Jsc due to the limited
diffusion length and carrier lifetime. However, as observed in Table III and Fig. 5(a), Jsc and EQE increased with
base thickness, indicating a good material quality. Simulations confirm that the minority carrier diffusion length is larger than the base thickness and does not limit the EQE. As a result, the EQE and Jsc can be further enhanced with thicker AlGaAs absorber layers, as it will be shown in Fig. 6(c). We also note an increase in the Voc with the absorber thickness. Dark J-V measurements are shown in Fig. 5(b). Both the decrease of the J02
component and the increase of Jsc with increasing base thicknesses contribute to the Voc improvement. The slight
differences in the resistances and FF (see Table III) are attributed to variations in the process and native oxide on the surface formed during chemical etching.
An intrinsic AlGaAs layer was then introduced between the p-AlGaAs base and the n-InGaP emitter with two different motivations. First, the intrinsic AlGaAs should prevent the diffusion of Be doping atoms from reaching the n-type layer during growth [62]. Second, an intrinsic layer is expected to lower the concentration of ionized impurities and thus to increase the carrier diffusion length by decreasing the defect center concentration induced by dopants [63] [64]. Solar cells with different p-doped and intrinsic AlGaAs thicknesses are compared in Table III. Nevertheless, only minor differences can be seen in efficiencies of solar cells with similar total thicknesses (p-type + intrinsic, see B.4 vs B.5 in Table III). We observe a slight increase in the EQE at short wavelength for B.6 compared to B.7, which is believed to be correlated to the thicker intrinsic layer of 650 nm preventing Be diffusion in the InGaP emitter. From dark and one-sun J-V measurements, no clear conclusion can be drawn on the impact of the intrinsic layer thickness (Table III and Fig 5(b)). However, PL measurements exhibit a two-fold radiative intensity enhancement from the B.7 structure with a thinner intrinsic layer (20 nm) and a thicker p-doped layer (1000 nm as compared to 350 nm in B.6) (see Fig 5(c)). Further optimization of this thickness is needed. In the following, optimized solar cell structures are made of a 100 nm-thick intrinsic layer, slightly thicker than the 20 nm of B.7, in combination with 900 nm-thick and 1900 nm-thick doped base layers.
4. Best cell analysis
Finally, our optimized solar cell is the following: a p-Al0.25GaAs:Be base with a 1.73 eV direct bandgap, an
optimized doping profile at 2x1016 cm-3 and two different thicknesses, followed by a thin 100-nm-intrinsic
Al0.25GaAs to prevent Be diffusion, and a thin non-doped 50 nm InGaP emitter layer with the highest carrier
mobility (the residual doping in the InGaP layer is n-type and has a concentration of 1x1016 cm-3). The
AlGaAs/InGaP heterojunction is sandwiched between highly doped n-AlInP:Si window layer and p-Al0.51GaAs:Be BSF layer, as described in Fig. 6(a). A 65 nm-thick SiNx anti-reflective coating (ARC) layer is
deposited after the front n-GaAs contact layer removal by chemical etching using the front electrodes as a mask. This ARC has an obvious effect on Jsc, but it has no measurable impact on the other electrical parameters of the cell (dark IV, FF and Voc under illumination). The best cell was measured by Fraunhofer ISE calibration laboratory under standard test conditions (AM1.5G, 1000 W/m2, 25°C). We obtained a solar cell with a certified efficiency η=18.7% with Jsc=17.66 mA/cm2, Voc=1.254 V and FF=84.37%, as shown in Fig. 6(b) and Fig. 6(c).
The FF increase as compared to previous samples is due to the smaller spacing of contact grids, the larger cell surface area of 0.5×0.5 cm2, and the higher doping in the window layer.
In Fig .6(c), we compare two similar structures with a 1 µm-thick base and a 2 µm-thick base, respectively. We observe an increase of FF in the thinner structure that may be due to the band bending slopes in the thinner base structure and a reduction of bulk recombination [28]. Also, the dark current decreases in thinner absorbers (see
Fig 6(d)), which in turn increases Voc, reaching a Woc = Eg/q-Voc = 0.438 V, indicating a lower bulk
recombination in the 1µm device.
Conclusions
We have presented high efficiency AlGaAs solar cells grown by MBE. The material quality of the semiconductor layers and the design of the heterojunction have been investigated and optimized simultaneously. The combination of a thick p-Al0.25Ga0.75As base layer with a thin n-InGaP emitter layer provides a way to
increase carrier mobilities and to reduce the impact of DX-centers. This heterojunction design has the additional advantages of a tunable bandgap of the AlGaAs absorber, and a low consumption of In. It resulted in a certified efficiency of 18.7% at a bandgap of 1.73 eV, perfectly suited for Si-based tandem devices. Higher efficiencies can be achieved with further growth optimization, double ARC and back mirror.
Acknowledgments
The authors acknowledge Julie Goffard, Hung-Ling Chen, Christophe Dupuis, Thomas Bidaud and Karolien Saliou for their support in fabrication and characterization, Andrea Cattoni, Andrea Scaccabarozzi, Romaric de Lépinau and Arthur Onno for fruitful discussions. This project has been supported by the French government in the frame of the ”Programme d’Investissement d’Avenir” - ANR-IEED-002-01.
[1] R. Cariou et al., “III–V-on-silicon solar cells reaching 33% photoconversion efficiency in two-terminal configuration,” Nat. Energy, vol. 3, no. 4, pp. 326–333, Apr. 2018.
[2] S. Essig et al., “Raising the one-sun conversion efficiency of III–V/Si solar cells to 32.8% for two junctions and 35.9% for three junctions,” Nat. Energy, vol. 2, no. 9, p. 17144, Aug. 2017.
[3] T. J. Grassman, J. A. Carlin, C. Ratcliff, D. J. Chmielewski, and S. A. Ringel, “Epitaxially-grown metamorphic GaAsP/Si dual-junction solar cells,” in 2013 IEEE 39th Photovoltaic Specialists Conference
(PVSC), Tampa, FL, USA, 2013, pp. 0149–0153.
[4] T. Leijtens, K. A. Bush, R. Prasanna, and M. D. McGehee, “Opportunities and challenges for tandem solar cells using metal halide perovskite semiconductors,” Nat. Energy, vol. 3, pp. 828–838, Jul. 2018.
[5] J. P. Connolly, D. Mencaraglia, C. Renard, and D. Bouchier, “Designing III–V multijunction solar cells on silicon,” Prog. Photovolt. Res. Appl., vol. 22, no. 7, pp. 810–820, 2014.
[6] A. Onno, N.-P. Harder, L. Oberbeck, and H. Liu, “Simulation study of GaAsP/Si tandem solar cells,” Sol.
Energy Mater. Sol. Cells, vol. 145, pp. 206–216, Feb. 2016.
[7] F. Dimroth et al., “Comparison of Direct Growth and Wafer Bonding for the Fabrication of GaInP/GaAs Dual-Junction Solar Cells on Silicon,” IEEE J. Photovolt., vol. 4, pp. 620–625, 2014.
[8] K. Tanabe, K. Watanabe, and Y. Arakawa, “III-V/Si hybrid photonic devices by direct fusion bonding,”
Sci. Rep., vol. 2, p. 349, Apr. 2012.
[9] E. Veinberg Vidal et al., “Characterization of dual-junction III-V on Si tandem solar cells with 23.7% efficiency under low concentration,” Prog. Photovolt. Res. Appl., vol. 27, no. 7.
[10] X. Sheng et al., “Printing-based assembly of quadruple-junction four-terminal microscale solar cells and their use in high-efficiency modules,” Nat. Mater., vol. 13, no. 6, pp. 593–598, Jun. 2014.
[11] I. Mathews, D. O’Mahony, K. Thomas, E. Pelucchi, B. Corbett, and A. P. Morrison, “Adhesive bonding for mechanically stacked solar cells,” Prog. Photovolt. Res. Appl., vol. 23, no. 9, pp. 1080–1090, 2015. [12] S. Adachi, GaAs and Related Materials: Bulk Semiconducting and Superlattice Properties. WORLD
SCIENTIFIC, 1994.
[13] K. Akimoto, M. Kamada, K. Taira, M. Arai, and N. Watanabe, “Photoluminescence killer center in AlGaAs grown by molecular beam epitaxy,” J. Appl. Phys., vol. 59, no. 8, pp. 2833–2836, Apr. 1986. [14] S. Heckelmann, D. Lackner, F. Dimroth, and A. W. Bett, “Material quality frontiers of MOVPE grown
AlGaAs for minority carrier devices,” J. Cryst. Growth, vol. 464, pp. 49–53, Apr. 2017.
[15] S. J. Pearton, F. Ren, W. S. Hobson, C. R. Abernathy, and U. K. Chakrabarti, “Comparison of surface recombination velocities in InGaP and AlGaAs mesa diodes,” J. Vac. Sci. Technol. B Microelectron.
Nanometer Struct. Process. Meas. Phenom., vol. 12, no. 1, pp. 142–146, Jan. 1994.
[16] S. R. Kurtz, J. M. Olson, D. J. Friedman, J. F. Geisz, K. A. Bertness, and A. E. Kibbler, “Passivation of Interfaces in High-Efficiency Photovoltaic Devices,” MRS Online Proc. Libr. Arch., vol. 573, 1999. [17] D. L. Anderson, Theory of the Earth. Boston, MA: Blackwell Scientific Publications, 1989.
[18] G. Phipps, C. Mikolajczak, and T. Guckes, “Indium and Gallium: long-term supply,” Renew. Energy
Focus, vol. 9, no. 4, pp. 56–59, Jul. 2008.
[19] T. T. Werner, G. M. Mudd, and S. M. Jowitt, “The world’s by-product and critical metal resources part III: A global assessment of indium,” Ore Geol. Rev., vol. 86, pp. 939–956, Jun. 2017.
[20] B. A. Andersson, “Materials availability for large-scale thin-film photovoltaics,” Prog. Photovolt. Res.
Appl., vol. 8, no. 1, pp. 61–76, 2000.
[21] A. Onno, M. Tang, L. Oberbeck, J. Wu, and H. Liu, “Impact of the growth temperature on the performance of 1.70-eV Al0.22Ga0.78As solar cells grown by MBE,” J. Cryst. Growth, vol. 475, pp. 322– 327, Oct. 2017.
[22] S. Heckelmann, D. Lackner, C. Karcher, F. Dimroth, and A. W. Bett, “Investigations on AlxGa1−xAs Solar Cells Grown by MOVPE,” IEEE J. Photovolt., vol. 5, no. 1, pp. 446–453, Jan. 2015.
[23] P. Dai et al., “The investigation of GaInP solar cell grown by all-solid MBE,” J. Cryst. Growth, vol. 378, pp. 604–606, Sep. 2013.
[24] R. Oshima, Y. Nagato, Y. Okano, and T. Sugaya, “Enhancement of open-circuit voltage in InGaP solar cells grown by solid source molecular beam epitaxy,” Jpn. J. Appl. Phys., vol. 57, no. 8S3, p. 08RD07, Aug. 2018.
[25] J. F. Geisz, M. A. Steiner, I. García, S. R. Kurtz, and D. J. Friedman, “Enhanced external radiative efficiency for 20.8% efficient single-junction GaInP solar cells,” Appl. Phys. Lett., vol. 103, no. 4, p. 041118, Jul. 2013.
[26] S. Kim, S.-T. Hwang, W. Yoon, and H.-M. Lee, “High performance GaAs solar cell using heterojunction emitter and its further improvement by ELO technique,” 32nd Eur. Photovolt. Sol. Energy Conf. Exhib., 2016.
[27] M. A. Green, Y. Hishikawa, E. D. Dunlop, D. H. Levi, J. Hohl Ebinger, and A. W. Y. Ho Baillie, “Solar cell efficiency tables (version 52),” Prog. Photovolt. Res. Appl., vol. 26, no. 7, pp. 427–436, 2018.
[28] H.-L. Chen et al., “A 19.9%-efficient ultrathin solar cell based on a 205-nm-thick GaAs absorber and a silver nanostructured back mirror,” Nat. Energy, pp. 1–7, Aug. 2019.
[29] M. Burgelman, P. Nollet, and S. Degrave, “Modelling polycrystalline semiconductor solar cells,” Thin
Solid Films, vol. 361–362, pp. 527–532, Feb. 2000.
[30] H. J. Hovel and J. M. Woodall, “The effect of depletion region recombination currents on the efficiencies of Si and GaAs solar cells.,” Proc IEEE Photovolt. Spec Conf, vol. 10th, pp. 34–39, 1974.
[31] M. P. Lumb et al., “Extending the 1-D Hovel Model for Coherent and Incoherent Back Reflections in Homojunction Solar Cells,” IEEE J. Quantum Electron., vol. 49, no. 5, pp. 462–470, May 2013.
[32] H. Kato, S. Adachi, H. Nakanishi, and K. Ohtsuka, “Optical Properties of (AlxGa1-x)0.5In0.5P Quaternary Alloys,” Jpn. J. Appl. Phys., vol. 33, no. 1R, p. 186, Jan. 1994.
[33] M. E. Kalusmeier-Brown, M. S. Lundstrom, and M. R. Melloch, “The effects of heavy impurity doping on AlGaAs/GaAs bipolar transistors,” IEEE Trans. Electron Devices, vol. 36, no. 10, pp. 2146–2155, Oct. 1989.
[34] M. Moser, C. Geng, E. Lath, F. Scholz, and H. Schweizer, “Optical Characterization of GalnP Layers,” in
Sixth International Conference Metalorganic Vapor Phase Epitaxy, 1992, pp. 210–211.
[35] S. Selberherr, Analysis and Simulation of Semiconductor Devices. Wien: Springer-Verlag, 1984.
[36] W. Shockley and W. T. Read, “Statistics of the Recombinations of Holes and Electrons,” Phys. Rev., vol. 87, no. 5, pp. 835–842, Sep. 1952.
[37] T. Shitara and K. Eberl, “Electronic properties of InGaP grown by solid source molecular beam epitaxy with a GaP decomposition source,” Appl. Phys. Lett., vol. 65, no. 3, pp. 356–358, Jul. 1994.
[38] B. R. Nag and M. Das, “Electron mobility in In0.5Ga0.5P,” J. Appl. Phys., vol. 83, no. 11, pp. 5862–5864, Jun. 1998.
[39] D. E. Aspnes, S. M. Kelso, R. A. Logan, and R. Bhat, “Optical properties of AlxGa1−x As,” J. Appl.
Phys., vol. 60, no. 2, pp. 754–767, Jul. 1986.
[40] M. Shur, Physics of Semiconductor Devices. Prentice Hall, 1990.
[41] M. Levinshtein, Handbook Series on Semiconductor Parameters. World Scientific, 1997.
[42] S. Rißland and O. Breitenstein, “Considering the Distributed Series Resistance in a Two-diode Model,”
Energy Procedia, vol. 38, pp. 167–175, Jan. 2013.
[43] K. Takahashi, Y. Minagawa, S. Yamada, and T. Unno, “Improved efficiency of Al0.36Ga0.64As solar cells with a pp−n−n structure,” Sol. Energy Mater. Sol. Cells, vol. 66, no. 1–4, pp. 525–532, Feb. 2001. [44] C. Amano, K. Ando, and M. Yamaguchi, “The effect of oxygen on the properties of AlGaAs solar cells
grown by molecular beam epitaxy,” J. Appl. Phys., vol. 63, no. 8, pp. 2853–2856, Apr. 1988.
[45] M. R. Islam et al., “The growth and characterization of AlGaAs double heterostructures for the evaluation of reactor and source quality,” J. Electron. Mater., vol. 24, no. 6, pp. 787–792, Jun. 1995.
[46] O. Breitenstein, J. Bauer, P. P. Altermatt, and K. Ramspeck, “Influence of Defects on Solar Cell Characteristics,” Solid State Phenom., vol. 156–158, pp. 1–10, 2010.
[47] A. Bercegol, G. El-Hajje, D. Ory, and L. Lombez, “Determination of transport properties in optoelectronic devices by time-resolved fluorescence imaging,” J. Appl. Phys., vol. 122, no. 20, p. 203102, Nov. 2017. [48] A. Michaud et al., “Elaboration of III-V top cell for tandem with Silicon,” in 2019 IEEE 46th Photovoltaic
Specialist Conference (PVSC), 2019.
[49] W. C. Liu, “Investigation of electrical and photoluminescent properties of MBE-grown AlxGa1−xAs layers,” J. Mater. Sci., vol. 25, no. 3, pp. 1765–1772, Mar. 1990.
[50] N. M. Haegel et al., “Doping dependence and anisotropy of minority electron mobility in molecular beam epitaxy-grown p type GaInP,” Appl. Phys. Lett., vol. 105, no. 20, p. 202116, Nov. 2014.
[51] P. Blood, J. S. Roberts, and J. P. Stagg, “GaInP grown by molecular beam epitaxy doped with Be and Sn,”
J. Appl. Phys., vol. 53, no. 4, pp. 3145–3149, Apr. 1982.
[52] Z. Z. Sun, S. F. Yoon, and W. K. Loke, “Electrical properties of silicon- and beryllium-doped GaInP and (AlGa)InP grown by solid source molecular beam epitaxy,” J. Cryst. Growth, vol. 235, no. 1, pp. 8–14, Feb. 2002.
[53] C. B. Vartuli, C. R. Abernathy, S. J. Pearton, J. C. Zolper, and A. J. Howard, “C implantation and surface degradation of InGaP,” J. Electron. Mater., vol. 25, no. 10, pp. 1640–1644, Oct. 1996.
[54] S. P. Najda, A. Kean, R. W. Streater, and A. J. SpringThorpe, “SIMS measurements of oxygen impurities in AlGaInP semiconductor material and laser diodes,” J. Cryst. Growth, vol. 220, no. 3, pp. 226–230, Dec. 2000.
[55] N. Xiang, A. Tukiainen, M. Pessa, J. Dekker, and J. Likonen, “Oxygen impurities in Ga0.51In0.49P grown by solid-source molecular beam epitaxy,” J. Mater. Sci. Mater. Electron., vol. 13, no. 9, pp. 549– 552, Sep. 2002.
[56] S.-T. Hwang et al., “Bandgap grading and Al0.3Ga0.7As heterojunction emitter for highly efficient GaAs-based solar cells,” Sol. Energy Mater. Sol. Cells, vol. 155, pp. 264–272, Oct. 2016.
[57] N. Jensen et al., “Recombination mechanisms in amorphous silicon/crystalline silicon heterojunction solar cells,” J. Appl. Phys., vol. 87, no. 5, pp. 2639–2645, Mar. 2000.
[58] P. Würfel, Physics of Solar Cells: From Principles to New Concepts. John Wiley & Sons, 2008.
[59] J. K. Katahara and H. W. Hillhouse, “Quasi-Fermi level splitting and sub-bandgap absorptivity from semiconductor photoluminescence,” J. Appl. Phys., vol. 116, no. 17, p. 173504, Nov. 2014.
[60] R. R. King et al., “Band gap-voltage offset and energy production in next-generation multijunction solar cells,” Prog. Photovolt. Res. Appl., vol. 19, no. 7, pp. 797–812, 2011.
[61] T. Masuda, S. Tomasulo, J. R. Lang, and M. L. Lee, “Comparison of single junction AlGaInP and GaInP solar cells grown by molecular beam epitaxy,” J. Appl. Phys., vol. 117, no. 9, p. 094504, Mar. 2015. [62] D. L. Miller and P. M. Asbeck, “Be redistribution during growth of GaAs and AlGaAs by molecular beam
epitaxy,” J. Appl. Phys., vol. 57, no. 6, pp. 1816–1822, Mar. 1985.
[63] A. W. Bett, F. Dimroth, G. Stollwerck, and O. V. Sulima, “III-V compounds for solar cell applications,”
Appl. Phys. Mater. Sci. Process., vol. 69, no. 2, pp. 119–129, Aug. 1999.
[64] A. Bahrami, S. Mohammadnejad, and S. Soleimaninezhad, “Photovoltaic cells technology: principles and recent developments,” Opt. Quantum Electron., vol. 45, no. 2, pp. 161–197, Feb. 2013.
Figures:
Figure 1. (a), External quantum efficiency (EQE) of the InGaP (orange) and AlGaAs (blue) solar cells, and
AlGaAs/InGaP base/emitter heterojunction (black). Structures without anti-reflective coating (ARC). (b), EQE simulated with a SCAPS model for various minority carrier diffusion lengths. (c), EQE measurements of two AlGaAs structures: with a n-Al.07GaAs-window and with a n-AlInP-window. Inset: solar cell characteristics obtained from J-V curves under 1-sun AM1.5G spectrum. (d), Dark J-V characteristics in log scale and fits with two-diode model. The different components of the J-V dark model are shown for the AlGaAs-window device in dashed lines: black and green dashed curves for ideality factors of n=1 and n=2, respectively, and violet dashed
curve for the parallel resistance. Inset: fitted parameters.
400 500 600 700 0.0 0.1 0.2 0.3 0.4 0.5 0.6 0.7 EQE Wavelength (nm)
AlGaAs strucutre (n-Al0.7GaAs window) AlGaAs strucutre (n-AlInP window)
a
Window Al0.7GaAs AlInP Jsc(mA/cm2) 10.62 9.31 FF (%) 82.05% 82.95% Voc(V) 1.139 1.214 b AlInP-window Al0.7GaAs-window 400 500 600 700 0.0 0.1 0.2 0.3 0.4 0.5 0.6 0.7 Al0.28GaAs measurements Lp=6nm Lp=9nm Lp=16nm Lp=23nm Lp=50nm EQE Wavelength (nm) c -0.2 0.0 0.2 0.4 0.6 0.8 1.0 1.2 1E-10 1E-9 1E-8 1E-7 1E-6 1E-5 1E-4 0.001 0.01 0.1 1 10 Curr en t Den sity (m A/cm 2) Voltage (V) AlGaAs-window experiment AlGaAs-window fit AlInP-window experiment AlInP-window fit n=1 n=2 d
Window AlGaAs AlInP
J01(mA/cm2) 2.5×10⁻¹⁹ 5×10-21 J02(mA/cm2) 1×10⁻⁹ 2×10⁻¹⁰ Rs(Ω.cm2) 0.7 0.2 Rp(Ω.cm2) 1×10⁹ 8×10⁸ 400 500 600 700 0.0 0.1 0.2 0.3 0.4 0.5 0.6 0.7 EQE Wavelength (nm) InGaP Al0.28GaAs Heterojunction Rp
Figure 2. Majority Carriers mobilities (300 K) as a function of the doping concentration, determined by Hall
measurements. Dashed arrows are guides to the eyes. Majority carrier mobilities taken from the literature are from Shitara et al.[37], Liu et al.[49], and Blood et al. [51]. * Mobility of minority carriers are also taken from
Haegel [50]. 500 1000 1500 2000 2500 n-InGaP n-AlGaAs n-InGaP [Shitara] n-AlGaAs [Liu] n-InGaP Minor [Haegel] *
1016 1017 1018 20 40 60 80 100 120 140 p-InGaP p-AlGaAs p-InGaP [Blood] p-AlGaAs [Liu] Mo bilities µ (cm 2.v -1.s -1) Doping concentration (cm-3) dg
Figure 3. (a) EQE and (b) dark J-V measurements of solar cells with an InGaP hetero-emitter and an AlxGa1-xAs
base of different aluminum compositions. (inset) Solar cell values obtained from J-V curves under 1-sun AM1.5G spectrum are given in the inset of (a), and dark J-V curves are fitted with a two-diode model (J01 and J02
parameters given in the inset of (b)). Eg are extracted from EQE. Aluminum compositions are extracted from XRD. Note that all solar cells in this graph do not have an ARC. (c) PL of AlxGa1-xAs base solar cells with
x=0.28 and x=0.25. (d) The bandgaps Eg are extracted from the EQE, and Eg and Δµ are obtained by fitting
calibrated PL spectra. (e) Band diagrams (from SCAPS simulation) of the solar cells near the interface between the base and the emitter under 1.0 V bias.
-40 -20 0 20 40 60 -1.0 -0.5 0.0 0.5 1.0
(A) p-Al25GaAs/n-Al25GaAs/n-Al7GaAs (B) p-Al25GaAs/n-Al25GaAs/n-AlInP (C) p-Al25GaAs/n-InGaP/n-AlInP Electron Fermi level
Ec
& E
v
(e
V)
Distance from junction (nm)
0.0 0.2 0.4 0.6 0.8 1.0 1.2 1E-10 1E-9 1E-8 1E-7 1E-6 1E-5 1E-4 0.001 0.01 0.1 1 10 Curr en t d en sity (m A/cm 2) Voltage (V) x=0.37 experiment x=0.37 fit x=0.28 experiment x=0.28 fit x=0.25 experiment x=0.25 fit emitter base window 400 500 600 700 0.0 0.1 0.2 0.3 0.4 0.5 0.6 0.7 EQE Wavelength (nm) x=0.37 x=0.28 x=0.25 Al % 37 28 25 Eg (eV) 1.884 1.771 1.734 Jsc(mA/cm2) 8.76 10.50 12.08 FF (%) 77.7% 81.2%82.15% Voc(V) 1.26 1.26 1.247 Woc(V) 0.624 0.511 0.487 a b Al % 37 28 25 J01(mA/cm2) 3×10-11 4×10-21 3×10-21 J02(mA/cm2) 3×10⁻⁵ 5.5×10-113×10-11 1.7 1.8 1.9 0.0E+00 5.0E+22 1.0E+23 1.5E+23 PL In ten sity (/ eV/m 2/sr/ s) Energy (eV) x=0.28 x=0.25 x=0.28 x=0.25
c Al% Bandgap from
EQE(eV) Bandgap from PL (eV) (eV)Δμ E(eV)g-Δμ
25 1.73 1.77 1.486 0.28 28 1.77 1.81 1.501 0.31 e n-AlInP (p-AlGaAs) n-GaInP n-Al25GaAs d n-Al70GaAs
Figure 4. (a) EQE measurements of solar cells with a n-InGaP emitter layer: 80nm-thick in red and 50nm-thick
in black (all other layers are kept the same, see the heterojunction structure in Table I). Inset: solar cell characteristics obtained from IV-curves under 1-sun AM1.5G spectrum. (b) Band diagrams (from SCAPS simulations) of three solar cells with different emitter thicknesses (50 nm, 80 nm and 100 nm), near the interface
AlGaAs/InGaP under 1-sun illumination at AM1.5G (1.0-V biased condition). (c) EQE measurements of InGaP solar cells with two different emitter thicknesses: 100 nm (green) and 50 nm (blue). Inset: the InGaP structure
with no window layer and ARC.
400 500 600 700 0.0 0.1 0.2 0.3 0.4 EQE Wavelength (nm) 100 nm 50 nm ΔJsc=0.98mA.cm-2 n-InGaP 100 nm 50 nm p-InGaP 500 nm p-AlInGaP 20 nm GaAs Substrate 0.0 0.1 -1.50 -1.25 -1.00 -0.75 -0.50 1.00 1.25 Ec & E v (e V) x(um) 0.0 0.1 1E15 1E16 1E17 1E18 1E19 1E20 1E21 50 nm emitter 80 nm emitter 100 nm emitter re com bina tion (# /cm3 .s) x(um) base p-Al0.25GaAs emitter
n-InGaP Windown-AlInP Increased
Jsc
Cell No E.3 E.4
Emitter thick 80 nm 50 nm Jsc(mA/cm2) 11.77 12.08 FF (%) 81.57 82.57 Voc(V) 1.236 1.247 a b 50nm 80nm 100nm c Increased Jsc
Cell No E.3 E.4
Emitter thick 80 nm 50 nm Jsc(mA/cm2) 11.77 12.08 FF (%) 81.57 82.57 Voc(V) 1.236 1.247 a 400 500 600 700 0.0 0.1 0.2 0.3 0.4 0.5 0.6 0.7 EQE Wavelength (nm) E.3 80 nm emitter E.4 50 nm emitter ΔJsc=0.98mA.cm-2 n-InGaP 100 nm 50 nm p-InGaP 500 nm p-AlInGaP 20 nm GaAs Substrate c
Figure 5. (a) EQE of solar cells with different p-type AlGaAs and intrinsic AlGaAs thicknesses (see Table III
for their description and performances). (b) Dark J-V characteristics and two-diode model fits of B.4, B.5, B.6 and B.7 samples. (c) PL measurements of B.6 and B.7 samples.
-0.2 0.0 0.2 0.4 0.6 0.8 1.0 1.2 1E-9 1E-8 1E-7 1E-6 1E-5 1E-4 0.001 0.01 0.1 1 10 100 Curr en t Den sity (m A/cm 2) Voltage (V) B.4 data B.4 fit B.5 data B.5 fit B.6 data B.6 fit B.7 data B.7 fit 400 500 600 700 0.0 0.1 0.2 0.3 0.4 0.5 0.6 0.7 EQE Wavelength (nm) B.1: 500 + 20 nm B.2: 500 + 50 nm B.3: 500 + 100 nm B.4: 500 + 200 nm B.5: 350 + 350 nm B.6: 350 + 650 nm B.7: 1000 + 20 nm 1.7 1.8 1.9 0.0E+00 5.0E+22 1.0E+23 1.5E+23 PL In ten sity (/ eV/m 2/sr/ s) Energy (eV) B.7 1000 (p) + 20 (i) nm B.6 350 (p) + 650 (i) nm B.7 B.6 ×2 (p) + (i) a c b Emitter B.4 B.5 B.6 B.7 J01(mA/cm2)8×10-22 3×10-21 7.1×10⁻²¹ 3×10-21 J02(mA/cm2)1.7×10-92.5×10-101.2×10-10 3×10-11 Rs(Ω.cm2) 0.5 0.7 1.36 0.78 Rp(Ω.cm2) 9×10⁹ 1×10⁹ 1×10¹⁰ 5×10⁹
Figure 6. (a) Schematic of the layer stack of the optimized heterojunction solar cell (not to scale). (b) I-V
characteristics of the solar cell samples with a 2 µm-thick base, measured at the Fraunhofer ISE calibration laboratory under standard conditions (AM1.5G, 1,000 W.m−2, 25 °C). (c) EQE graphs of solar cell samples with
2µm thick base (in red) and with 1µm thick base (in black). Inset: performances from calibrated measurements.
(d) Dark J-V measurements and the two-diode model fits, with the different components of the model given in
the inset. -0.2 0.0 0.2 0.4 0.6 0.8 1.0 1.2 1.4 1E-9 1E-8 1E-7 1E-6 1E-5 1E-4 0.001 0.01 0.1 1 10 100 1µm Data 2µm Data 1µm Fit 2µm Fit Curr en t Den sity (m A/cm 2) Voltage (V) 300 400 500 600 700 0,0 0,1 0,2 0,3 0,4 0,5 0,6 0,7 0,8 0,9 1,0 EQE Wavelength (nm) 1µm 2µm sample 1µm 2µm Jsc(ma/cm2) 16.33 17.66 FF (%) 86.06 84.37 Voc(V) 1.292 1.254 Eff (%) 18.16 18.70 p-GaAs:Zn Substrate p+-Al 0.5GaAs:Be p-Al0.25GaAs:Be InGaP n+-AlInP:Si Front contact Back contact SiNxARC Al0.25GaAs 70 nm 1900 nm 50 nm 20 nm 100 nm 5e18 cm-3 2e16 cm-3 N/A 1e19 cm-3 N/A a b c d base thick 1µm 2µm J01(mA/cm2) 1.5×10-213.5×10⁻²¹ J02(mA/cm2) 6.5×10-111.3×10⁻¹⁰ Rs(Ω.cm2) 0.9 0.7 Rp(Ω.cm2) 2.5×10⁹ 2×10⁹
Tables:
Table I. Details of the AlGaAs, InGaP and heterojunction layer structures. The growth is from the bottom to the
top (n on p). The characteristics under AM1.5G illumination are given (last row): (Jsc, FF, Voc) in unit of
(mA/cm2, %, V).
Layer type Thickness (nm) Doping (cm-3) AlGaAs InGaP Heterojunction
Contact 300 1e19 n-GaAs n-GaAs n-GaAs
Window 20 5e18 n-Al0.7GaAs n-AlInP n-AlInP
Emitter 100 1e17 n-Al0.28GaAs n-In0.48Ga0.52P n-In0.48Ga0.52P
Base 1000 1e16 p-Al0.28GaAs p- In0.48Ga0.52P p-Al0.28GaAs
BSF 20 5e18 p-Al0.7GaAs p-AlInGaP p-Al0.7GaAs
Contact 300 1e19 p-GaAs p-GaAs p-GaAs
Table II. Emitter thickness comparison (all other layers are kept the same, see the heterojunction structure in
Table I). Solar cell parameters obtained from IV-curves under 1-sun AM1.5G illumination. Aluminum compositions are extracted from XRD. Note that all solar cells in this table have no ARC.
Cell No Base (Al %) Emitter Jsc(mA/cm2) FF (%) Voc (V)
E.1 37 100 nm InGaP 8.76 78.3% 1.263
E.2 37 50 nm / 50 nm Al0.37GaAs/ InGaP 8.32 80.5% 1.319
E.3 25 80 nm InGaP 11.77 81.5% 1.236
Table III. Solar cell structures with different base thicknesses and corresponding measured I-V parameters
under 1-sun illumination. The complete structure from top to bottom is as follows: n-AlInP(20nm)/n-InGaP(50nm)/Al0.25Ga0.75As(ti)/p-Al0.25Ga0.75As(tp)/Al0.51Ga0.49As(70nm)
Cell No p-Al0.25GaAs thickness tp (nm) Intrinsic Al0.25GaAs thickness ti (nm) Jsc(mA/cm2) FF (%) Voc (V) B.1 500 20 10.35 81.22 1.206 B.2 500 50 10.78 82.70 1.218 B.3 500 100 11.02 82.64 1.223 B.4 500 200 11.53 82.16 1.236 B.5 350 350 11.53 82.80 1.229 B.6 350 650 12.32 81.52 1.231 B.7 1000 20 12.08 81.80 1.237