James A. Revie*. David J. Stevenson*. J. Geoffrey Chase*. Bernard C. Lambermont**. Alexandre Ghuysen** Philippe Kolh**. Geoffrey M. Shaw***. Thomas Desaive**
*Department of Mechanical Engineering, University of Canterbury, Chirstchurch, NZ (e-mail: [email protected])
** Hemodynamic Research Laboratory, University of Liege, Belgium *** Department of Intensive Care, Christchurch Hospital, NZ
Abstract: Aortic pressure (Pao) can be separated into two components representing the wave phenomena
of flow, called excess pressure (Pex), and the storage capacity of the elastic arteries, called reservoir
pressure (Pwk). Subject-specific aortic models, identified from measurements from a porcine study on
septic shock, were used to calculate the hydraulic work associated with the excess and reservoir pressures (Wex, Wwk). Changes in these energies were compared to a metrics derived from left ventricular
pressure-volume analysis. Total aortic work (Wao=Wex+Wwk) compared well to clinically assessed left ventricular
work (R2=0.88). However, only a weak relationship of R2 = 0.24 was found between ventricular arterial coupling (Ees/Ea) and Wex/Wwk. Although a strong relationship (R2 = 0.76) was noticed between the
inverse of afterload (1/Ea) and Wex. As septic shock progressed, a drop in Wwk was seen, indicating the
arterial system loses its ability to store the stoke volume (SV) from the ventricle for release during diastole, resulting in a flattening of the diastolic pressure. These results indicate that one of the main reasons left ventricular afterload decreases during septic shock is because arterial system loses its ability to act as a storage reservoir.
Keywords:, Physiological models, septic shock, hemodynamic monitoring, parameter identification.
1. INTRODUCTION
Arterial pressure and cardiac output (CO) are two of the main measures of which intensive care cardiovascular management is based on. However, recently, the efficiency of hemodynamic monitoring to affect outcome has been questioned (Pinsky, 2003). The positive impact of CO and/or stroke volume (SV) monitoring has not been proven (Mutoh et al., 2007, Pinsky, 2007). Furthermore, although continuous blood pressure monitoring of the arterial waveform is common place, the most commonly used blood pressure indices are calculated from discrete measurements of systolic and diastolic pressure, neglecting the morphological information available from the shape of the arterial pulse. All these results suggest these measurements are underutilised in the intensive care unit (ICU).
This study looks at utilising SV and the shape of the aortic pressure waveform to better understand the dynamics of arterial flow and ventricular arterial coupling. It is based on the work of (Wang et al., 2003, Davies et al., 2010, Tyberg et al., 2009) where the aortic pressure is separated into two components representing the reservoir pressure and the excess pressure (Fig. 1). These components were identified using measurements from a porcine study of septic shock (Lambermont et al., 2006) to create subject-specific models of aortic blood flow.
It is hypothesised that the work of the excess pressure represents the contractile state of the ventricle, and reservoir pressure component is the energy that needs to be overcome for forward flow. Hence, the ratio of the excess pressure and reservoir work may represent a metric of ventricular arterial coupling. To test this hypothesis the modelled hydraulic energies of these components were compared to metrics obtained from left ventricular pressure-volume (P-V) loops, to understand their relationship to ventricular arterial (de)coupling during septic shock.
2. METHODS
2.1 Porcine trials and measurements
All procedures and protocols used were approved by the Ethics Committee of the Medical Faculty at the University of Liege, Belgium. Experiments were performed on 4 healthy pure pietrain pigs weighing between 20-30kg. The animals were premedicated, anesthetised, and ventilated as explained in (Lambermont et al., 2006). The animals received a 0.5-mg/kg endotoxin infusion over 30 minutes (from T0 to T30) to model septic shock. Micro-tipped catheters were used to record continuous hemodynamic measurements during the study. Every 30 minutes (T0 to T120) 6-12 central aortic pressure waveforms (Pao) were recorded. At the same time,
descending left ventricular pressure-volume (P-V) loops (Plv,
vena cava. All measurements were recorded at a 200Hz sampling rate. In this study, 36 sets of measurements from the 4 pigs were used. Further details on these trials can be found in (Lambermont et al., 2006)
2.2 Aortic pressure model
The arterial pressure model is based on (Wang et al., 2003, Davies et al., 2010, Tyberg et al., 2009). It is proposed that the Pao is made of two components (Fig. 1): 1) the
time-varying reservoir pressure (or windkessel pressure, Pwk),
solely a function of time; and 2) the excess pressure (Pex),
which varies with time and distance along the arterial tree: ) , ( ) ( ) , (xt P t P xt Pao = wk + ex (1)
An ODE describing the windkessel pressure is derived considering a mass balance across the aortic:
C t Q t Q dt t dPwk( ) in()− out() = (2)
where Qin and Qout are the flows in and out of the aorta and C
represents the compliance of the whole arterial tree. Describing Qout using Ohm’s law gives:
R P t P Qout wk ∞ − = () (3)
In Equation 3, R is the resistance of the peripheral circulation and P∞ is the asymptotic pressure approached during decay in
diastole. Substituting this definition of Qout into (1) gives:
C t Q RC P t P dt t dPwk( ) wk() in( ) = − + ∞ (4)
with the general solution defined:
∫
− − ∞ ∞ = − + − t t t in t t wk e dt C t Q e e P P P t P 0 ' ) ' ( ) ( ) ( ' 0 τ τ τ (5)In Equation (5), t0 and P0 represent the time and pressure at
the start of ejection and τ = RC, the time decay constant. Note that during diastole Qin = 0, as it is assumed there is no
in-flow during diastole.
In this paper, the reflected or backwards travelling waves in the aorta are assumed to be negligible. Hence, Qin is assumed
to be linearly proportional to Pex, as indicated by the work of
(Wang et al., 2003):
prox in
ex xt Q t R
P ( , )= ( ) (6)
where Rprox represents the proximal resistance of the aorta.
The substitution of (5) and (6) into (1) then gives:
∫
+ + − + = − − ∞ ∞ t t prox in t in t t ao R t Q dt e C t Q e e P P P t P 0 ) ( ' ) ' ( ) ( ) ( ' 0 τ τ τ (7)Equation (7) is now analogous to a 3-element windkessel model, where the added resistance, Rprox, represents the flow
resistance of the large arteries.
0 0.1 0.2 0.3 0.4 0.5 0.6 0.7 75 80 85 90 95 100 105 110 115 P re s s u re ( m m H g ) Time (s)
P
wkP
exFig. 1. Example of aortic pressure separated into reservoir pressure (Pwk) and excess pressure (Pex) in a healthy subject.
2.3 Model identification
The measurements used in this study to identify the arterial model were the Pao waveform and SV. To personalise (7) to
each subject the parameters τ, C, Rprox, and P∞ must be
identified, along with the Qin waveform.
Initially, Qin was estimated by drawing a line, across the
aortic pressure pulse, from the start of ejection to the first diastolic point. The diastolic point was assumed to be the point of the maximum negative gradient between the aortic notch and maximum pressure in the measured Pao. The
difference between this line and the aortic pressure was used to approximate Pex. To approximate Qin, Pex was scaled to
have an area equal to SV, as Qin is assumed to be linearly
proportional to Pex. The model was then fitted using this
estimate of Qin and initial approximations for τ, R, C, Rprox,
and P∞. Firstly, the non-linear optimisation routine
‘fminsearch’ in Matlab was used to identify τ and P∞ for an
exponential fitted to the diastolic decay of Pao. During fitting
a greater weighting was applied to the minimisation of error in the last 2/3 of diastole as it is believed that wave effects are minimal at this time (Wang et al., 2003). R was derived from (3) where the average of Qout was assumed to be equal to SV
divided by the period of one heartbeat. C could then be calculated, as C = τ/R, meaning Pwk could be simulated using
(5). The difference between Pao and Pwk was used to calculate
Rprox by finding scaling factor which made the area of Pex
(Pao-Pwk) equal to SV. Equation (6) was then used to calculate
a new Qin. This whole process was repeated to calculate new
approximations for τ, R, C, Rprox, and P∞, until the
2.4 Data analysis
Hemodynamic measurements are presented as mean +/- standard error of the mean (SEM). A paired sample t-test was used to check temporal variance over T0 - T60 to analyse the effect of the endotoxin intervention. P<0.05 was considered statistically significant result. Windkessel models were fitted to 36 sets of measurements from the 4 pigs, over all time points.
Hydraulic work (Wao) was calculated for each measurement
by summing the work of the reservoir and excess pressure components of the aortic model (Wao = Wwk +Wex). Where,
Wex and Wwk are evaluated from the start of ejection (t0) to the
end of systole (tes). Left ventricular work (Wlv) was calculated
from the area enclosed by the measured P-V loop. Wao and
Wlv are calculated:
∫
∫
+
−
=
+
=
es es t t in ex t t out in wk ex wk aodt
t
Q
t
P
dt
t
Q
t
Q
t
P
W
W
W
0 0'
)
(
)
(
'
)]
(
)
(
)[
(
(8)∫
=
V V lv lvP
t
dv
W
0'
)
(
(9)The ratio of the Wex to the Wwk was analysed and compared to
clinical gold standard ventricular arterial coupling metric,
Ees/Ea, calculated from ventricular P-V loop analysis, as
shown in Fig. 2. End systolic elastance (Ees) is defined as the
gradient of the linear least squares fit to the end systolic points in a series of descending P-V loops, representing the left ventricular contractility. Left ventricular afterload (Ea) is
the gradient of the line from the origin in Fig. 2 to the end systolic point of the first P-V loop, recorded before vena cava occlusion, a highly invasive manoeuvre.
140 120 100 80 60 40 20 0 0 50 100 150 E es E a Relative volume (ml) P re s s u re ( m m H g )
Fig. 2. Example of left ventricular pressure-volume loop analysis, used to calculate the end systolic elastance (Ees) and
afterload (Ea), during a vena cava occlusion manoeuvre.
3. RESULTS
The windkessel model was fitted to the 36 sets of measurements from the 4 pigs. In this study, each animal acts as their own control with baseline (T0) measurements reflecting the undiseased state of the pig. Statistically significant temporal changes (P<0.005) were noticed in the measured mean arterial pressure (MAP), left ventricular end diastolic volume (LVEDV), heart rate (HR), and maximum left ventricular pressure (Plv,max) over T0-T60, underlining the
pathological changes occurring in the animals due to the endotoxin infusion. A summary of the main hemodynamic measurements is seen in Fig. 3.
000 030 060 090 120 150 180 210 240 0 50 100 M A P (m m H g )
*
000 030 060 090 120 150 180 210 240 0 50 100 L V E D V (m l)*
000 030 060 090 120 150 180 210 240 0 20 40 S V (m l) 000 030 060 090 120 150 180 210 240 0 50 100 150 H R (B e a ts /m in )*
000 030 060 090 120 150 180 210 240 0 50 100 Plv ,m a x (m m H g ) Time (min)*
Fig. 3. Evolution of mean arterial pressure (MAP), left ventricular end diastolic volume (LVEDV), stroke volume (SV), heart rate (HR), and maximum left ventricular pressure (Plv,max) measurements during the trials. * indicates P<0.05
for expected temporal changes over T0-T60 due to the induction of septic shock. Data presented as mean +/- SEM.
3.1 Comparison of ventricular and arterial work
To verify the aortic model, the hydraulic energy of the aortic flow (Wao), calculated from model, was compared to the
measured left ventricular work (Wlv). The comparison
between the hydraulic work and the measured P-V loops, is shown in Fig. 4. Wao matched Wlv to a bias and 2 standard
deviations of -0.15 J +/- 0.13 J (as seen on Fig. 4.), and with a correlation coefficient of R2 = 0.88. These results indicate that Wao underestimates ventricular work, but, more
importantly, closely follows the changes in P-V area that occur during the trials.
0 0.2 0.4 0.6 0.8 1 0 0.1 0.2 0.3 0.4 0.5 0.6 0.7 0.8 0.9 1 Wa o ( J) Wlv (J) Y = 0.64X - 0.01 R2 = 0.88 N = 36 0 0.1 0.2 0.3 0.4 0.5 0.6 0.7 0.8 -0.35 -0.3 -0.25 -0.2 -0.15 -0.1 -0.05 0 ( Wao + Wlv ) / 2 (J) Wa o W lv ( J)
Fig. 4. Regression (top panel) and Bland-Altman (bottom panel) analysis comparing work derived from the aortic model (Wao) with the work calculated from the area of the
measured P-V loops (Wlv).
3.2 Effects of septic shock on aortic energetics and volume
The effects of septic shock on the aortic model were analysed by tracking the changes in Wao, Wex, and Wwk, throughout the
duration of the experimental study. In this analysis, Wex can
be interpreted as the work required to overcome the resistance of the large arteries, whereas Wwk reflects the
maximum potential energy stored in the arterial reservoir due to elastic distension. The change in magnitudes of Wao, Wwk,
and Wex (averaged across the 4 pigs) at 30 minute intervals
during the experimental study are shown in Fig. 5. Initially, at T0, Wwk makes up the majority of Wao. However, after the
endotoxin infusion, the magnitude of the Wwk decreases, and
Wex increases to a point where they are approximately equal
by the end of the experiment.
A decrease in Wwk indicates that a smaller proportion of the
SV is being stored in the arterial system, due to distension elastic arteries, for release during diastole. Fig. 6 reinforces
this point, showing the percentage of SV stored in the arterial reservoir, averaged across the 4 pigs. This ratio drops from a baseline level of 59.2% to 48.6% by the end of the study.
0 30 60 90 120 150 180 210 240 0 0.05 0.1 0.15 0.2 0.25 0.3 0.35 Time (min) W o rk ( m J ) Wao Wwk Wex
Fig. 5. Change in the total aortic work (Wao) and its
components windkessel work (Wwk) and excess work (Wex)
over the duration of the study, averaged over the 4 pigs.
0 30 60 90 120 150 180 210 240 0 10 20 30 40 50 60 70 80 Time (min) d Vw k / S V ( % )
Fig. 6. Change in the volume stored in the arterial reservoir per heartbeat (dVwk) as a percentage of stroke volume (SV).
Data presented as mean +/- SEM.
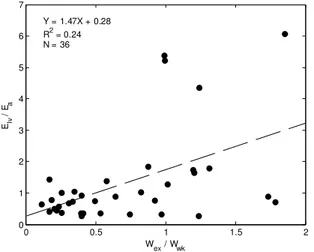
3.3 Estimation of ventricular arterial coupling
It was hypothesised that the ratio of Wex to Wwk may be an
indicator of ventricular arterial coupling, given that Wex is a
function of the flow energy ejected from the ventricle, and
Wwk represents the work required to distend the arterial
volume. Hence, Wex/Wwk was compared to Ees/Ea to check this
claim, as shown in Fig 7. Analysis of Fig. 7 showed a very weak relationship between these indices, with correlation of R2 = 0.24, indicating they are not directly related, and proving our initial hypothesis wrong.
On further analysis, it was noticed that Wex is strongly related
to the inverse of Ea (R
2
= 0.76), as seen in Fig. 8 However, changes Wex or Wwk, or any combination of these two indices,
were not reflective of changes in left ventricular contractility (Ees). Hence, demonstrating that the energetics of the aortic
left ventricular afterload and not changes in left ventricular contractility. 0 0.5 1 1.5 2 0 1 2 3 4 5 6 7 Wex / Wwk Elv / Ea Y = 1.47X + 0.28 R2 = 0.24 N = 36
Fig. 7. Comparison of pressure-volume loop derived ventricular vascular coupling (Ees/Ea) with the ratio of excess
work to windkessel work (Wex/Wwk) derived from the aortic
model. 0 0.05 0.1 0.15 0.2 0.25 0 0.2 0.4 0.6 0.8 1 1.2 Wex (J) 1 / Ea ( m l/ m m H g ) Y = 3.57X + 0.13 R2 = 0.76 N = 36
Fig. 8. Comparison of the inverse of afterload (1/Ea)
calculated from pressure-volume loop analysis with excess work (Wex) derived from the aortic model.
4. DISCUSSION
A model of aortic blood flow, based on the works of (Davies et al., 2010, Tyberg et al., 2009, Wang et al., 2003), was identified from measurements from and experimental animal study on septic shock. Aortic models were fitted using only measurements of the aortic pressure waveform and SV, removing the reliance on knowing Qin, which can be highly
invasive or difficult to measure clinically. In this study, the models were successfully fitted to 36 sets of these measurements and the energetics of these models were analysed.
The modelled derived Wao, representing the total hydraulic
work of flow in the aorta, tracked changes in the measured
Wlv well with R2 =0.88, although Wao underestimated Wlv on
average by -0.13J. The bias in Wao was probably a result of
the extra work required by the ventricle to push the flow through the aortic valve, which is not accounted for in the
aortic model. Fisher and Wheatly (1988) recorded an energy loss of around 0.16-0.33J for flow through bio-prosthetic porcine aortic valves using SV between 60-80mls. Indicating that a bias of -0.13J, given that measured SVs in this study are around half those used in (Fisher and Wheatley, 1988), is a reasonable approximation for aortic valve energy loss. This result verifies the accuracy of the fitted models.
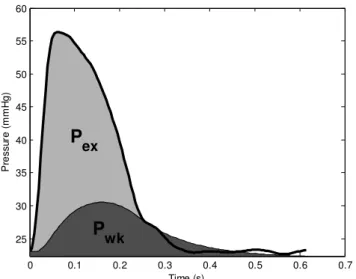
The identified aortic models also appeared capable of capturing the effects septic shock on the pig’s hemodynamics. As the state of the pigs worsened, due to the inflammatory effects of the endotoxin, modelled systemic resistance decreased substantially and arterial compliance increased, as seen in Fig. 9. The drop in resistance was generally larger than the increase in compliance causing the decay constant, τ, to decrease as τ= RC. The combination of these factors caused the aortic reservoir to charge and discharge quicker than it would have done for a healthy subject. The volume in the arterial reservoir could not accumulate faster than it was discharging, resulting in a flattening in the Pwk component of the aortic pressure. Hence,
in the subjects with a low decay constant when normalised by heartbeat (τ /T), the shape of the aortic pressure begins to look similar to the shape of Qin, as seen in Fig. 10, with a
noticeable flattening of the diastolic pressure observed when compared to Fig. 1. This effect is responsible for the relative decrease in the proportion of Wwk compared to Wao and Wex
that occurs during the study, as shown in Fig. 5. These factors could explain why left ventricular afterload (Ea) decreases
during septic shock as arterial pressure can never build up during the heartbeat because less energy and volume are stored in the arterial reservoir.
0 30 60 90 120 150 180 210 240 0 1 2 3 4 R ( m m H g .s /m l) 0 30 60 90 120 150 180 210 240 0 1 2 3 4 C ( m l/ m m H g ) 0 30 60 90 120 150 180 210 240 0 0.5 1 1.5 2 2.5 τ / T Time (min)
Fig. 9. Change in systemic resistance, R (top panel), aortic compliance, C (middle panel), and ratio of the decay constant to heartbeat period, τ / T (bottom panel) during the trials. Data presented as mean +/- SEM.
0 0.1 0.2 0.3 0.4 0.5 0.6 0.7 25 30 35 40 45 50 55 60 P re s s u re ( m m H g ) Time (s)
P
wkP
exFig. 10. Example of aortic pressure, separated into reservoir pressure (Pwk) and excess pressure (Pex) components, 180
minutes (T210) after endotoxin infusion.
The ratio of Wex/Wwk did not relate well to Ees/Ea as seen in
Fig. 7. However, Wex by itself could be a useful metric for
describing acute changes in afterload (Ea) due to septic shock
as indicated by the strong correlation shown in Fig. 8. The main, and most controversial, assumption made during the fitting process is that Pex is proportional to Qin, and hence,
the two can be represented by a purely resistive relationship (Pex = RproxQin). This assumption is based on the work of
(Wang et al., 2003), which shows that the magnitudes of backwards travelling waves in the aorta are minimal. The authors feel justified in using this assumption in this study for two reasons: 1) the model was only fitted to central aortic pressure measurements, where backwards travelling waves are small during systole (Aguado-Sierra et al., 2008), due to the central aorta’s distance from major reflection sites; and 2) in sepsis vascular tone decreases, reducing the production of reflective waves (O'Rourke and Yaginuma, 1984). However, the authors realise the assumption may not be valid in subjects with high arterial stiffness, such as with hypertensive subjects.
5. CONCLUSIONS
This analysis of SV and morphological features of the aortic pressure waveform suggests that one of main reasons left ventricular afterload decreases during septic shock is because arterial reservoir loses its ability to store hydraulic energy in the form of stressed volume during systole. However, a larger more comprehensive study is required to validate the method and results of this paper.
REFERENCES
Aguado-Sierra, J., Davies, J. E., Hadjiloizou, N., Francis, D., Mayet, J., Hughes, A. D. & Parker, K. H. (2008) Reservoir-wave separation and wave intensity analysis applied to carotid arteries: a hybrid 1D model to understand haemodynamics. Conference
proceedings, 2008, 1381-4.
Davies, J. E., Baksi, J., Francis, D. P., Hadjiloizou, N., Whinnett, Z. I., Manisty, C. H., Aguado-Sierra, J., Foale, R. A., Malik, I. S., Tyberg, J. V., Parker, K. H., Mayet, J. & Hughes, A. D. (2010) The arterial reservoir pressure increases with aging and is the major determinant of the aortic augmentation index.
Am J Physiol Heart Circ Physiol, 298, H580-6. Fisher, J. & Wheatley, D. J. (1988) Hydrodynamic function
of ten prosthetic heart valves in the aortic position.
Clin Phys Physiol Meas, 9, 307-17.
Lambermont, B., Delanaye, P., Dogne, J. M., Ghuysen, A., Janssen, N., Dubois, B., Desaive, T., Kolh, P., D'Orio, V. & Krzesinski, J. M. (2006) Large-pore membrane hemofiltration increases cytokine clearance and improves right ventricular-vascular coupling during endotoxic shock in pigs. Artificial
organs, 30, 560-564.
Mutoh, T., Kazumata, K., Ajiki, M., Ushikoshi, S. & Terasaka, S. (2007) Goal-directed fluid management by bedside transpulmonary hemodynamic monitoring after subarachnoid hemorrhage. Stroke;
a journal of cerebral circulation, 38, 3218-24. O'Rourke, M. F. & Yaginuma, T. (1984) Wave reflections
and the arterial pulse. Archives of internal medicine, 144, 366-71.
Pinsky, M. R. (2003) Rationale for cardiovascular monitoring. Current opinion in critical care, 9, 222-4.
Pinsky, M. R. (2007) Hemodynamic evaluation and monitoring in the ICU. Chest, 132, 2020-9.
Tyberg, J. V., Davies, J. E., Wang, Z., Whitelaw, W. A., Flewitt, J. A., Shrive, N. G., Francis, D. P., Hughes, A. D., Parker, K. H. & Wang, J. J. (2009) Wave intensity analysis and the development of the reservoir-wave approach. Medical & biological
engineering & computing, 47, 221-32.
Wang, J. J., O'Brien, A. B., Shrive, N. G., Parker, K. H. & Tyberg, J. V. (2003) Time-domain representation of ventricular-arterial coupling as a windkessel and wave system. Am J Physiol Heart Circ Physiol, 284, H1358-68.