USE OF X-RAY MICROTOMOGRAPHY TO FOLLOW THE CONVECTIVE HEAT DRYING OF WASTEWATER SLUDGES
A. Leonard, S. Blacher, P. Marchot and M. Crine
Laboratory of Chemical Engineering University of Liège
4000 Liège, Belgium
ABSTRACT
X-ray microtomography is proposed as a new tool to investigate the evolution of size, shape and texture of soft materials during a drying operation. This study is focused on the drying of mechanically dewatered sludges from a secondary wastewater treatment. The shrinkage phenomenon is shown to play a crucial role in the control of the drying process. The shrinkage curves are determined by analysing the shape and size of cross sectional
microtomographic images of sludge extrudates at different levels of drying. The observation of drying and shrinkage curves allows us to determine 3 critical water content values, which define different drying zones where extragranular, intragranular or mixed limitations prevail. When drying is externally controlled, the decrease of the drying rate observed during
experiments can be related to the reduction of the external area of the sample, i.e., to shrinkage. When drying is internally controlled, resistances inside the solid govern the process. Between these two extreme situations, the drying rate reduction is the result of both the external area decrease and the development of internal resistances limiting drying. A
multizone model is proposed to describe quantitatively these observations. The analysis of the internal texture of the sludge extrudates reveals crack formation at the end of the drying process. The onset of crack formation is clearly related to the appearance of internal transfer limitations, i.e., humidity and temperature gradients inside the material.
INTRODUCTION
The production of sludge from wastewater treatment plants has been continuously increasing for several years. It is expected to double in EU during the next ten years (1). Because of the future ban on landfilling of organic wastes, two major options will remain for sludge disposal, after mechanical dewatering : incineration and landspreading. In both cases, drying is and will remain a critical and necessary pretreatment. It can indeed reduce the water content below 5 % D.S. This obviously reduces the mass and volume of waste and, consequently, the cost for storage, handling and transport. The removal of water to such a low level increases drastically the lower calorific value, transforming the sludge into an acceptable combustible.
Furthermore, the dried sludge is a pathogen free, stabilized material because of the high temperature treatment.
Drying is a highly energy consuming thermal treatment. It strongly affects the final quality of the dried material. The choice of adequate operating conditions is thus crucial. Despite the industrial and economic importance of such process, rather few works have been carried out in order to get a better understanding of the key – rate controlling – mechanisms. The main practical consequence is that the drying behaviour of a sludge is still difficult to predict (2,3).
Mechanically dewatered sludge from wastewater treatment is a soft, pasty, strongly
deformable material which undergoes shrinkage during thermal treatment. Shrinkage is a key phenomenon which controls both the drying rate, the final texture and mechanical properties of the dried material. Shrinkage has thus to be accounted for and quantitatively described in any attempt to develop relevant drying models (4). Up to now curves have been mainly determined manually (using calliper or density measurements by pycnometry) leading to global and rather inaccurate results. In this paper, we propose to use X-ray microtomography to monitor the evolution of the volume, the external surface and the texture of a sludge sample during a drying treatment. X-ray microtomography is a powerful non-intrusive visualization technique. Several applications have already been reported in the literature to characterize dimensions, shape and morphology of small size materials (5,6). This technique is relatively new in the field of chemical engineering (7).
EXPERIMENTAL METHOD
The convective heat drying of sludge extrudates is considered in this paper. The sludge is collected in a domestic WWTP of 9000 E.I., after secondary settling, thickening and belt filter dewatering. Sludge samples (~ 20 % D.S.) are extruded at a constant speed of 8 mm/s through circular dies of 10 to 18 mm diam. (limited at 12 mm in this study) like in some industrial belt dryers. Cylindrical samples are cut at a height of 15 mm, yielding extrudates with volume and mass of approximately 1.7 cm3 and 2 g, respectively.
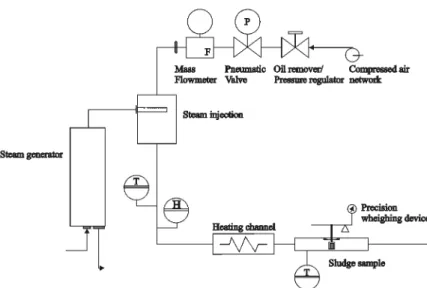
Drying experiments are carried out in a micro-drier specially designed for handling small individual samples with mass ranging between 0.5 and 5 g. The micro-drier unit is described in Figure 1. It is composed of two parts: the air conditioning and feeding system and the
drying chamber. Air is fed from the laboratory compressed air network. A pneumatic valve connected to a mass flowmeter controls its flowrate. Air can be humidified by adding steam generated by a steam generator, heated up to the required temperature by passing through a heating channel and then directed to the drying chamber. Air humidity, temperature and flowrate are continuously monitored and controlled. The sludge extrudate lies in the drying chamber on a supporting grid linked underneath to a precision weighing device (BP 150 from Sartorius, Germany; accuracy : 0,001 g). The sample surroundings are such that drying can occur on the whole external surface. The weighing device is connected to a PC that records the mass every five seconds.
Figure 1 : Micro-drier set-up
The micro-drier can be operated at temperatures ranging between 20 and 180 °C. The air flowrate ranges between 30 and 300 Nl/min (i.e. air superficial velocities in the drying chamber between 0.3 and 5 m/s). The maximum steam production at the highest air flowrate (300 Nl/min) achieves an absolute humidity content of about 0.2 kg / kg dry air).
Corresponding air relative humidity depends on selected operating temperature and flowrate. The results reported in this paper have been obtained at a constant temperature of 125 °C, with air at ambient humidity without any vapour addition (absolute humidity ~ 0.006 kg/kg
dry air) and flowrates between 50 and 80 Nl/min (superficial velocities between 0.64 and 1.03 m/s).
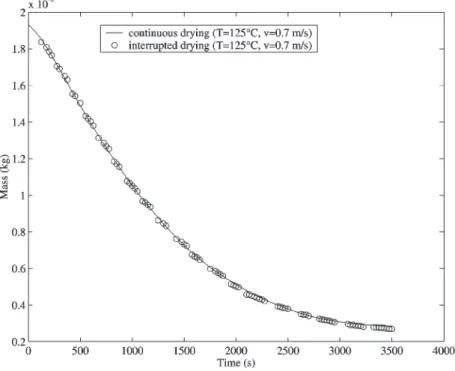
A drying assay is monitored by continuously weighing the sample during approximately one hour. One run is characterised by a curve representing the sample weight vs. time, as
illustrated in Figure 2 (continuous line). In order to follow simultaneously the shrinkage phenomenon, it is necessary to stop drying and to remove the sample from the drying chamber at different time intervals. The sample is placed for a while (approximately 2 minutes) in the X-ray microtomographic device in order to get images of several cross-sections. It is then replaced in the micro-drier. The same sequence is repeated about 15 times during one drying run. Figure 2 compares drying evolutions without (continuous line :
continuous drying) and with (circles : interrupted drying) interruptions due to the repeated removals for tomographic scanning. There are definitely no significant differences between continuous and interrupted drying curves.
The X-ray tomographic device used in this study is a "Skyscan-1074 X-ray scanner" (Skyscan, Belgium). The X-ray source operates at 40 kV and 1 mA. The detector is a 2D, 768x576 pixels, 8-bit X-ray camera with a spatial resolution of 41 µm. The sample can be either rotated in a horizontal plane or moved vertically in order to get scans at different vertical positions. The minimum vertical distance between two scans equals 41 µm.
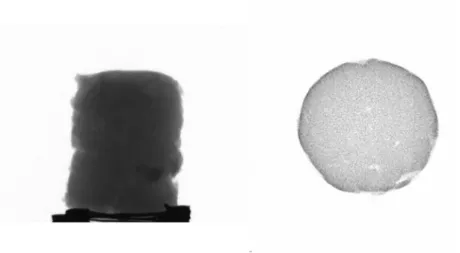
Once the sample is placed in the microtomograph, four projections are recorded in order to determine the height of the sample. A zone covering approximately a height of 1 cm is selected for tomographic investigation : around 20 transversal sections separated by 0.41 mm (multiple of the minimum distance, 41 µm) are then recorded. Figure 3 shows, from the left to the right, a projection and a cross-section of a sludge extrudate, before drying, obtained with the microtomograph.
Figure 3 : Examples of a projection and a transversal section of a sludge extrudate. Approx. diam =12 mm, approx. height = 15 mm.
IMAGE ANALYSIS
Basic tools of mathematical morphology (8) are used to transform each set of X-ray
which perimeter and area can be calculated. Figure 4 presents the main operations applied to the cross sectional images. The initial image, Figure 4a, is normalised into 256 grey levels. A gradient transformation is then applied to contrast the border, Figure 4b. A binary image is then obtained by thresholding, Figure 4c. This latter is filtered by opening transformation in order to erase all pixels but the border area, Figure 4d. The final image is directly obtained by hole-filling if the border is closed, Figure 4h. Otherwise, the border is closed by a set of dilations, Figure 4e. The original border is recovered by skeletonisation, Figure 4f, followed by pruning, Figure 4g. Finally hole-filling is applied to get the final image, Figure 4h. All these operations are applied automatically to each image using the image analysis software Visilog 5.0 (Noesis, France). Once Figure 4h is obtained, the perimeter, the area and an equivalent diameter can be easily calculated. The mean height of the sample is obtained after binarisation of the projected images of the sample (see the left handside of Figure 3).
Figure 4 : Morphological transformations applied to an X-ray reconstructed image a : original image; b : gradient transformation; c : thresholding; d : opening transformation; e :
dilations ; f: skeletonisation; g : pruning ; h : hole filling : final image.
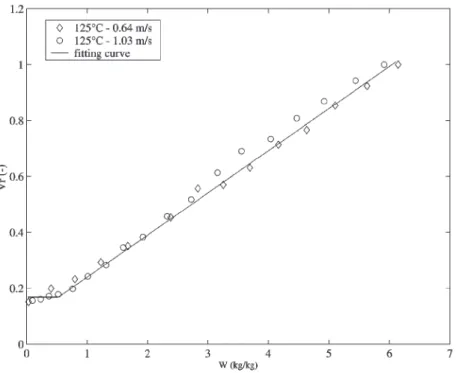
The mean height and the area of the different cross sections are used to calculate the sample volume at different time intervals from which a shrinkage curve can be determined. An
example of shrinkage curve is illustrated in Figure 5. It consists in plotting the relative volume Vr (-) versus the water content of the sample, expressed on a dry basis, W (kg water / kg
solid). Vr represents the ratio between the sample volume at a given time during drying and its
initial value. Figure 5 shows the shrinkage is almost a linear function of the residual water content W down to a critical threshold (0.4 – 0.5 kg/kg), for two sets of air velocities (0.64 and 1.03 m/s). The volumetric shrinkage is quite important, with a maximum volume
reduction of approximately 80 %. Such a large volume reduction indicates shrinkage plays an important role in the control of the drying process.
Figure 5 : Relative extrudate volume versus the residual water content Figure 6 shows the height and diameter evolutions versus the water content W are very
easy to calculate the external surface (A, m2) of the extrudate. This area is composed of the two quasi-circular bases of the sludge sample to which the lateral area is added. The diameter used is an equivalent diameter calculated from the cross sections images.
Figure 6 : Relative equivalent diameter and height evolutions versus the residual water content
MODELLING
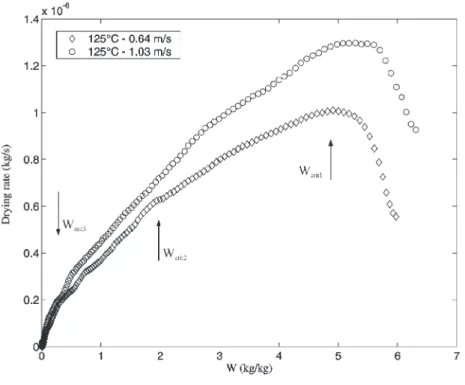
Classically, the drying behaviour of a material is characterised by its drying curve, i.e., the drying rate (N, kg/s) versus the residual water content (W, kg/kg). An example of such a curve is illustrated in Figure 7 for one drying temperature (125 °C) and two air flowrates (80 and 150 Nl/min, i.e., 0.64 and 1.03 m/s). The air flowrate has a significant influence on the drying rate till a very low residual water content (W ~ 0.4 kg/kg). This indicates the drying kinetics is significantly controlled by external mass and/or heat transfer limitations (9). Furthermore, the drying curves are convex upwards, which has been mentioned many years ago by Sherwood (10) as an indication of external transfer limitations.
Figure 7 : Drying curves
When external kinetic limitations are predominant, the mass flux (F, kg/m²s) can be expressed as the product of a mass transfer coefficient (k, m/s) and a driving potential as represented by Equation (1). The driving potential corresponds to the difference between air humidities prevailing in the bulk of the drying agent (Y∞, kg / kg) and at the air-solid interface (Yi, kg/
kg). ρ is the density of humid air (kg / m³). The drying rate N is obtained by multiplying the mass flux F by the external surface A of the sludge extrudate.
(
− ∞)
ρ =k. .Y Y F i (1)(
− ∞)
ρ = =F.A k.A. .Y Y N i (2)The evolution of N is governed by two parameters: the external surface A depending on shrinkage and the air humidity Yi prevailing at the solid interface depending on internal
transfer limitations. These two influences are strongly coupled because both parameters decrease as drying develops. X-ray microtomography and the image analysis tools described
above provide an independent way to determine accurately the external surface A and its influence on the evolution of the drying kinetics. This constitutes a really new tool which can provide relevant information on the complex coupling between drying and shrinkage.
A drying curve as illustrated in Figure 7 can be decomposed into three parts (11,12):
- a preheating zone, during which the solid temperature and the drying rate increase and reach progressively their maximum value;
- a more or less narrow plateau, during which the solid temperature and the drying rate remain at their maximum;
- a decreasing rate zone, during which drying proceeds up to completion.
The two first parts of the curve can hardly be separated. We will focus on the third part of the curve where shrinkage and internal transfer limitations can occur. This third part is delimited by a first threshold Wcrit1. The analysis is based on a multi-zones model, already proposed in
previous papers (13,14). Three drying zones are considered below Wcrit1 (see Figure 7).
First Decreasing Rate Zone (Wcrit2 < W < Wcrit1)
The threshold Wcrit1 equals approximately 5 kg/kg. At this level, we assume that the air
temperature and humidity at the solid surface (Ti, Yi) are those corresponding to the end of the
plateau zone, i.e. the wet-bulb conditions (purely convective drying) : Ti = Tw and Yi =
Ysat(Tw) where Ysat(Tw) represents the humidity of air saturated with water at the wet-bulb
temperature Tw. Equation (1) and (2) becomes :
(
− ∞)
ρ =
=F k. . Y (T ) Y
(
− ∞)
ρ =
=N k.A(W ). . Y (T ) Y N c crit1 sat w (4)
The maximum mass flux and drying rate are called Fc and Nc, respectively. Both increase with
the air superficial velocity (see Figure 8), as the mass transfer coefficient has to do. Below Wcrit1 (and above Wcrit2), the wet-bulb conditions are assumed still prevail so that the driving
force for mass transfer remains constant. The external solid surface starts decreasing due to the influence of shrinkage. The mass flux F remains constant and equals Fc and the drying rate
N decreases proportionally to the external surface A(W) as expressed in Equation (5).
(
− ∞)
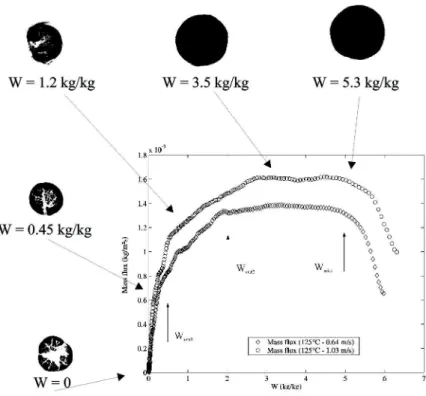
ρ = = k.A(W). .Y (T ) Y ) A(W A(W) . N N sat w crit1 c (5)Figure 8 shows that the mass flux F remains actually almost constant, for one drying temperature (125°C) and two air superficial velocities (0.64 and 1.03 m/s).
Figure 8 : Calculated mass flux evolution during drying Second Decreasing Rate Zone (Wcrit3 < W < Wcrit2 )
The threshold Wcrit2 corresponds to a residual water content of approximately 2 kg/kg. Below
this threshold, the mass flux F is not constant anymore as illustrated in Figure 8. This implies the driving force (Yi - Y∞) starts to decrease. The air humidity Yi at air-solid interface
decreases accordingly, due to internal heat and/or mass transfer limitations. The solid shrinkage still affects the external surface A(W). The drying rate N evolution is thus represented by the combined effect of shrinkage and internal transfer limitations, Equation (6).
(
− ∞)
ρ
=k.A(W). .Y) Y
N i (6)
The increasing importance of internal transfer limitations is also confirmed by Figure 7 : the influence of the superficial velocity (between 0.64 and 1.03 m/s) decreases progressively when reaching the third critical water content Wcrit3.
Third Decreasing Rate Zone (W < Wcrit3)
Below a third critical water content Wcrit3 ( ~ 0.4 kg/kg) shrinkage does not occur anymore
(see Figure 5). There is no longer any influence of the superficial air velocity on the drying rate as observed previously. The further decrease of the drying rate is thus caused by pure mass and/or heat internal resistances.
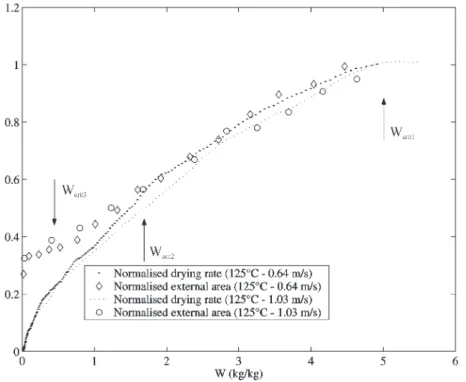
Figure 9 represents the evolutions of the drying rate and the external surface divided by their value at W = Wcrit1. This figure provides a clear evaluation of the role played by shrinkage
and internal transfer limitations. Above Wcrit2,the evolutions of the drying rate and the
external surface are almost identical. This means the shrinkage phenomenon alone has to be accounted for to describe the decrease of the drying rate. Below Wcrit2, a gap between both
limitations. In this case the shrinkage phenomenon is not sufficient anymore to explain the drying rate decrease. Below Wcrit3, the sample size reduction is stopped (see Figure 5). There
is no shrinkage and internal transfer limitations are the only phenomena controlling drying.
Figure 9 : Evolution of relative external area and relative drying rate versus the residual water content
CRACKS ANALYSIS
In the previous part of this paper, X-ray tomographic images were used to determine the external perimeter of the sampled cross sections, from which the external surface of the extrudate was calculated. These cross section images can also be used to analyse and follow the evolution of the internal texture during drying. Some binarised images are illustrated in figure 10 at different drying levels. Above the threshold Wcrit2, the internal texture remains
unchanged, i.e., homogeneous (see images corresponding to W equal to 5.3 and 3.5 kg/kg, respectively). The only visible change is the size reduction of the cross sections. Below Wcrit2,
some cracks appear and their importance increases as drying approaches completion (see images corresponding to W equal to 1.2, 0.45 and 0 kg/kg, respectively). It is thus clear that
crack formation is directly associated to the development of internal transfer limitations. As long as there are no significant internal transfer limitations (i.e. W > Wcrit2), humidity and
temperature profiles inside the extrudate remain quite flat. But, when the internal transfer resistances develop, the mechanical stress induced by temperature and humidity distributions exceeds the maximum breakage resistance of the material and cracks progressively develop.
Figure 10 : Cracks formation related to sample water content
CONCLUDING REMARKS
X-ray microtomography is an innovative technique to follow the evolution of size, shape and texture of soft materials during a drying operation. The calculation of the external surface of a sample submitted to drying is based on the analysis of several cross sectional images. It allows the accurate determination of the shrinkage curve. This information coupled with
drying kinetic data provide a better understanding of the mechanisms governing drying of wastewater sludges. A multizone drying model has been developed and partially validated using these data. It describes correctly the combined influence of shrinkage and internal transfer limitations. The analysis of the internal texture of the dried samples reveals crack formation at the end of the drying process. The onset of crack formation is clearly related to the appearance of internal transfer limitations, i.e., humidity and temperature gradients inside the material. Further work has to be done to describe quantitatively this phenomenon in terms of images analysis.
AKNOWLEDGEMENTS
A.Leonard is grateful to the FNRS (National Fund for Scientific Research, Belgium) for an ‘Aspirant’ position.
NOMENCLATURE
A external exchange area (m²)
F drying flux (kg / m² s)
k mass transfer coefficient (m / s)
N drying rate (kg / s)
Nc constant drying rate at the plateau (kg / s)
Tw wet-bulb temperature (°C)
Vr relative volume (-)
W solid water content (kg water / kg dry solid)
Yi air humidity at the air-solid interface (kg water / kg dry air)
Ysat saturation air humidity (kg water / kg dry air)
Y∞ air humidity in the bulk of drying agent (kg water / kg dry air)
ρ humid air density (kg / m³)
REFERENCES
OTV. La question des boues. In Traiter et valoriser les boues, Infinités Communication : Rennemoulin, 1997 ; 21-56.
Bongiovanni, J.M. Traitement des boues résiduaires par l'association en série d'une
déshydratation mécanique et d'un séchage thermique, PhD Thesis, Université de Pau et des pays de l'Adour, Pau, 1998.
Ferrasse, J.H. Développement d'outils expérimentaux pour le dimensionnement de procédés de séchage conductif avec agitation : Application à des boues de stations d'épuration urbaines. PhD Thesis, Université Paul Sabatier de Toulouse III, Toulouse, 2000.
Hernandez, J.A, Pavon, G., Garcia, M.A. Analytical solution of mass transfer equation considering shrinkage for food-drying kinetics. Journal of Food Engineering 2000, 45, 1-10. Sassov, A., Buelens, E. Micro-CT for polymers and composite materials. In Functional
Materials, K.Grassie and al., Eds.; EUROMAT, 2000; Vol.13, 374-377.
Sassov, A., Cornelis, E., Van Dyck, D. Non destructive 3-D Investigation of Metal Foam Microstructure. Materialwissenschaft und Werkstofftechnik 2000, 31 (6), 571-573.
Lin, C.L., Miller, J.D. Network Analysis of Filter Cake Pore Structure by High Resolution X-ray Microtomography. Proceedings of the First World Congress on Industrial Process
Serra, J. Image analysis and mathematical morphology; Academic Press : New York, 1982; Vol 1.
Coumans, W.J. Models for drying kinetics based on curves of slabs. Chemical Engineering and Processing 2000, 39, 53-68.
Sherwood, T.K. The Air Drying of Solids. Transactions of the American Institute of Chemical Engineers 1936, 32, 150-168.
Mujumdar, A.S. Handbook of Industrial Drying (Second edition revised and expanded), Marcel Dekker, Inc. : New York, 1995.
Nadeau, J.P., Puigalli, J.R. Séchage, des processus physiques aux procédés industriels. Technique et Documentation – Lavoisier : Paris, 1995.
Leonard, A., Salmon, T., Janssens, O., Crine, M. Kinetics modelling of convective heat drying of wastewater treatment sludge. In Récents Progrès en Génie des Procédés; Lavoisier Technique et Documentation : Paris, 1999; Vol. 13, 129-136.
Leonard, A., Crine, M. Relation between convective drying kinetics and shrinkage of wastewater treatment sludges. Proceedings of the 12th International Drying Symposium, Noordwijkerhout, The Netherlands, Aug 28-31, 2000; Kerkhof, P.J.A.M., Coumans, W.J., Mooiweer, G.D., Eds - Elsevier Science : Amsterdam, 2000; Paper N°131.