HAL Id: hal-02416835
https://hal.archives-ouvertes.fr/hal-02416835
Submitted on 7 Jan 2020HAL is a multi-disciplinary open access archive for the deposit and dissemination of sci-entific research documents, whether they are pub-lished or not. The documents may come from teaching and research institutions in France or abroad, or from public or private research centers.
L’archive ouverte pluridisciplinaire HAL, est destinée au dépôt et à la diffusion de documents scientifiques de niveau recherche, publiés ou non, émanant des établissements d’enseignement et de recherche français ou étrangers, des laboratoires publics ou privés.
To cite this version:
Laure Latruffe, Yann Desjeux. Case study description: France. [Contract] Communauté Economique Européenne. 2006, 15 p. �hal-02416835�
CONTRACT 150369-2005 F1SC IT CALL FOR TENDERS J05/13/2005
Investment behaviour in conventional and emerging farming systems under different policy scenarios
Case study description:
France
Authors:
Laure LATRUFFE and Yann DESJEUX
INRA, Unité ESR, Rennes
With thanks to Fabrice LEVERT and Dominique DESBOIS
TABLE OF CONTENTS
INTRODUCTION AND GUIDELINES... 3
1 CASE STUDY REGION DESCRIPTION... 3
2 SAMPLE DESCRIPTION AND TIMING ... 8
3 SECONDARY DATA... 10
Introduction and guidelines
This document is intended to provide a short overview of the characteristics of each case study area and of each sample.
It is an internal document, but some information, particularly from section 1 will be used for the final report as case study description.
Please refer to the methodology paper (second interim report) for terminology and definitions.
1 Case study region description
The survey was carried out in the region Centre (NUTS 2, named “région”) (see Map 1), more specifically in the sub-region Eure-et-Loir (NUTS3, named “département”) (see Map 2), and more specifically in the area “Beauce Chartraine” (see Map 3).
The area surveyed is very agricultural. The share of UAA in total area in Eure-et-Loir (NUTS3) is 76.5%, compared to about 57% in France. The area Beauce is also called the “wheat loft of France”. Its climatic and geographical (flat) conditions makes it an ideal area for cereal production, in particular soft wheat.
Map 2: Map of the “region” Centre (NUTS2) with the various “départements” (NUTS3) and the production areas
Eure-et-Loir “département” (NUTS3)
Map 3: Map of the Eure-et-Loir “département” (NUTS3) and its sub-areas
Table 1 describes basic data about the region Centre (NUTS 2, named “région”) and the sub-region Eure-et-Loir (NUTS3, named “département”), where the survey was carried out. The information in this table are from the Census, but note the information is only for farms with size 8 ESU.
Table 1 – Basic regional data (NUTS2 and NUTS3)
Country France France
Region name Centre (“région” = NUTS2) Eure-et-Loir (“département” = NUTS3)
Size (km2) 39,317 5,940
Plain, hill, mountain (%) 75% plain, 25% hills 80% plain, 20% hills
Number of farms (in 2003) 19,806 3,416
Total UAA (ha) (in 2003) 2,154,972 405,663
Main farm specialisations Arable crops (cereals, oilseed and proteinseed (COP), field crops)
Mixed: arable crops + beef livestock
Vineyard Orchards Vegetables (see Map 2)
Arable crops (cereals, oilseed and proteinseed (COP), field crops)
Mixed: arable crops + beef livestock
Farm specialisations considered for the study
Arable crops (cereals, oilseed and proteinseed (COP), field crops)
Arable crops (cereals, oilseed and proteinseed (COP), field crops)
Area of: (in 2003) arable land (ha) cereals (ha) soft wheat (ha)
1,915,510 1,124,921 691,500 393,218 259,293 176,500 Number of: (in 2003)
individual farms partnerships
other (including companies)
12,004 6,282 1,520 1,947 not available not available Number of organic farms (in 2006) not available 25
Number of farms in type of farming 13-14 (in 2003)
11,564 2,824
Average selling price of: (in 2005) arable land (euros/ha)
pasture (euros/ha) both (euros/ha) 3,780 2,260 3,510 5,280 3,650 5,130
In Table 2a a short description of the farming systems considered, according to our classification (see methodology) is provided. In Table 2b more information is provided. Note that the information in Tables 3a and 3b are from FADN data.
Table 2a – Description of selected farming systems: FROM FADN DATA Farming system description Name NUTS 2 (if applies) Number of farms Total Agricult ural Area (ha) Usable Agricul tural Area (ha)
Organic (% of farm) Organic (% of UAA) N O T E S
ALL FARMS Centre 450 61,650 3 farms organic + 3 farms currently converting to organic FARMS IN
TYPE OF
FARMING 13-14
Centre 273 43,735 1 farm organic + 1 farm currently converting to organic
Table 2b – Description of selected farming systems: FROM FADN DATA
Region name Centre (“région” = NUTS2) Centre (“région” = NUTS2) ALL FARMS FARMS IN TYPE OF
FARMING 13-14 Number of: (in 2003)
individual farms partnerships
other (including companies)
234 188 28 148 103 22 Number of: (in 2003)
organic farms
farms converting to organic conventional farms 3 3 444 1 1 271 Average UAA per farm (ha) 137.0 160.2 Average UAA that is irrigated per
farm (ha)
15.5 22.0
Average age of farm head 47.5 47.7
2 Sample and sampling description
Describe the main criteria for sample selection within each case study (farming system).
The case study area was chosen on the ground that farms in this area absorb the largest part of the subsidies to farms in France. It was therefore expected that they would have interesting responses to the SFP introduction. It was also thought that additionally the area could enable to identify different responses regarding irrigation investment.
The farming system chosen is the most relevant for this area. Farms in this area are mainly specialised in COP and other field crops.
The choice of the 6 farms was based on the diversity of UAA and age. In the sample surveyed the minimum and maximum for UAA are 40 and 350 ha, and the minimum and maximum for age are 30 and 55 years.
Please fill/revise the attached excel table. Case studies&typologies_1.xls
See the table copied below. Table 3 – Farms per typology
Case study description Farm type description(*) Number of questionnaires Comments
COP and other
field crops 6 crop NUTS2 Centre; NUTS3 Eure-et-Loir livestock Plain orchard/vineyard/forest crop livestock con v e n tional Mountain orchard/vineyard/forest crop livestock Plain orchard/vineyard/forest crop livestock Farmin g syst em emerging Mountain orchard/vineyard/forest TOTAL 6
3 Timing
In table 4 it is provided a summary of the number of questionnaires by period, on the total. Table 4 – Number of questionnaires planned by period
Number of questionnaires done
Before August 15 August 15-August 31 September 1- September 15 4 September 16 – September 30 2 October 1 – October 15 …
4 Secondary data
In this section we ask you to explain how to fill the content of section 10 of the questionnaire.
Option 1 is included in the database excel file (LaureLatruffe-France-database_country-19Oct06.xls), as far as farmers could answer.
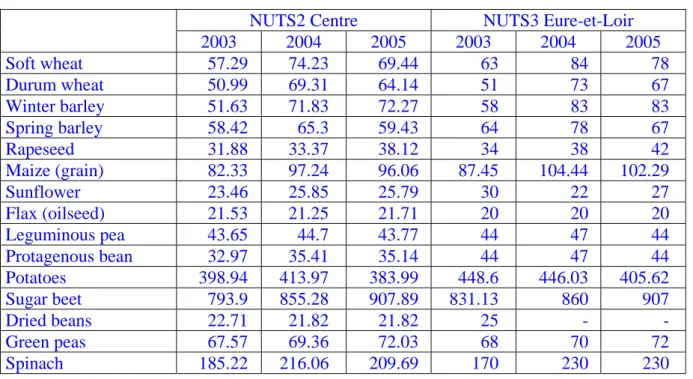
Option 2 was used to get information about yields, time, fertiliser and pesticide uses and costs. See Tables 5-10 below.
Table 5 – Average yields in 100 kg / ha for the crops in question (official statistics)
NUTS2 Centre NUTS3 Eure-et-Loir
2003 2004 2005 2003 2004 2005 Soft wheat 57.29 74.23 69.44 63 84 78 Durum wheat 50.99 69.31 64.14 51 73 67 Winter barley 51.63 71.83 72.27 58 83 83 Spring barley 58.42 65.3 59.43 64 78 67 Rapeseed 31.88 33.37 38.12 34 38 42 Maize (grain) 82.33 97.24 96.06 87.45 104.44 102.29 Sunflower 23.46 25.85 25.79 30 22 27 Flax (oilseed) 21.53 21.25 21.71 20 20 20 Leguminous pea 43.65 44.7 43.77 44 47 44 Protagenous bean 32.97 35.41 35.14 44 47 44 Potatoes 398.94 413.97 383.99 448.6 446.03 405.62 Sugar beet 793.9 855.28 907.89 831.13 860 907 Dried beans 22.71 21.82 21.82 25 - - Green peas 67.57 69.36 72.03 68 70 72 Spinach 185.22 216.06 209.69 170 230 230
Table 6 – Costs and margins for the crops and livestock in question (estimated with the INRA-Ministry of Agriculture model MCP with FADN data)
For NUTS2 region “Centre” in 2004
Soft wheat
Durum
wheat Barley Rapeseed Sunflower
Maize (including seeds) Leguminous pea, protagenous
bean Potato Sugar beet Sheep
Sample used for calculation
Number of farms 370 90 290 270 120 190 130 30 30 40 Average UAA (ha) or Livestock Unit 42.7 23.2 17.0 22.9 15.4 18.5 11.7 10.0 14.5 331.3 Average yield (100 kg/ha) 72.8 68.4 66.5 33.2 25.5 93.0 42.0 379.2 843.2 - Average price (euros/100 kg or /LU) 9.5 13.4 9.3 20.6 21.9 9.9 13.7 11.8 3.3 31.4
Costs and margins (euros/ha or /head)
Variables costs 331 421 342 501 371 453 287 1756 704 18.9 Fixed costs 553 423 448 585 440 763 368 2822 928 26.4 Total costs 885 844 790 1086 812 1215 655 4578 1632 45.4 Gross output 694 916 619 684 559 925 575 4458 2804 31.4 Gross margin 779 879 652 551 684 977 528 2617 1924 36.8 Net margin 228 456 203 -31 243 216 160 -187 878 10.4
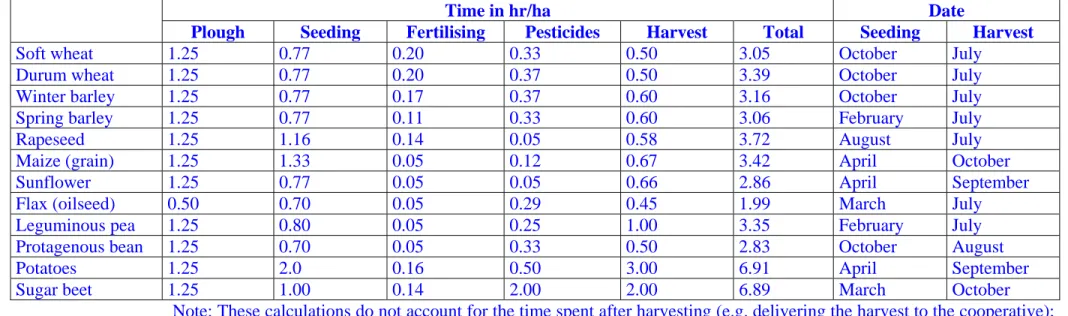
Time in hr/ha Date
Plough Seeding Fertilising Pesticides Harvest Total Seeding Harvest
Soft wheat 1.25 0.77 0.20 0.33 0.50 3.05 October July
Durum wheat 1.25 0.77 0.20 0.37 0.50 3.39 October July
Winter barley 1.25 0.77 0.17 0.37 0.60 3.16 October July
Spring barley 1.25 0.77 0.11 0.33 0.60 3.06 February July
Rapeseed 1.25 1.16 0.14 0.05 0.58 3.72 August July
Maize (grain) 1.25 1.33 0.05 0.12 0.67 3.42 April October
Sunflower 1.25 0.77 0.05 0.05 0.66 2.86 April September
Flax (oilseed) 0.50 0.70 0.05 0.29 0.45 1.99 March July
Leguminous pea 1.25 0.80 0.05 0.25 1.00 3.35 February July
Protagenous bean 1.25 0.70 0.05 0.33 0.50 2.83 October August
Potatoes 1.25 2.0 0.16 0.50 3.00 6.91 April September
Sugar beet 1.25 1.00 0.14 2.00 2.00 6.89 March October
Note: These calculations do not account for the time spent after harvesting (e.g. delivering the harvest to the cooperative); 1-2 hr/ha might be added to the totals to account for this time.
Table 8 – Estimation of time spent per livestock, based on agricultural science books
Time in hr/head/year
Sheep 6
Soft wheat 180-200 Durum wheat 180 Winter barley 140 Spring barley 120 Rapeseed 160 Maize (grain) 170 Sunflower 80 Flax (oilseed) 80-90 Leguminous pea 0 Protagenous bean 0 Potatoes 180 Sugar beet 150 Dried beans 30 Green peas 15 Spinach 110
Green pea seeds 20
Clover seeds 0
(slug killer, antivirus, antigrowth)
Barley once 3 l/ha none twice 1.5 l/ha once 1 l/ha 7 l/ha
Rapeseed twice 0.6 l/ha twice 1 l/ha once 3 l/ha once 4 l/ha 10.2 l/ha
Protagenous bean once 5.25 l/ha once 1.5 l/ha once 1 l/ha once 3 l/ha 10.75 l/ha
Potatoes twice 4.5 l/ha twice 1.8 l/ha once 2.5 l/ha once 3 l/ha 16.3 l/ha
Sugar beet twice 3 l/ha twice 2.1 l/ha twice 1 l/ha none 12.2 l/ha
Reminder from the questionnaire instructions: This information may be obtained through:
1. Questions to single farmers (as it is in the questionnaire now)
2. Other sources providing common tables for the farms of each case study. This could be done by:
o Expert interviews
o Secondary data from specific accounting (preferably of the same farm) o Secondary data from general accounting (e.g. FADN)
o Other literature
If option 2 is chosen, section 10 can be deleted from the questionnaire and used for an expert questionnaire.
If option 2 is chosen, we expect to have 1 version of the section 10 that we’ll be use for all farms belonging to the same case study (column E of the excel file).