HAL Id: hal-03037652
https://hal.umontpellier.fr/hal-03037652
Submitted on 3 Dec 2020
HAL is a multi-disciplinary open access
archive for the deposit and dissemination of
sci-entific research documents, whether they are
pub-lished or not. The documents may come from
teaching and research institutions in France or
abroad, or from public or private research centers.
L’archive ouverte pluridisciplinaire HAL, est
destinée au dépôt et à la diffusion de documents
scientifiques de niveau recherche, publiés ou non,
émanant des établissements d’enseignement et de
recherche français ou étrangers, des laboratoires
publics ou privés.
Distributed under a Creative Commons Attribution| 4.0 International License
phylogeographic hotspot
Emilie Hardouin, Annie Orth, Meike Teschke, Jamshid Darvish, Diethard
Tautz, François Bonhomme
To cite this version:
Emilie Hardouin, Annie Orth, Meike Teschke, Jamshid Darvish, Diethard Tautz, et al.. Eurasian
house mouse (Mus musculus L.) differentiation at microsatellite loci identifies the Iranian plateau
as a phylogeographic hotspot. BMC Evolutionary Biology, BioMed Central, 2015, 15 (1), pp.26.
�10.1186/s12862-015-0306-4�. �hal-03037652�
R E S E A R C H A R T I C L E
Open Access
Eurasian house mouse (Mus musculus L.)
differentiation at microsatellite loci identifies the
Iranian plateau as a phylogeographic hotspot
Emilie A Hardouin
1,2*, Annie Orth
3, Meike Teschke
1, Jamshid Darvish
4, Diethard Tautz
1and François Bonhomme
3Abstract
Background: The phylogeography of the house mouse (Mus musculus L.), an emblematic species for genetic and biomedical studies, is only partly understood, essentially because of a sampling bias towards its most peripheral populations in Europe, Asia and the Americas. Moreover, the present-day phylogeographic hypotheses stem mostly from the study of mitochondrial lineages. In this article, we complement the mtDNA studies with a comprehensive survey of nuclear markers (19 microsatellite loci) typed in 963 individuals from 47 population samples, with an emphasis on the putative Middle-Eastern centre of dispersal of the species.
Results: Based on correspondence analysis, distance and allele-sharing trees, we find a good coherence between geographical origin and genetic make-up of the populations. We thus confirm the clear distinction of the three best described peripheral subspecies, M. m. musculus, M. m. domesticus and M. m. castaneus. A large diversity was found in the Iranian populations, which have had an unclear taxonomic status to date. In addition to samples with clear affiliation to M. m. musculus and M. m. domesticus, we find two genetic groups in Central and South East Iran, which are as distinct from each other as they are from the south-east Asian M. m. castaneus. These groups were previously also found to harbor distinct mitochondrial haplotypes.
Conclusion: We propose that the Iranian plateau is home to two more taxonomic units displaying complex primary and secondary relationships with their long recognized neighbours. This central region emerges as the area with the highest known diversity of mouse lineages within a restricted geographical area, designating it as the focal place to study the mechanisms of speciation and diversification of this species.
Keywords: House mouse, Microsatellites, Phylogeographic hotspot, Iranian plateau Background
The house mouse (Mus musculus L.) has long been viewed has an excellent model for the study of evolution and its genome has been one of the first to be nearly completely sequenced [1,2]. Moreover, its dispersal cap-acity through commensalism has ranked it as one of the “100 world worst most invasive alien species” (ISSG), therefore offering various possibilities to study adapta-tion to various environments [3]. At the same time, this
species is one of the most studied vertebrates due to its use as a prominent laboratory model, but its phylogeo-graphy and population genetics is so far only partly understood [4]. The current knowledge has slowly accu-mulated over the last 30 years in a non-optimal fashion, since its most peripheral populations in Europe, Asia and the Americas have been studied before insights were gained for those from the Middle-Eastern centre of its distribution [5].
It is now widely recognised that Mus musculus L. con-stitutes a complex assembly of more or less well sepa-rated populations and subspecies. The term“subspecies” in itself is taken here in its broad sense of “genetically recognisable entities” but this does not imply on our part any deeper statement about the actual level of isola-tion among these entities. The last 45 years of literature
* Correspondence:ehardouin@bournemouth.ac.uk
1Max Planck Institute of Evolutionary Biology, Department of Evolutionary
Genetics, August-Thienemann-Str. 2, 24306 Plön, Germany
2Department of Life and Environmental Sciences, Faculty of Science and
Technology, Bournemouth University, Christchurch House, Talbot Campus, Poole, Dorset BH12 5BB, UK
Full list of author information is available at the end of the article
© 2015 Hardouin et al.; licensee BioMed Central. This is an Open Access article distributed under the terms of the Creative Commons Attribution License (http://creativecommons.org/licenses/by/4.0), which permits unrestricted use, distribution, and reproduction in any medium, provided the original work is properly credited. The Creative Commons Public Domain Dedication waiver (http://creativecommons.org/publicdomain/zero/1.0/) applies to the data made available in this article, unless otherwise stated.
on systematics of the house mouse revealed that nomen-clatorial issues have been quite controversial, with the use of many terms ranging from biochemical groups, subspecies, semi-species to full species to designate the same entities. Here, we follow the generally held view that the more widely distributed populations are grouped into three different subspecies: Mus musculus musculus in Eastern Europe, Central and North East Asia, Mus musculus domesticus in Northern Africa and Western Europe, and Mus musculus castaneus in South East Asia. These last two subspecies have further ex-panded in modern times to the Americas, Australia and Oceania [6-9]. In addition, Mus musculus molossinus, a hybrid between M. m. musculus and M. m. castaneus found in Japan [10] is often considered as a subspecies on its own. Closer to the centre of the distribution, Mus musculus gentilulus has been identified in the eastern part of the Arabic peninsula on the basis of its mito-chondrial DNA lineage [11] while from the same type of data [12,13] it has been shown that certain populations considered as M. m. castaneus in Iran, Pakistan and Afghanistan should probably be considered as belonging to further sub-specific groups. Moreover, another com-pletely independent lineage has recently been identified on this basis in Nepal [13]. Hence, the taxonomic situ-ation close to the Middle-Eastern centre is far from be-ing fully clarified. Since taxonomy reflects history, this clarification is a prerequisite if we want to further study the evolutionary mechanisms accounting for the species’ differentiation.
The present study aims at filling this gap through the analysis of genetic variation at nuclear loci and is the
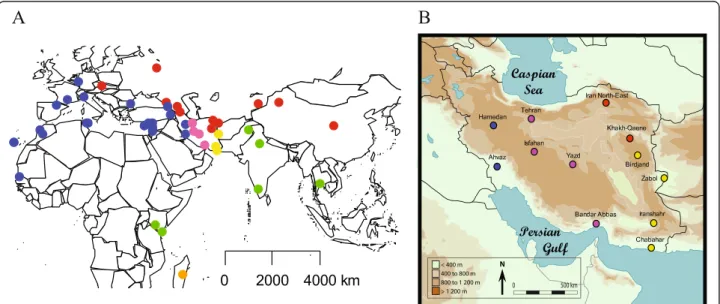
first attempt to directly compare a set of population samples covering most of the Eurasian distribution of the species. We report on the variability at 19 microsat-ellite loci typed in 963 individuals originating from 47 populations in Europe, Asia, Africa and the Middle-East (Figure 1).
Our main findings support the global picture of a spe-cies having initially differentiated in several genetic en-tities in the Middle-East forming the extant subspecies. Several of these subsequently expanded outwards be-cause of their propensity to engage in commensalism and finally colonise the entire world. Of particular inter-est is the situation of the populations inhabiting the Iranian plateau where, despite an important level of sec-ondary admixture in this region, four main genetic groups could be identified, in partial congruence with the mitochondrial analysis.
Results
Genetic diversity
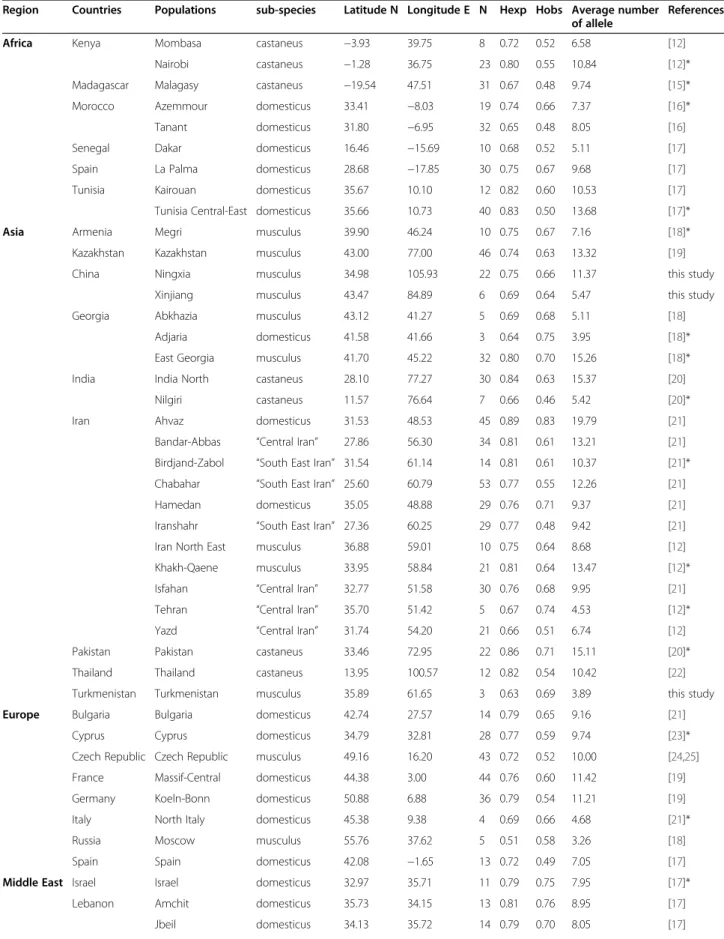
The genetic diversity was calculated for all samples (Table 1). The most diverse sample was the one from Ahvaz in Iran with a Hexpof 0.89 and an average
num-ber of alleles across loci of 19.3. The lowest Hexpis seen
for Moscow (0.49) with only 3.1 alleles/loci, but this can be ascribed to the small sample size (N = 5). Among the three islands that are present in this study, La Palma (Canaries) and Cyprus displayed a Hexp comparable to
continental populations (0.74 and 0.77 respectively), while the Madagascar value was slightly lower (0.67). Mean and Median of Hexpare 0.74 and 0.75 respectively.
The global differentiation as measured by inter-sample
Figure 1 Location of the house mouse samples used in this study. Blue dots represent M. m. domesticus population, red dots M. m. musculus, green dots M. m. castaneus, pink dots central Iran, yellow dots South East Iran and orange dots Madagascar. A) World view, B) Map of Iran (adapted from [14]).
Table 1 Geographic origin of samples and their genetic diversity parameters at 19 microsatellite loci
Region Countries Populations sub-species Latitude N Longitude E N Hexp Hobs Average number of allele
References
Africa Kenya Mombasa castaneus −3.93 39.75 8 0.72 0.52 6.58 [12]
Nairobi castaneus −1.28 36.75 23 0.80 0.55 10.84 [12]*
Madagascar Malagasy castaneus −19.54 47.51 31 0.67 0.48 9.74 [15]*
Morocco Azemmour domesticus 33.41 −8.03 19 0.74 0.66 7.37 [16]*
Tanant domesticus 31.80 −6.95 32 0.65 0.48 8.05 [16]
Senegal Dakar domesticus 16.46 −15.69 10 0.68 0.52 5.11 [17]
Spain La Palma domesticus 28.68 −17.85 30 0.75 0.67 9.68 [17]
Tunisia Kairouan domesticus 35.67 10.10 12 0.82 0.60 10.53 [17]
Tunisia Central-East domesticus 35.66 10.73 40 0.83 0.50 13.68 [17]*
Asia Armenia Megri musculus 39.90 46.24 10 0.75 0.67 7.16 [18]*
Kazakhstan Kazakhstan musculus 43.00 77.00 46 0.74 0.63 13.32 [19]
China Ningxia musculus 34.98 105.93 22 0.75 0.66 11.37 this study
Xinjiang musculus 43.47 84.89 6 0.69 0.64 5.47 this study
Georgia Abkhazia musculus 43.12 41.27 5 0.69 0.68 5.11 [18]
Adjaria domesticus 41.58 41.66 3 0.64 0.75 3.95 [18]*
East Georgia musculus 41.70 45.22 32 0.80 0.70 15.26 [18]*
India India North castaneus 28.10 77.27 30 0.84 0.63 15.37 [20]
Nilgiri castaneus 11.57 76.64 7 0.66 0.46 5.42 [20]*
Iran Ahvaz domesticus 31.53 48.53 45 0.89 0.83 19.79 [21]
Bandar-Abbas “Central Iran” 27.86 56.30 34 0.81 0.61 13.21 [21] Birdjand-Zabol “South East Iran” 31.54 61.14 14 0.81 0.61 10.37 [21]* Chabahar “South East Iran” 25.60 60.79 53 0.77 0.55 12.26 [21]
Hamedan domesticus 35.05 48.88 29 0.76 0.71 9.37 [21]
Iranshahr “South East Iran” 27.36 60.25 29 0.77 0.48 9.42 [21] Iran North East musculus 36.88 59.01 10 0.75 0.64 8.68 [12] Khakh-Qaene musculus 33.95 58.84 21 0.81 0.64 13.47 [12]* Isfahan “Central Iran” 32.77 51.58 30 0.76 0.68 9.95 [21] Tehran “Central Iran” 35.70 51.42 5 0.67 0.74 4.53 [12]*
Yazd “Central Iran” 31.74 54.20 21 0.66 0.51 6.74 [12]
Pakistan Pakistan castaneus 33.46 72.95 22 0.86 0.71 15.11 [20]*
Thailand Thailand castaneus 13.95 100.57 12 0.82 0.54 10.42 [22]
Turkmenistan Turkmenistan musculus 35.89 61.65 3 0.63 0.69 3.89 this study
Europe Bulgaria Bulgaria domesticus 42.74 27.57 14 0.79 0.65 9.16 [21]
Cyprus Cyprus domesticus 34.79 32.81 28 0.77 0.59 9.74 [23]*
Czech Republic Czech Republic musculus 49.16 16.20 43 0.72 0.52 10.00 [24,25] France Massif-Central domesticus 44.38 3.00 44 0.76 0.60 11.42 [19]
Germany Koeln-Bonn domesticus 50.88 6.88 36 0.79 0.54 11.21 [19]
Italy North Italy domesticus 45.38 9.38 4 0.69 0.66 4.68 [21]*
Russia Moscow musculus 55.76 37.62 5 0.51 0.58 3.26 [18]
Spain Spain domesticus 42.08 −1.65 13 0.72 0.49 7.05 [17]
Middle East Israel Israel domesticus 32.97 35.71 11 0.79 0.75 7.95 [17]*
Lebanon Amchit domesticus 35.73 34.15 13 0.81 0.76 8.95 [17]
FST was = 0.17, albeit non-uniformly distributed among
the 19 loci, with some loci contributing more than others. There are two outlier loci displaying global FST
values of 0.52 (D1EnsmusG22992) and 0.41 (D9Mit54). Removing those yields an average FSTof 0.14.
Correspondence analysis
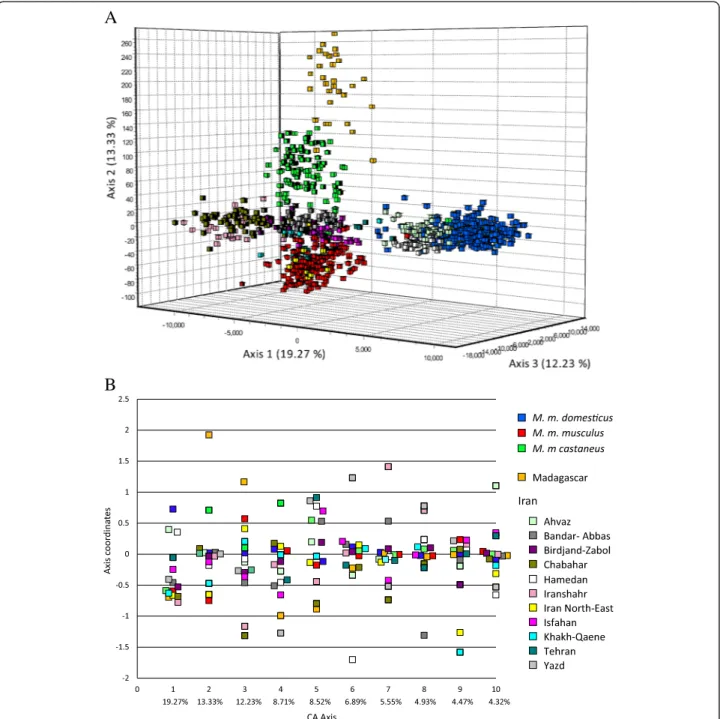
The Correspondence Analysis (CA) depicts the relative positions of individual genotypes projected onto the 3D space of maximal differentiation of each sample’s cen-troid (Figure 2A). We chose to represent the samples assigned to the three peripheral sub-species (M. m. domesticus, M. m. musculus and M. m castaneus) in pre-vious studies by blue, red and green squares respectively, the Malagasy sample in orange and the Iranian samples with a palette of colours. The first three axes explained more than 44.8% of the total inertia. The coordinates of the centroids on the 10 first axes can be seen in Figure 2B. Contrary to what could have been expected a priori, we do not simply observe M. m. domesticus, M. m. musculus and M. m. castaneus separated by the two first axes and the central samples clustering somewhere in the middle, but rather there are two South East Iranian samples (Iranshahr and Chabahar) which pull the 1staxis in a direction oppos-ite to M. m. domesticus, while the differentiation between M. m. musculusand M. m. castaneus is only seen on axis 2. Interestingly, Malagasy animals which have been previ-ously shown to possess a M. m. gentilulus mtDNA haplo-type [15] are pulled further away along the M. m. castaneuscloud on axis 2, this possibly reflecting a founder effect in line with their somewhat lower diversity as re-ported above. Axis 3 primarily accounts for a clear oppos-ition between South East Iranian and Malagasy samples. As expected Ahvaz and Hamedan, which have been shown to harbour predominantly M. m. domesticus matrilines [21], clustered with M. m. domesticus on one side and Khakh-Qaene and Iran North-East (a grouping of samples from the Mashhad region [26]) with M. m. musculus. The last samples predominantly from central Iran (Bandar-Abbas, Birdjand-Zabol, Isfahan, Tehran and Yazd) are situ-ated at various distances in the middle of the axis 1, 2 and 3 (Figure 2A and B), but that of Yazd is strongly associated with the negative coordinates of axis 4 (Figure 2B). Other peculiarities can be found on the other axes and, even if no
strictly private alleles were found for any particular sample except for very rare ones, these associations of different samples with different axes is indicative of the existence of groups of particular alleles among the 964 present in the global data set that pull the signal along theses axes (not shown).
Population tree
A complementary graphical representation of population differentiation is provided by the Neighbour-Joining tree of Figure 3. The bootstrap values are not very high, but there is a high coherence in the phylogeographical groupings on the tree. The three major subspecies are clearly grouped together, with the only exception for the sample of Abkhazia (western Georgia) which did not cluster with M. m. musculus, while it was previously de-scribed from electrophoretical data as being predominantly of M. m. musculus composition (55% M. m. musculus, 45% M. m. domesticus –[18]). The Iranian mice other than those previously referred to M. m. domesticus or to M. m. musculus form two clearly distinct groups that are not closer to each other than they are from M. m. castaneus. One group called Central Iran (in pink) contains the sam-ples from Tehran, Bandar-Abbas, Yazd and Isfahan and an-other group called South-East Iran (in yellow) contains samples from Birdjand-Zabol, Iranshahr and Chabahar. This last group was located opposite of M. m. domesticus on axis 1 of the CA and clearly stands on its own on the NJ tree.
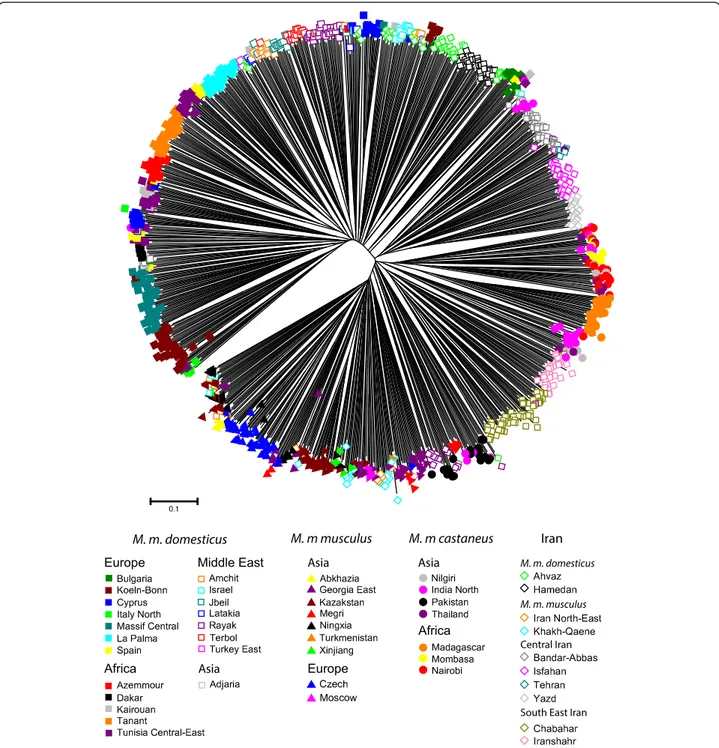
Individual allele-sharing distance tree
Representing nearly a thousand individuals on a single tree is difficult; nevertheless, the clustering obtained at the population level can largely be seen also at the indi-vidual level (Figure 4). Although the relative proximity of the different branches of the tree cannot be evaluated properly, it is remarkable that the order in which the various samples are organised fits almost perfectly with the population tree of Figure 3, starting with the M. m. domesticus samples at one point and ending with the ones referable to M. m. musculus. Remarkable also is the fact that most samples appear rather homogeneous. For instance, the individuals from South-East Iran: Iranshahr (light pink empty diamonds) and Chabahar (dark green
Table 1 Geographic origin of samples and their genetic diversity parameters at 19 microsatellite loci (Continued)
Rayak domesticus 33.87 36.03 23 0.79 0.72 8.95 [17]
Terbol domesticus 33.82 35.98 14 0.67 0.58 5.74 [17]
Syria Latakia domesticus 35.52 35.79 4 0.61 0.58 3.42 [17]
Turkey Turkey East domesticus 38.63 42.90 3 0.66 0.80 3.68 this study
N = number of individuals analysed, Hexp = expected heterozygosity, Hobs = observed heterozygosity, *samples kept as wild-derived inbred strains at the CGSS repository of Montpellierhttp://www.isem.univ-montp2.fr/recherche/les-plate-formes/conservatoire-genetique-de-souris-sauvages/presentation/.
empty diamonds) group together and are very close to each other. The same is seen in another sector of the tree with Yazd (light grey empty diamonds) and Isfahan (dark pink empty diamonds) and Bandar-Abbas (dark grey empty diamonds) from Central Iran. Interestingly, the Birdjand-Zabol samples (dark purple empty dia-monds) superimposes with Pakistani (black filled circle) and some India North (pink filled circle) individuals, whereas it groups loosely with the South-East Iranian samples in the population tree and lies not far from the
central Iranian ones in the CA. This was the sample showing the least coherence between the three types of analyses.
Structure analysis
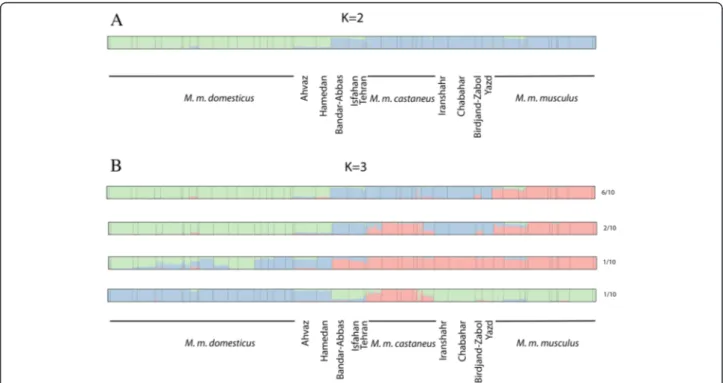
The Bayesian clustering procedure implemented in STRUCTURE [27] was performed with various numbers of partitions. Interestingly, the software was not able to converge for K larger than 2, and the standard deviation of the LogLikelihood among runs was quite high for
Figure 2 Correspondence analysis. A) 3D analyses on populations’ centroids, every square representing an individual. B) Axis coordinates for the first 10 axis of the analysis, every square representing a population centroid.
larger values of K (Table 2). Accordingly, the criterion of Evanno et al. [28] (a steep change in the likelihood) or other more recently derived methods (see [29]) could not really be applied, the probable reasons for this are discussed further below. For this value of the partition, the samples were divided between M. m. domesticus on one side and non-M. m. domesticus on the other side, thus grouping M. m. musculus, M. m. castaneus and the Iranian samples (Figure 5A). All the runs for larger values of K yielded partially incompatible outputs, pri-marily because the assignment of Iranian samples varied from one run to the other. For K = 3, four different types of configurations were obtained (Figure 5B). The two groups of Iranian samples grouped either with M. m. castaneus(6 runs out of 10) or with M. m. musculus (1 run out of 10). Interestingly, in 2 runs out of 10, M.
m. musculus and M. m. castaneus clustered together, leaving Central and South-East Iran forming one popula-tion. In the last configuration, all samples from Iran (except M. m. domesticus), M. m. musculus and M. m. castaneus clustered together while M. m. domesticus was divided in two groups: Eastern versus Western Mediterranean. For K = 4, six types of configurations were obtained, four of which separate the Iranian samples from the rest (see Additional file 1: Figure S1), two grouped Central and South East Iran with M. m. castaneus. Interestingly, these very samples were never grouped with M. m. musculus for K = 4, and some of the heterogeneity was carried by M. m. domesticusin three runs where possibly the occidental sam-ples of this subspecies differentiated from the oriental ones. For K = 5 (see Additional file 1: Figure S2), a mixture of all these situations was obtained in several combinations with
five different types of configuration. It is noteworthy, however, that the non-stable alternatives proposed by the software always turn around the same handful of clustering hypotheses. Further, for every of these values of K, some samples appeared to display detectable levels of introgression (see for instance Ahvaz, Thailand or Pakistan samples-Additional file 1: Figure S1).
Discussion
Overall differentiation
As was to be expected, the population samples from the best described subspecies differentiate clearly from each other, and can be unambiguously assigned to M. m. mus-culus, M. m. domesticus or M. m. castaneus in keeping with previous studies (see [5] for a review). These long recognised entities are separated by the three first
Figure 4 Neighbour-joining tree based on the calculation of the proportion of shared alleles calculated for all individuals. Samples from the same location share the symbol/colour pattern.
canonical axes of the CA in Figure 2, and constitute the three longest branches of the distance tree in Figure 3 and occupy different sectors of the circle in the allele-sharing tree of Figure 4. For the sake of comparison with the literature, an AMOVA performed among these three entities only indicated a FCTvalue of 0.70 for an average
within group differentiation of FSC= 0.12.
When calculated inside each of our sampling of the peripheral subspecies, this becomes 0.10, 0.13 and 0.09 for M. m. castaneus, M. m. domesticus and M. m. mus-culusrespectively, thus indicating a consequent amount of internal variation inside each of them. However, when the whole collection was submitted to the Bayesian as-signation of STRUCTURE, only the partition between M. m. domesticus and all the rest appeared stable (Figure 5A).
One noticeable point is that there is a quite good geo-graphical coherence in each group. If one considers M. m. domesticus for instance, the fan-shaped sub-tree of
Figure 3 separates well the Near-East samples from the European ones. The Senegalese sample appears clearly as a recent offshoot of European origin, while this is not the case for Northern-African ones (Morocco and Tunisia). For M. m. musculus, the feather-like sub-tree indicate remote branching for the Chinese and Kazak samples, a fact to be put in relation with the probable recent eastwards expansion of this subspecies from the Caucasus region [26,30]. As to the M. m. castaneus clus-ter, it is the one where unexpected assignations occur. As reported above, the Malagasy sample clearly belongs to this group despite it possessing M. m. gentilulus mtDNA. This is another example of the possibility for maternal lineage capture during an expansion process. Madagascar is thought to have been populated by mice quite recently (ca 1,000 years, [15]) with the develop-ment of trade between India and Indonesia (were the nuclear genome most likely comes from), the Arabic peninsula (for the M. m. gentilulus maternal lineage [11]) and Africa. Of interest also is the position of the Kenyan mice, both from the coast (Mombasa) and the interior (Nairobi) which appear also as a recent M. m. castaneus offshoot, despite harbouring a mixture of M. m. castaneus and M. m. domesticus matrilines [17] as well as supplementary matrilines (see Additional file 2). An-other noticeable point is, as expected, that samples known to be introgressed as the above-mentioned Abkhazian one, tend to“move” toward the centre of the tree. This is also the case for the Armenian sample from Megri, which is M.
Figure 5 Structure results for K = 2 (A) and K = 3 (B) of the mouse populations used in this study. The different configurations found for K = 3 are represented as well as the number of times that the same pattern was obtained in 10 independent runs.
Table 2 Summary of STRUCTURE results as displayed with STRUCTURE Harvester
K Reps Mean LnP(K) Stdev LnP(K) Ln’(K) |Ln”(K)| Delta K
1 10 −105767.55 0.47 NA NA NA
2 10 −97891.36 20.79 7876.19 4855.47 233.52 3 10 −94870.64 438.61 3020.72 775.75 1.77 4 10 −92625.67 312.34 2244.97 309.48 0.99
m. musculus for 2/3 of its nuclear genome [18] and was already shown to be under multiple genetic influences since it also contains for instance at the ABP locus three different alleles, each one ascribed to a given subspecies [31].
Status of Iranian plateau populations
The most interesting results of this study concern the samples of the Iranian plateau, which have sometimes been coined “central populations” because of many un-certainties as to their taxonomic affiliation. Putting aside the samples unambiguously referable to M. m. musculus (Khakh-Qaene and Iran North-East) and M. m. domesti-cus (Ahvaz and Hamedan), we are left with two clearly separated entities as described in the Results section. Interestingly, this fits rather well with the mitochondrial description recently provided [12] where each of the en-tities recognised in Iran is associated predominantly with one haplogroup (HG) essentially not found elsewhere. Namely, when recompiling the aforementioned data [12] for the populations’ samples of this study, the Central Iran group is associated with mitochondrial haplogroup Hg1B (78%) and South-East Iranian is associated with haplogroup Hg3 at 88%, while these two HGs are prac-tically non-existent outside Iran where M. m. castaneus is almost completely associated with Hg2. The mito-chondrial tree of all studied populations is provided in Additional file 1: Figure S3 to illustrate this point. As discussed by Rajabi-Maham et al. [12], the separate co-alescence of these phylogenetically independent hap-logroups have most likely arisen in allopatry during past periods of geographical isolation, and our nuclear gen-ome results fit quite well with this view as they also point towards the existence of two independent groups in Iran, one in the center, and one in the South-East. These two groups are loosely related to M. m. castaneus, as are their matrilines (Additional file 1: Figure S3). Fur-thermore, the separation of the different entities in Iran seems to fit the topography of the country. M. m. domesticussamples are separated from the Central Iran individuals by the Zagros Mountains, Central Iran from M. m. musculus through the Kavir desert and from south-east Iran through the Lut desert (Figure 1B).
The central and south-east Iranian phylogroups are as distinct from each other as they are from the south-east Asian M. m. castaneus, even if many signs of admixture and secondary contacts are to be found, be it on the nu-clear genome or the mitochondrial data. This is likely the principal reason why the STRUCTURE clustering did not converge to stable partitions for values of K lar-ger than 2; probably because certain loci may have been more prone to be exchanged than other after secondary exchange. Hence, the present genomic make-up of Iran-ian populations is likely to be a mosaic of locally evolved haplotypes (like the mitochondrial matrilines) and
segments imported from their neighbours in proportions that remain to be estimated. Nevertheless, they necessar-ily have evolved as geographical isolates during a certain amount of time and cannot be considered as resulting from simple admixture of surrounding populations. Hence, we may consider them as new independent en-tities, even if monophyly will rarely be achieved because of the retention of ancestral polymorphisms and second-ary gene flow.
Attempts at setting the time frame for these exchanges with ABC methods have been recently performed [32], but these did not formally consider the existence of in-dependent Iranian entities. The ancient origin of most Iranian phylogroups has however been recently rein-forced by independent data showing they may have retained ancestral morphological features [33]. Only more sophisticated model-based analyses relying on genome-wide multilocus data will be able to tell what kind of genetic exchanges they are still able to maintain. Such genome-wide data exist currently solely for the comparison between the peripheral M. m. domesticus populations in Germany and France, versus M. m. mus-culus in Czech Republic and Kazakhstan [34] and be-tween wild-derived lines representing each of the three peripheral subspecies [35]. These studies have revealed complex patterns of mutual introgression but cannot en-lighten us as to the history and status of the Iranian phylogroups.
From the taxonomical standpoint, this situation de-serves further scrutiny, since the distinctiveness of these three phylogroups should prevent the use of a single Latin trinomial like M. m. castaneus. However, solving the problem would require having access to hypothetical voucher specimens and a better delineation of present day limits of these phylogroups. This is not an easy task, because the species as a whole has undergone a phase of post-glacial expansion triggered by its association with Neo-lithic humans which may have induced a phase of complex hybridization, introgression and de-differentiation. This de-differentiation reaches some clear limits when dis-tantly related subspecies like M. m. domesticus and M. m. musculusare concerned since their contact amounts to hybrid zones with restricted gene flow (see for in-stance [36] and the literature cited therein), but is not so clear what happens between the four non-domesticus entities considered here.
Conclusion
Our analysis of a Eurasian collection of wild mice encom-passing both peripheral populations and a large number of central ones is the first comprehensive approach aiming at providing a global view of the relationships among the taxa constitutive of this complex subspecific assemblage. We propose here that the Iranian plateau is home to two
more units displaying complex primary and secondary relationships with their long recognized neighbours M. m. domesticus, M. m. musculus and M. m. castaneus. If one adds to this the M. m. gentilulus from the Arabic penin-sula and the new clade described from Nepal [13], the taxonomic diversity is clearly higher than previously thought. This is not a surprise if one considers the highly tormented landscape of the central regions where the complex species originated from, where there was clearly space for more than three geographical isolates before its worldwide expansion. The fact that this happens in and around the Iranian plateau is consistent with the key geo-graphical position of this region which constitute an obli-gate passage between the lowlands of central Asia to the North, the Fertile Crescent and the Near-East to the West, and the Indian subcontinent to the East. Although the present-day distribution of distinct phylogroups does not necessarily indicate where the ancestral species was origin-ally located, it becomes clear from the above results that the Iranian plateau should be included in the candidate re-gions together with the Indo-Pak sub-continent and neighboring Afghanistan. Indeed, in this large Middle-Eastern region, no less than six distinct phylogroups have differentiated and presently interact with each other. This should now be taken into account when building evolu-tionary scenarios.
Methods
Mice sampling
Most of the individuals included in this study come from the DNA collection established at ISE-M between 1985 and 2005 with the exception of the samples from Massif Central, Cologne-Bonn, Czech Republic and Kazakhstan that come from the collection held at the MPI-Plön [19]. All these samples have been described and used in previ-ous publications, the references of which are given in Table 1, together with their geographical locations.
Genotyping
19 microsatellites were chosen from previous studies: PP8E11 (Chr2), PP6E09 (Chr3), D1EnsmusG22992 (Chr3), PP10E08 (Chr4), D5Mit149 (Chr5), D6Mit309 (Chr6), PP10A02 (Chr8), D9Mit54 (Chr9), D9Mit330 (Chr9), PP3A02 (Chr10), PP4A02 (Chr11), D13Mit61 (Chr13), D14Mit203 (Chr14), E1EnsmusG46849 (Chr15), D15Mit98 (Chr15), PP7B08 (Chr16), PP8A05 (Chr17), D19Mit39 (Chr19) and, PP2A01 (ChrX) [37,38]. Forward primers were labeled with FAM or HEX dye on the 5’end and the reaction conditions were as follow: denaturation, 95°C for 15 min, 28 cycles with 0.30s at 95°C, 1.30 min at 60°C and 1.30 min at 72°C, final elongation 10 min at 72°C. Primers (Additional file 1: Table S1) were pooled in 5 different reac-tions with a final reaction volume of 5μl using Multiplex PCR kit (Qiagen). PCR products were then diluted 1/20 in
Millipore water. 1μL of this dilution was added to a mix of 0.1μL ROX Standard (Applied Biosystems) and 10 μL HiDi Formamid. Heating for the denaturation step was 2 min at 90°C followed by 5 min at 20°C. Microsatellites were scored using GeneMapper (Applied Bioscience).
Data analysis
Basic diversity parameters were obtained using Genetix [39] and Arlequin [40]. Several ways of dissecting the genetic variability present at the 19 microsatellites loci were used concurrently. We first performed a Corres-pondence Analysis (CA) using the AFC-3D procedure of Genetix. This is an unsupervised method which allows representation of the differentiation of samples along in-dependent factorial axes. We did this by taking the cen-troids of samples as active elements (and individuals as supplementary elements) considering alternatively the whole collection (47 population samples, 963 individ-uals) with those samples previously described unambigu-ously as belonging to the peripheral subspecies, either M. m. domesticus (22 populations, 367 individuals), M. m. musculus (11 populations, 172 individuals) or M. m. castaneus(7 populations, 133 individuals) considered in-dividually, or the samples from Iran (11 populations, 291 individuals) including individuals from all the different sub-species.
The pairwise Reynold’s distances were computed using the Gendist program of the Phylip package [41] and 1,000 bootstrapped datasets were generated with Seqboot, followed by the Neighbor and Consense procedures from the same package to obtain a Neighbour-Joining consen-sus population tree. Additionally, an Allele Sharing dis-tance tree considering all individuals was calculated using the software Populations 1.2.32 [42] and visualized with MEGA 6 [43].
Finally, we used the STRUCTURE program [27] to as-sign the collection of individuals to several putatively re-productively independent groups. The run parameters were as follow: a burn-in period of 1,000,000 simulations followed by a run length of 1,000,000 MCMC simula-tions and ten iterasimula-tions for K (number of clusters) equals 1 to 5. The runs were performed using the admixture model with the Loc Prior option. Results were summa-rized using Structure Harvester [44]. K was chosen using the criterion of Evanno et al. [28]. To draw the structure diagrams the softwares CLUMPP [45] and Distruct [46] were used.
The mitochondrial D-loop sequences tree from Additional file 1: Figure S3 was produced with MEGA6 [43]. The inference was performed according to the maximum likelihood method based on the Tamura-Nei model [47]. The boostrap values (150 replicates) are shown. Initial tree(s) for the heuristic search were ob-tained by applying the Neighbor-Joining method to a
matrix of pairwise distances estimated using the Max-imum Composite Likelihood (MCL) approach. A discrete Gamma distribution was used to model evolutionary rate differences among sites (5 categories (+G, parameter = 0.1440)). The rate variation model allowed for some sites to be evolutionarily invariable ([+I], 62.0668% sites). The tree is drawn to scale, with branch lengths measured in the number of substitutions per site. The analysis involved 867 nucleotide sequences. All positions with less than 95% site coverage were eliminated. That is, fewer than 5% alignment gaps, missing data, and ambiguous bases were allowed at any position. There were a total of 849 posi-tions in the final dataset.
Availability of supporting data
The microsatellites dataset supporting the results of this article on Dryad: doi:10.5061/dryad.ck276.
Additional files
Additional file 1: Figure S1. Structure results for K=4. The different configurations found are represented as well as the number of times that the same pattern was obtained in 10 independent runs. Figure S2. Structure results for K=5. The different configurations found are represented as well as the number of times that the same pattern was obtained in 10 independent runs. Figure S3. Mitochondrial D-loop sequences tree. An expanded version of it is available in Additional file 2. Table S1: Primers used to amplify the 19 microsatellites used in this study.
Additional file 2: Enlarged rectangular tree of Additional file 1: Figure S3 above.
Competing interests
The authors declare that they have no competing interests.
Authors’ contributions
JD and FB initiated the study of Middle Eastern mouse phylogeography, FB and DT developed the project, AO, and MT did the laboratory work, EAH, AO and FB analysed the dataset, EAH and FB wrote the manuscript. All authors read, commented and approved the final manuscript.
Acknowledgements
We are grateful to the numerous colleagues and students that have helped us to collect these samples over more than 30 years, with a special mention of Hassan Rajabi-Maham and Roohollah Siahsarvie for their help with Iranian mice. Special thanks goes to Bettina Harr for having designed and run the first microsatellite typing, to Raphael Leblois and Mathieu Gautier for having spent a considerable amount of time to convince us that STRUCTURE and GENELAND did not converge on our data set, and to Heinke Buhtz and Conny Burghardt for excellent technical assistance. John Stewart helped improve the English language. We are also grateful to the two anonymous reviewers and the editor for helping to improve the manuscript. This is publication ISEM 2015-021.
Author details
1
Max Planck Institute of Evolutionary Biology, Department of Evolutionary Genetics, August-Thienemann-Str. 2, 24306 Plön, Germany.2Department of
Life and Environmental Sciences, Faculty of Science and Technology, Bournemouth University, Christchurch House, Talbot Campus, Poole, Dorset BH12 5BB, UK.3Institut des Sciences de l’Evolution, CNRS, IRD, EPHE, Université de Montpellier, Pl. E. Bataillon, 34095 Montpellier, France.
4
Rodentology Research group, Ferdowsi University of Mashhad, Mashhad, Iran.
Received: 29 September 2014 Accepted: 12 February 2015
References
1. Mouse Genome Sequencing Consortium. Initial sequencing and comparative analysis of the mouse genome. Nature. 2002;420:520–62. 2. Church DM, Goodstadt L, Hillier LW, Zody MC, Goldstein S, She X, et al.
Lineage-specific biology revealed by a finished genome assembly of the mouse. PLoS Biol. 2009;7(5):e1000112. doi:10.1371/journal.pbio.1000112. 3. Teschke M, Buentge A, Tautz D. Tracing recent adaptations in natural
populations of the house mouse. In: Macholán M, Baird SJE, Munclinger P, Piálek J, editors. Evolution of the House mouse (Cambridge Studies in Morphology and Molecules: New Paradigms in Evolutionary Biology). UK: Cambridge University Press; 2012. p. 315–33.
4. Guénet J-L, Bonhomme F. Wild mice: an ever-increasing contribution to a popular mammalian model. Trends Genet. 2003;19:24–31.
5. Bonhomme F, Searle JB. House mouse phylogeography. In: Macholán M, Baird SJE, Munclinger P, Piálek J, editors. Evolution of the House mouse (Cambridge Studies in Morphology and Molecules: New Paradigms in Evolutionary Biology). UK: Cambridge University Press; 2012. p. 278–96. 6. Searle JB, Jamieson PM, Gündüz I, Stevens MI, Jones EP, Gemmill CEC, et al.
The diverse origins of New Zealand house mice. Proc R Soc B. 2009;276:209–17. doi:10.1098/rspb.2008.0959.
7. Hardouin EA, Chapuis J-L, Stevens MI, Van Vuuren JB, Quillfeldt P, Scavetta RJ, et al. House mouse colonization patterns on the sub-Antarctic Kerguelen Archipelago suggest singular primary invasions and resilience against re-invasion. BMC Evol Biol. 2010;10:325.
8. Gabriel SI, Stevens MI, Da Luz MM, Searle JB. Of mice and‘convicts’: origin of the Australian house mouse. Mus musculus. PLoS One. 2011;6(12):e28622. doi:10.1371/journal.pone.0028622.
9. Jones EP, Jóhannesdóttir F, Gündüz I, Richards MB, Searle JB. The expansion of the house mouse into northern-western Europe. J Zool. 2011;283:257–68. 10. Suzuki H, Aplin KP. Phylogeny and biogeography of the genus Mus in
Eurasia. In: Macholán M, Baird SJE, Munclinger P, Piálek J, editors. Evolution of the House mouse (Cambridge Studies in Morphology and Molecules: New Paradigms in Evolutionary Biology). UK: Cambridge University Press; 2012. p. 35–64.
11. Prager EM, Orrego C, Sage RD. Genetic variation and phylogeography of central Asian and other house mice, including a major new mitochondrial lineage in Yemen. Genetics. 1998;150:835–61.
12. Rajabi-Maham H, Orth A, Siahsarvie R, Boursot P, Darvish J, Bonhomme F. The south-eastern house mouse Mus musculus castaneus (Rodentia: Muridae) is a polytypic subspecies. Biol J Linn Soc. 2012;107:295–306. 13. Suzuki H, Nunome M, Kinoshita G, Aplin KP, Vogel P, Kryukov AP, et al.
Evolutionary and dispersal history of Eurasian house mice Mus musculus clarified by more extensive geographic sampling of mitochondrial DNA. Heredity. 2013;111(5):375–90.
14. Cucchi T, Eszter Kovács Z, Berthon R, Orth A, Bonhomme F, Evin A, et al. On the trail of Neolithic mice and men towards Transcaucasia: zooarchaeological clues from Nakhchivan (Azerbaijan). Biol J Linn Soc. 2013;108:917–28.
15. Duplantier J-M, Orth A, Catalan J, Bonhomme F. Evidence for a mitochondrial lineage originating from the Arabian peninsula in the Madagascar House Mouse (Mus musculus). Heredity. 2002;89:154–8.
16. Orth A, Belkhir K, Britton-Davidian J, Boursot P, Benazzou T, Bonhomme F. Hybridation naturelle entre deux espèces sympatriques de souris M. musculus domesticus L. et M. spretus Lataste. C R Biol. 2002;325:89–97. 17. Bonhomme F, Orth A, Cucchi T, Rajabi-Maham H, Catalan J, Boursot P, et al.
Genetic differentiation of the house mouse around the Mediterranean basin: matrilineal footprints of early and late colonization. Proc R Soc B. 2011;278:1034–43.
18. Orth A, Lyapunova E, Kandaurov A, Boissinot S, Boursot P, Vorontsov N, et al. L’espèce polytypique Mus musculus en Transcaucasie. C R Biol. 1996;319:435–41.
19. Ihle S, Ravaoarimanana I, Thomas M, Tautz D. An analysis of signatures of selective sweeps in natural populations of the house mouse. Mol Biol Evol. 2006;23:790–7.
20. Din W, Anand R, Boursot P, Darviche D, Dod B, Jouvin-Marche E, et al. Origin and radiation of the house mouse: Clues from nuclear genes. J Evol Biol. 1996;9:519–39.
21. Rajabi-Maham H, Orth A, Bonhomme F. Phylogeography and postglacial expansion of Mus musculus domesticus inferred from mitochondrial DNA coalescent, from Iran to Europe. Mol Ecol. 2008;17:627–41.
22. Auffray J-C, Orth A, Catalan J, Gonzalez J, Desmarais E, Bonhomme F. Phylogenetic position and description of a new species of subgenus Mus (Rodentia, Mammalia) from Thailand. Zool Scr. 2003;32:119–27. 23. Cucchi T, Orth A, Auffray J-C, Renaud S, Fabre L, Catalan J, et al. A new
endemic species of the subgenus Mus (Rodentia, Mammalia) on the Island of Cyprus. Zootaxa. 2006;1241:1–36.
24. Teschke M, Mukabayire O, Wiehe T, Tautz D. Identification of selective sweeps in closely related populations of the house mouse based on microsatellite scans. Genetics. 2008;180:1537–45.
25. Ihle S. Detecting genes involved in selective sweeps within populations of the house mouse species complex-a multi-locus candidate gene approach. PhD thesis. University of Cologne;2004. http://kups.ub.uni-koeln.de/view/cre-ators/Ihle=3ASonja=3A=3A.html.
26. Darvish J, Orth A, Bonhomme F. Genetic transition in the house mouse, Mus musculus of Eastern Iranian Plateau. Folia Zool. 2006;55:349–57.
27. Pritchard JK, Stephens M, Donnelly P. Inference of population structure using multilocus genotype data. Genetics. 2000;155:945–59. 28. Evanno G, Regnaut S, Goudet J. Detecting the number of clusters of
individuals using the software STRUCTURE: a simulation study. Mol Ecol. 2005;14:2611–20.
29. Gao H, Bryc B, Bustamente CD. On Identifying the optimal number of population clusters via the deviance information criterion. PLoS One. 2011;6:e21014. doi:10.1371/journal.pone.0021014.
30. Nunome M, Ishimori C, Aplin KP, Tsuchiya K, Yonekawa H, Moriwaki K, et al. Detection of recombinant haplotypes in wild mice (Mus musculus) provides new insights into the origin of Japanese mice. Mol Ecol. 2010;19:2474–89. 31. Karn RC, Orth A, Bonhomme F, Boursot P. The complex history of a gene proposed to participate in a sexual isolation mechanism in house mice. Mol Biol Evol. 2002;19:462–71.
32. Duvaux L, Belkhir K, Boulesteix M, Boursot P. Isolation and gene flow: inferring the speciation history of European house mouse. Mol Ecol. 2011;20:5248–64.
33. Siahsarvie R, Auffray J-C, Darvish J, Rajabi-Maham H, Yu HT, Agret S, et al. Patterns of morphological evolution in the mandible of the house mouse Mus musculus (Rodentia: Muridae). Biol J Linn Soc. 2012;105:635–47. 34. Staubach F, Lorenc A, Messer PW, Tang K, Petrov DA, Tautz D. Genome
patterns of selection and introgression of haplotypes in natural populations of the house mouse (Mus musculus). PLoS Genet. 2012;8:e1002891. doi:10.1371/journal.pgen.1002891.
35. Phifer-Rixey M, Bomhoff M, Nachman M. Genome-wide patterns of differentiation among house mouse subspecies. Genetics. 2014;198:283–97. 36. Baird SJE, Macholan M. What can the Mus musculus musculus/M. m.
domesticus hybrid zone tell us about speciation? In: Macholán M, Baird SJE, Munclinger P, Piálek J, editors. Evolution of the House mouse (Cambridge Studies in Morphology and Molecules: New Paradigms in Evolutionary Biology). UK: Cambridge University Press; 2012. p. 334–72.
37. Thomas M, Moeller F, Wiehe T, Tautz D. A pooling approach to detect signatures of selective sweeps in genome scans using microsatellites. Mol Ecol Notes. 2007;7:400–3.
38. Bayer T. Duplicated genes and their relevance in the process of speciation. PhD thesis. University of Cologne;2009. http://kups.ub.uni-koeln.de/2751/. 39. Belkhir K, Borsa P, Chikhi L, Raufaste N, Bonhomme F. GENETIX 4.05, logiciel
sous Windows TM pour la génétique des populations. Laboratoire Génome, Populations, Interactions, CNRS UMR 5171. Montpellier (France): Université de Montpellier II; 1996.
40. Excoffier L, Lischer HEL. Arlequin suite ver 3.5: A new series of programs to perform population genetics analyses under Linux and Windows. Mol Ecol Resour. 2010;10:564–7.
41. Felsenstein J. PHYLIP (Phylogeny Inference Package) version 3.6. Distributed by the author. Seattle: Department of Genome Sciences, University of Washington; 2005.
42. Langella O. Populations, 1.2.30 Copyright (C). CNRS UPR9034; 1999. Available at http://bioinformatics.org/~tryphon/populations/.
43. Tamura K, Stecher G, Peterson D, Filipski A, Kumar S. MEGA6. Molecular Evolutionary Genetics Analysis Version 6.0; 2013 http://www.megasoftware. net/.
44. Earl DA, von Holdt BM. STRUCTURE HARVESTER: a website and program for visualizing STRUCTURE output and implementing the Evanno method. Conserv Genet Resour. 2012;4:359–61.
45. Jakobsson M, Rosenberg NA. CLUMPP: a cluster matching and permutation program for dealing with label switching and multimodality in analysis of population structure. Bioinformatics. 2004;23:1801–6.
46. Rosenberg NA. Distruct: a program for the graphical display of population structure. Mol Ecol Notes. 2004;4:137–8.
47. Tamura K, Nei M. Estimation of the number of nucleotide substitutions in the control region of mitochondrial DNA in humans and chimpanzees. Mol Biol Evol. 1993;10:512–26.
Submit your next manuscript to BioMed Central and take full advantage of:
• Convenient online submission
• Thorough peer review
• No space constraints or color figure charges
• Immediate publication on acceptance
• Inclusion in PubMed, CAS, Scopus and Google Scholar
• Research which is freely available for redistribution
Submit your manuscript at www.biomedcentral.com/submit