HAL Id: hal-03137549
https://hal.archives-ouvertes.fr/hal-03137549
Submitted on 26 Feb 2021
Fatmir Guri, Ilir Kapaj, Bahri Musabelliu, Maksim Meço, Eneida Topulli,
Remzi Keco, Natasha Hodaj, Shpresim Domi, Gentjan Mehmeti, Sergio
Gomez
To cite this version:
Fatmir Guri, Ilir Kapaj, Bahri Musabelliu, Maksim Meço, Eneida Topulli, et al.. Characteristics of farming systems in Albania. [Research Report] 978-92-79-48387-5, Joint Research Centre,Institute for Prospective Technological Studies. 2015, pp.190. �hal-03137549�
Fatmir Guri,
Ilir Kapaj,
Bahri Musabelliu,
Maksim Meço,
Eneida Topulli,
Remzi Keco, Natasha Hodaj,
Shpresim Domi,
Gentjan Mehmeti,
Sergio Gomez y Paloma
2 0 1 5
Characteristics of farming
systems in Albania
Characteristics of farming systems in
Albania
J R C S C I E N C E A N D P O L I C Y R E P O R T S
LF-NA-27260-EN-N
As the Commission’s in-house science service, the Joint Research Centre’s mission is to provide EU policies with independent, evidence-based scientific and technical support throughout the whole policy cycle.
Working in close cooperation with policy Directorates-General, the JRC addresses key societal challenges while stimulating innovation through developing new methods, tools and standards, and sharing its know-how with
the Member States, the scientific community and international partners. Serving society
Stimulating innovation JRC Mission
European Commission Joint Research Centre
Institute for Prospective Technological Studies
Contact information
Address: Edificio Expo. c/ Inca Garcilaso, 3. E-41092 Seville (Spain) E-mail: jrc-ipts-secretariat@ec.europa.eu Tel.: +34 954488318 Fax: +34 954488300 https://ec.europa.eu/jrc https://ec.europa.eu/jrc/en/institutes/ipts Legal Notice
This publication is a Technical Report by the Joint Research Centre, the European Commission’s in-house science service. It aims to provide evidence-based scientific support to the European policy-making process. The scientific output expressed does not imply a policy position of the European Commission.Neither the European Commission nor any person
acting on behalf of the Commission is responsible for the use which might be made of this publication.
JRC95833
EUR 27260 EN
ISBN 978-92-79-48387-5 (PDF)
ISSN 1831-9424 (online)
doi:10.2791/967875
Luxembourg: Publications Office of the European Union, 2015
A great deal of additional information on the European Union is available on the Internet. It can be accessed through the Europa server http://europa.eu.
How to obtain EU publications
Our priced publications are available from EU Bookshop (http://bookshop.europa.eu), where you can place an order with the sales agent of your choice.
The Publications Office has a worldwide network of sales agents.
You can obtain their contact details by sending a fax to (352) 29 29-42758.
European Commission
EUR 27260 EN – Joint Research Centre – Institute for Prospective Technological Studies
Title: Characteristics of farming systems in Albania
Authors: Fatmir Guri, Ilir Kapaj, Bahri Musabelliu, Maksim Meço, Eneida Topulli, Remzi Keco, Natasha Hodaj, Shpresim Domi, Gentjan Mehmeti, Sergio Gomez y Paloma
Luxembourg: Publications Office of the European Union
2015 – 186 pp. – 21.0 x 29.7 cm
EUR – Scientific and Technical Research series –ISSN 1831-9424 (online)
ISBN 978-92-79-48387-5 (PDF)
doi:10.2791/967875
Abstract
This report is based on information collected from a face-to-face survey of more than 1 000 farmers from three regions of Albania (namely Berat, Elbasan and Lezhë). To identify a representative sample of Albanian farming systems, a three-step sample design was used. A group of 11 variables dealing with the socio-economic characteristics of farms was selected to build up the farming system typology. Two typologies are used: one for the whole sample (three regions) and a second one for each region. The differences between the two typologies are considered to be a proxy indicator of different characteristics of farming systems in
Characteristics of
farming systems in
Albania
Fatmir Guri
1, Ilir Kapaj², Bahri Musabelliu²,
Maksim Meço², Eneida Topulli², Remzi Keco², Natasha
Hodaj², Shpresim Domi², Gentjan Mehmeti²,
Sergio Gomez y Paloma
11European Commission, Joint Research Centre, Institute for Prospective Technological
Studies, Seville, Spain
²Agricultural University of Tiranë, Faculty of Economics and Agro-business, Tiranë, Albania
Contents
1. Preface 9
2. Executive summary 11
3. Introduction 13
4. Characteristics of Albanian agriculture and methodological issues 15
4.1 Characteristics of Albanian agriculture 15
4.1.1 General information 15
4.1.2 The importance of the agriculture sector 17
4.1.3 Farm structure 18
4.1.4 Production characteristics 19
4.1.5 Agricultural policy framework 22
4.2 Farm typology in Albania 22
4.2.1 Introduction 22
4.2.2 Is a typology really needed in Albania? 23
5. Methodology 27
5.1 The sample design 27
5.1.1 Selection of three representative regions (prefectures) 27
5.1.2 Farm selection 31
5.1.3 Regional up-scaling 33
5.2 Farm household typology 33
5.2.1 Farm household typology indicators in Albania 33
5.2.2 Clustering farms 34
5.2.3 Cluster analysis 36
5.3 Methodology of farm viability analysis 36
5.3.1 Farm net income calculation 36
5.3.2 The farm type viability analysis 38
6. The farm typology results 39
6.1 Sample analysis results 39
6.2 The cluster analyses on a regional level 41
6.2.2 Farm typology for the Elbasan region 43
6.2.3 Farm typology for the Lezhë region 45
6.2.4 Comparison of sample-based and region-based farm typology 47
7. Elbasan region: agricultural characteristics 49
7.1 Administrative organisation 49
7.2 Description of the natural resources and geography 50
7.2.1 Land area 50
7.2.2 Natural resources 50
7.2.3 Population 50
7.3 Socio-economic situation 52
7.3.1 Economic development 52
7.3.6 Land structure and farms size 56
7.3.7 Irrigation 57
7.3.8 Equipment and tool inputs 58
7.3.9 Farm agricultural production structure 58
7.3.10 Livestock production structure 59
7.3.11 Income and cost 61
7.4 Analysis of farm economic performance 63
7.4.1 Farm productivity 63
7.4.2 Farm viability 64
7.5 Conclusions 66
8. Berat region: agricultural characteristics 67
8.1 Geographical characteristics 67
8.1.1 Berat district 68
8.1.2 Kuçovë district 68
8.1.3 Skrapar district 68
8.2 Rural and urban infrastructure 68
8.2.1 Economy, infrastructure and geography 68
8.2.2 Economic development of the region 70
8.3 Agricultural development of the region 70
8.3.1 Farms and production capacities 70
8.3.2 Farms and development of agricultural activities 71
8.3.3 Family structure 72
8.3.4 Farm structure 73
8.3.5 Irrigation 74
8.3.6 Equipment and tool inputs 75
8.3.7 Extra-farm activities 76
8.3.8 Crop production 77
8.3.9 Livestock production 78
8.3.10 Income and costs 81
8.4 Analysis of farm economic performance: Berat region 83
8.4.1 Farm productivity 83
8.4.2 Farm viability 85
8.5 Conclusions 86
9. Lezhë region: agricultural characteristics 87
9.1 General information about the region 87
9.2 Natural resources and geography 88
9.2.1 Land resources 88
9.2.2 Natural resources 88
9.3 Population 88
9.4 Socio-economic situation 89
9.4.1 Economic development 89
9.5 Analysis of the regional farm typology 89
9.5.1 Family structure 90
9.5.2 Farm structure 92
12. Annexes 107
12.1 Annexes 1 Farm household questionnaire 107
12.2 Annexes 2 Agenda and presentation of the first workshop 123
12.3 Annexes 3 Agenda and presentations of the second workshop 155
List of tables
Table 1: A non-exhaustive table of typologies applied in Albania 24
Table 2: Regional ranking 28
Table 3: Region selection 30
Table 4: Definition of the primary sampling units 31
Table 5: Area definition for each stratum 31
Table 6: Region sample 32
Table 7: The results of the Kaiser–Meyer–Olkim test and Bartlett’s sphericity test 35
Table 8: Method of calculation of work and land productivity 38
Table 9: The results of cluster analysis for the whole sample 39
Table 10: Farm typology for the Berat region 41
Table 11: Farm typology for Elbasan region 43
Table 12: Farm types for Lezhë 45
Table 13: Statistically important variables for the whole sample and for regions 47
Table 14: The farm types for the sample and for each region 48
Table 15: Districts and distribution of questionnaires 52
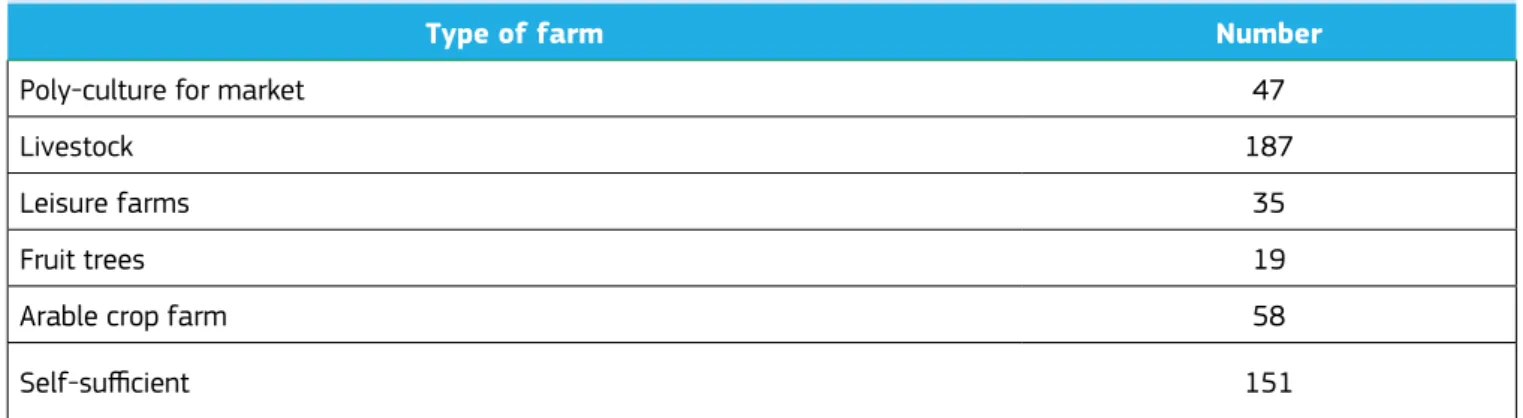
Table 16: Types of farms and their number identified in the region of Elbasan 52
Table 17: The land use in Berat region (ha) 68
Table 18: Poverty indicators, Berat 2012 70
Table 19: Agricultural production evaluated by sector and activities for 2012 71
Table 20: Number of different types of farm machinery owned 75
Table 21: Income structure by farm type in Berat region (ALL) 83
Table 22: Districts and number of questionnaires returned 89
Table 23: Farm structure (land) 92
Table 24: Surface measurement units 119
Table 25: Agricultural crops (Q) 120
List of boxes
Box 1: Main indicators of the Albanian economy 15
Box 2: Farm household income calculation 37
List of figures
Figure 1: Agro-ecological areas in Albania 16
Figure 2: The structure of Albania’s gross domestic product in 2011 17
Figure 3: Farm size (ha) for 2012 and sales income distribution (value) 18
Figure 4: Distribution of livestock production (in value) for 2000 and 2012 19
Figure 5: Breakdown of harvested area by main crops for 2000, 2005 and 2012 20
Figure 6: Breakdown of the value of crop production for 2000 and 2012 21
Figure 7: Import–export ratio over the period 2000–2012 21
Figure 8: The development of fruit tree production (1996–2012) and greenhouse area (2006–2012) by region 23
Figure 9: Region classification 29
Figure 10: Sample distribution at commune level 32
Figure 11: The dendogram of cluster analysis 36
Figure 12: Regional representation of farm typology 40
Figure 13: Proportion of each farm type in Berat 42
Figure 18: Population trend in Elbasan region 2001–2013. 51
Figure 19: Farm family structure 53
Figure 20: Education level of farmers 53
Figure 21: Education level according to typologies 54
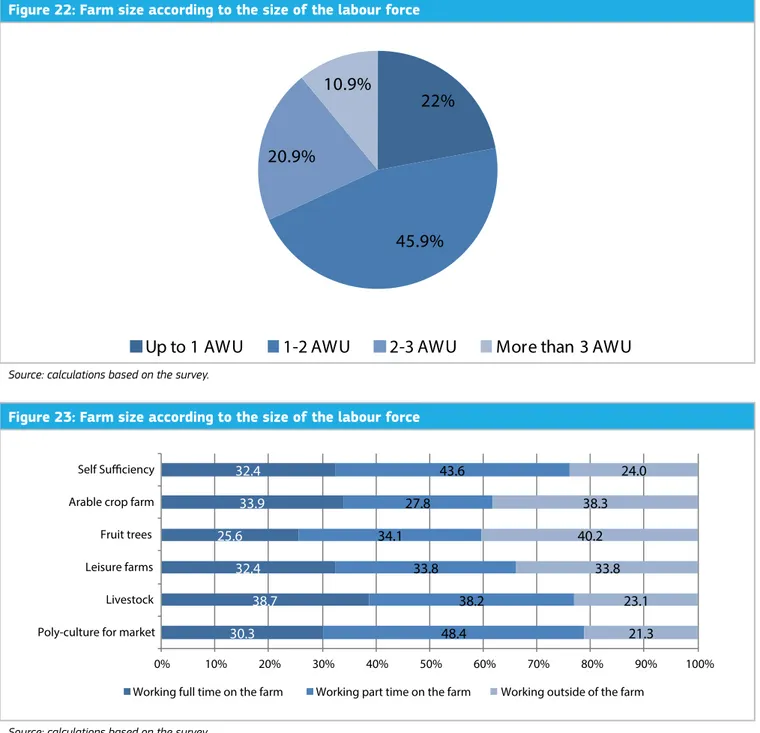
Figure 22: Farm size according to the size of the labour force 55
Figure 23: Types of farm labour according to typology 55
Figure 24: Farm size and number of plots 56
Figure 25: Farm size according typologies 56
Figure 26: Percentage of farms using irrigation within cluster 57
Figure 27: Crop production structure (in value) among farm types as a proportion of total agricultural production 58
Figure 28: Livestock production structure (% of farms within cluster) 59
Figure 29: Livestock production structure (% of farms among clusters) 59
Figure 30: Structure of livestock production in value (as percentage of total livestock production) 60
Figure 31: Farm net income and off-farm net income and their proportion of the total household income 61
Figure 32: Farm main expenditure structure in absolute values per hectare 62
Figure 33: Means of financing farm expenditure 62
Figure 34: Farm net income/annual work unit 63
Figure 35: Farm net income/utilised agricultural area (ALL) 64
Figure 36: Annual work unit repayment as a proportion of the minimum wage 64
Figure 37: Extreme poverty level analysis in terms of farm net income and total household income per household member 65
Figure 38: Map of Berat region 67
Figure 39: Land use structure in Berat region 69
Figure 40: Structure of the cultivable area in Berat region 69
Figure 41: Percentage of farms according to size, within the district 70
Figure 42: Family farm structure 72
Figure 43: Average farm size (dyn) and average number of plots per farm 73
Figure 44: Farm size according to the clusters (in %) 73
Figure 45: Use of irrigation according to cluster (%) 74
Figure 46: Average non-farm incomes (ALL) among the farm types 76
Figure 47: Farms according their activities and clusters 77
Figure 48: Structure of sales (ALL/farm) 78
Figure 49: Structure of livestock production in terms of value 79
Figure 50: Livestock production structure (% of farms within cluster) 79
Figure 51: Proportion of farms selling milk by farm type (percentage of total farms within farm types) 80
Figure 52: Meat sold by farm type (%) 81
Figure 53: Farm net income and off-farm net income as a proportion of total household income 81
Figure 54: The structure of family expenditure 82
Figure 55: Farm net income per annual work unit 84
Figure 56: Farm net income per utilised agricultural area 84
Figure 57: Annual work unit repayment 85
Figure 58: Farm net income/total household income per household member and extreme poverty 86
Figure 59: Map of Lezhë region 87
Figure 60: Population trend: years 2001–2013 88
Figure 61: Proportion of farms in each region 89
Figure 62: Farm family structure for each cluster 90
Figure 63: Number of farms and the level of education of the farmers 91
Figure 75: Farm net income/total household income per household member and extreme poverty 100
Figure 76: The full poverty line 100
Figure 77: Farm net income per utilised agricultural area 101
List of abbreviations
AWU: annual work unit
Dyn: surface measure used in Albania, 1dyn=0.1 ha FNI: farm net income
GDP: gross domestic product HM: household family members IC: input costs
INSTAT: Albanian Institute of Statistics
MAFCP: Ministry of Agriculture, Food and Consumer Protection MBUMK:- Ministria e Bujqësisë Ushqimit dhe Mbrojtjes Konsumatore MW: minimum wage
OV: output value Exchange rate EUR 1 = ALL 139.38
P r e f a c e
Over the past 20 years, Albanian agriculture has undergone fundamental changes in terms of its structure, the organisation of the production units and the distribution of products and trading. As a consequence, analysis of the effects that these changes impose on the efficiency of the sector continues to be the subject of scientific research. Analysis of agricultural production systems is part of agricultural economy research, in which researchers must analyse information from one or more farms in order to draw comprehensive conclusions and form a clear picture of the agricultural structure of a country and its effects on the domestic economy. This analysis, whose conclusions are based on information pertaining not only to entities with different organisational structures but with very similar objectives, is probably the only way to understand the characteristics of production at the farm level, which is the most important unit in agricultural production in Albania today. The sub-sectors of the food chain beyond the farm, such as the agricultural inputs sector, collection systems and agro-processing, cannot be understood without a good knowledge of agricultural production characteristics and farm structure.
At the same time, a significant proportion of the country’s population lives in rural areas. Although the analysis of living conditions, welfare, educational opportunities and employment is very often conducted geographically, it is farms and farming families that constitute the basic socio-economic unit upon which is based any social initiative in rural areas.
All these factors combine to make the farm the basic unit of analysis: the farm is most important subject addressed by our policies, and the one that we expect to benefit from the policies. Therefore, for us, it is very important to understand the characteristics of farms operating today in Albania and to gain an appreciation of their production capabilities, taking into account the limited natural resources at their disposal, the state of the agricultural infrastructure and the techniques and technologies in use. Furthermore, it is important for us to understand which markets are addressed by farms, and above all farmers, to help us support progressive farmers:
those farmers who see their future in agriculture as a choice and not as an obligation and those who understand that the problems they face cannot be solved alone and that having the courage to join other farmers in collective action can promote the adoption of new, more productive, technologies in order to cultivate larger areas. This is the way towards a more prosperous future.
The information need for such an analysis, which is so difficult to collect and process, enables a more detailed examination of production systems at the farm level. This is exactly the objective of the project ‘Impact of policy instruments in Albanian agricultural systems’. This project was initiated by the European Commission Joint Research Centre Institute for the Study of Technological Perspectives in collaboration with the Faculty of Economy and Agribusiness at the Agricultural University of Tiranë. Through the analysis of data collected in three regions representative of agricultural systems in the country, obtained from more than 1 000 questionnaires on the characteristics of farm production methods, costs and technologies in use, agriculture experts will be able to provide the information needed by policy makers to design and implement policies that will provide more effective support schemes for agriculture.
The Albanian government is adopting a new strategy in terms of developing policies to support agriculture. It will no longer provide supporting instruments, with their associated positive and negative outcomes; instead, it is now time to move forward and to directly support agricultural products and to give farmers access to wholesale and retail markets, the food industry and, ultimately, the consumer. By doing so, farmers will be rewarded for their physical and financial investments, giving them an inventive to produce more and to bring their products to markets and consumers. It is the duty of public institutions to encourage those who already do this to do it even better and those who do not to begin to reflect on how they might move out of subsistence conditions. Of course, this product support scheme will not be complete unless it is accompanied by support for productive investments that aim to provide incentives not only to produce, but also to orient these products towards markets.
This new phase of agricultural policy instruments in Albania will require in-depth analysis to determine the most appropriate policies to be applied. Furthermore, the effects of the policy instruments must be the subject of a similar level of analysis and must rely on methods, such as those we are discussing here. Thank you for the work you have done; we await with great interest the results of your
analysis, and I hope that this will be a long-term cooperation, particularly for the ex ante analysis of agricultural policy instruments that are expected to be implemented soon. I wish you a distinguished and fruitful meeting. Please be assured that, in the future, the Ministry of Agriculture, Rural Development and Water Management will be an effective collaborator in projects of such interest and value to the country’s agriculture.
E x e c u t i v e s u m m a r y
Agriculture is one of the most important economic sectors in Albania. It contributes 13 % of the national gross domestic product (GDP) (INSTAT, 2011) and employs nearly half of the national workforce (2011). According to the European Commission, around 500 000 people work in agriculture, of whom 55 % work full time and 45 % part time (EC 2010).
During the economic transition, Albania’s agriculture sector
changed significantly. This process continues in parallel with global trends, interspersed with periods of relative consolidation.
According to MACFP (2011), agricultural land covers only 24 % (or nearly 700 000 ha) of the total land surface: 54 % of the area is covered by forests, meadows, pastures, etc., and the rest (22 %) is used for other purposes (e.g. urban areas). The figure for agricultural area per inhabitant in Albania is low (only 0.370 ha/inhabitant), such that the country ranks 120 out of 220 worldwide (FAO 2014). Most agricultural land is owned by rural households (80 % of total agricultural area or 562 000 ha) and the rest (134 000 ha)
is owned by the state (1) (MAFCP 2011).
The geography of Albania is more suitable for livestock production than for crop production. In 2012, the livestock sector accounted for 54 % of the total production value and crop production for 46 % (INSTAT 2012). Crop production is more important in the so-called Western plain (the regions of Durrës, Tiranë and Fier) and the region of Korçë, characterised by significant mountainous areas but also the second most important agricultural plain in the country. The other regions of the country are characterised by a higher proportion of livestock production.
According to the figures released by Albanian Institute of Statistics, the number of farms has decreased from more
than 350 000 to 325 000 (EC 2013) (2). Farms in Albania
are characterised by limited arable land and a high level of fragmentation. In the last 10 years, the average farm size has increased by 15 % (from 1.04 ha in 2002 to 1.20 ha in 2012) (INSTAT 2012) but is still remain extremely small. The average plot size in 2012 was only 0.26 ha. On average,
1 The areas owned by the state (134 000 ha) are generally land of low fertility that were rejected by households during the de-collectivisation process.
2 The detailed set of indicators will provide further information about the type(s) of
farms have more than four plots (4.5 plots (MAFCP 2011)), and sometimes these are several kilometres from each other. Direct support for production relies mainly on subsidies aiming to increase production and food-processing capacities. The strategic sectors are permanent crops (olives, nuts and other permanent crops), technology and infrastructure (greenhouses, irrigation on a small scale, new technologies, etc.) and food-processing sector standards and increased capacity.
This report is based on information collected from a face-to-face survey of more than 1 000 farmers from three regions of Albania (namely Berat, Elbasan and Lezhë). The extensive questionnaire used in the survey elicited information on:
•
the household;•
the agricultural work offered (family and hired labourdistributed by month);
•
the farm (arable land, irrigation, plot characteristics,agricultural mechanics);
•
agricultural activities (crop by plot and livestock production,crop rotations for at least 3 years);
•
destination of agricultural products and agriculturalincomes (self-consumption, sales, processing, stock, etc.);
•
technical data about each crop activity and each livestockproduction (list of detailed costs for each production);
•
agricultural support schemes;•
credit;•
distribution of expenses.To identify a representative sample of Albanian farming systems, a three-step sample design was used. Firstly, Albanian regions were stratified into three non-overlapping strata, each the size of four regions. Each stratum included regions that have similar agricultural characteristics according to several indicators. The selected indicators were used to rank the Albanian regions according to their share. From each stratum a region was selected by applying
Executive summary
indicators of farming systems diversification. To select the farmers in each region, a multi-stage sampling method was used, having as the main variable ‘the area’ (area sampling frame methodology). This methodology is widely used in agricultural surveys in Albania.
A group of 11 variables dealing with the socio-economic characteristics of farms was selected to build up the farming system typology. Two typologies are used: one for the whole sample (three regions) and a second one for each region. The differences between the two typologies are considered to be a proxy indicator of different characteristics of farming systems in each region. The farm types identified are (1) poly-culture, mainly for the market; (2) leisure farms; (3) arable crops; (4) fruit trees; (5) self-sufficient; and (6) livestock. The farm typology is slightly different for the regions of Berat and Lezhë.
The farm types’ strategies are constructed according to the land, infrastructure facilities and the investment availability of farms. Non-agricultural incomes (remittances, income
from the construction, trade, pensions, etc.) appear to provide an important economic support for the farm household. Farming structures in rural areas are characterised by the use of more labour and lower inputs. The farm types that tend to specialise in one activity are not always those that make the best use of labour and land.
Farming does not provide enough income to repay the work put in at the official minimum wage level. Non-agricultural work is better paid. Albanian farms provide at least a minimal income that is enough to keep the household members above the threshold of extreme poverty.
The farm types that base their incomes on agricultural activities are poorer than those that base their income on non-agricultural activities. Income structures and the low incomes generated by work in agriculture suggests that rural migration towards urban areas and abroad is a phenomenon that will persist into the future.
3 . I n t r o d u c c t i o n
Agriculture is one of the most important economic sectors in Albania. It contributes 13 % of the national GDP (INSTAT, 2011), and employs nearly half of the national workforce (2011). According to the European Commission (2010), around 500 000 people work in agriculture, of whom 55 % work full time and 45 % part time (EC 2010).
Albania is a net food importer. According to INSTAT (2011), the Albanian import–export ratio of foodstuffs is 8:1. The main export destinations and import origin countries are the EU Member States Italy, Germany, Greece and Austria for exports (71.4 %), and Italy, Greece, France and Poland for imports (50 %) (MBUMK 2012). The majority of Albanian foodstuff exports come from the agro-processing sector, which accounts for more than 55 % of total exports (2011), with 34 % from agriculture and the rest (10 %) from livestock (MBUMK 2012). The main exporting sectors are medicinal and aromatic herbs, tobacco, fresh vegetables, processed fish and animal hides. Food-processing sector imports comprise 61 % total agricultural imports, 26 % agricultural products and 11 % livestock. Despite the increase over the last 10 years in self-sufficiency in some products (eggs, some fresh vegetables, milk, fruit, etc.), Albania remains a net importer of foodstuffs.
The Mediterranean climate of the country allows a wide range of farming activities. According to Cela et al. (2010) the majority of the utilised agricultural area (UAA) is planted with fodder crops (49 % of UAA), followed by cereals, accounting for 37 % of UAA; the rest is planted with vegetables, potatoes and other crops. Over the last 10 years, the area of fodder crops has become more and more important to the detriment of cereals (especially wheat), which are decreasing. This is due to the importance of the livestock sector (52 % of total agricultural production in 2010).
The average yields of the main agricultural products have increased significantly over the last decade but, nevertheless, they remain below the EU average (Volk, Rednak et al. 2010). During the period 2000–2008 the average wheat yield increased 33 % and milk yield increased 2.5-fold. The same trend could be also observed for other agricultural activities (vegetables, apples, stone fruit, olives, cattle meat, etc.) (Cela, Marku et al. 2010).
The de-collectivisation process has had a significant impact on Albanian agriculture, and this has led to considerable land
fragmentation (3.8 parcels/farm) and an increase in small and very small subsistence and semi-subsistence farms (1.2 ha), which are impeding the development of the sector (Civici 2003; Guri, Civici et al. 2011).
The farm structures and the level of fragmentation make it difficult to make use of a large-scale agricultural infrastructure, especially in hilly and mountainous areas. The land insecurity, the delay in compensating former landowners and the lack of appropriate policy instruments discourages farmers from increasing farm sizes (only 10 % in 5 years) (Civici 2003; MBUMK 2012).
In addition to land fragmentation, Albanian agriculture suffers from some critical structural problems, such as (1) underdeveloped irrigation and drainage systems; (2) deficient infrastructure; (3) restricted access to markets; (4) an underdeveloped agri-food industry; (5) low levels of technology; (6) the weakness of farmers’ organisations; and (7) limited access to credit (EC 2010).
The overall objective of this report is to analyse the key
characteristics of farming systems in Albania, their typology and their actual and potential role in the well-being of farming households.
The focus should therefore be on the future prospects and challenges for Albanian agriculture by analysing the following
specific aspects:
(i) farming systems;
(ii) food production, consumption and surpluses;
(iii) economic drivers and the productivity of the different farm types.
The main contribution of the report is the analysis of the farming systems in Albania and their viability in terms of farm net income (FNI) provided for the household family and to highlight the most efficient farming systems in terms of land and labour productivity. The report presents the analysis of farm viability in terms of reproduction threshold presented on farm type level.
The report is a product of the workshop ‘The impact of policy instruments on the farming systems in Albania’, which
3. Introduction
was took place two parts: ‘General overview of Albanian agriculture and methodological tools’, held in August 2013 in Seville, Spain; and ‘Characteristics of the Albanian farming
households and the effects of policy instruments’, which took place in March 2014 in Tiranë, Albania.
4 . C h a r a c t e r i s t i c s o f A l b a n i a n a g r i c u l t u r e a n d m e t h o d o l o g i c a l i s s u e s
4.1 Characteristics of Albanian
agriculture
4.1.1 General information
Albania is a Mediterranean country with an area of 28 748 km² and a population of 2.78 million, of whom 45 % still live in rural areas (INSTAT 2014).
Albania has a sub-tropical Mediterranean climate characterised by mild and rainy winters and hot, dry summers (MAFCP 2011). The rain (on average 1 485 mm/ year) falls mainly (70 %) during the cold months (October– March) (MAFCP 2011). Being a mountainous country (only 24 % of the surface is plain (MAFCP 2011)), the agricultural area has an elevated slope and only 44 % of the total arable area has a slope of 5 % or less (MAFCP 2011). The Box 1 shows the main indicators of the Albanian economy.
4. Characteristics of Albanian
agriculture and methodological
issues
Box 1: Main indicators of the Albanian economy
Albania is a middle-income country that has made enormous strides in establishing a credible multi-party democracy and market economy over the last two decades (WB 2013). The Albanian economy has been characterised by a macroeconomic stability and positive economic growth, even during the recent economic crisis. Between 2002 and 2008, poverty in the country fell by half (to about 12.4 %) and extreme poverty now affects less than 2 % of the population (WB 2013).
Main macro-economic indicators for Albania
2009 2010 (estimated)2011 2012 (projected)
Real GDP growth rate (%) 3.3 3.5 3 0.5
Consumer price index (average) 2.2 3.6 3.4 2.2
Public debt (percentage of the GDP) 59.3 57.8 58.6 60.9
Trade balance (goods and services)
(percentage of the GDP) –24.6 –20.7 –22.4 –18.8
Nominal GDP (in billions of ALL) 1 151 1 237 1 319 1 357
GDP/inhabitant (ALL) 397 145 430 947 463 959 481 932
GDP/inhabitant (EUR) 2 829 3 069 3 305 3 433
According to the International Monetary Fund (IMF), Albania will experience positive economic growth in 2014 of 2.4 % (IMF 2013).
According to Cela et al. (2010), the agricultural area in Albania can be divided into three main types.
The plain areas (24 % of the land area (MAFCP 2011)) are located at an altitude of less than 180 m. These areas are characterised by mild winters (average temperature in January 9.8 °C) and hot summers. The annual rainfall is 800–1 000 mm/year, but it is not equally distributed between the winter and summer months (only 10 % of rain falls in summer).
Hilly areas are located at an altitude above 180 m but below 800 m (45 % of the land area). The average temperature is lower (by 3–4 °C on average) than in the plain and frosts are frequent in winter. This agricultural area is important for its potential production, especially in the south-eastern part of the country (the plain of Korça).
The third type of agricultural area is the mountainous area (26 % of the land area), located above 800 m. In these
areas, most of the land is covered by forests and permanent pastures. The arable area is limited.
According to Sutton et al. (2013), the Albanian territory can be divided into four agro-ecological zones. Each zone has the same characteristics in terms of terrain, climate, soil type and water availability (Figure 1).
The plain areas that are typical of the western part of the country falls into the intermediate agro-ecological zone that links the plain area and the mountainous area. In this area the characteristics of both areas can be found (lowlands and mountainous areas). The third agro-ecological zone covers the mountainous areas of northern and central Albania, and the fourth covers the mountainous areas of southern Albania.
According to Shundi (2006), the main soil types in Albania are fertile alluvial soils in the coastal area, flysch and marls in the intermediate area and limestone, mainly in the mountainous areas.
Owing to the slope of the hilly and, particularly, the mountainous areas, an important proportion of agricultural land is subject to erosion or is at high risk of erosion: 70 % of the agricultural land is eroded at a rate of 30 t/year, 20 % is eroded at a rate of 5t/year and only 10 % of agricultural land is not affected by this phenomenon (Shundi 2006). Figure 1: Agro-ecological areas in Albania
4 . C h a r a c t e r i s t i c s o f A l b a n i a n a g r i c u l t u r e a n d m e t h o d o l o g i c a l i s s u e s
4.1.2 The importance of the agriculture sector
Agriculture remains one of the main economic sectors of the Albanian economy (IMF 2013). According to Cela et al. (2010), over the last 16 years, the contribution of agriculture to GDP has been decreasing, from 60.1 % in the 1950 to less than 20 % in the 2000s. In 2013, agriculture contributed only 10 % of GDP (INSTAT, 2014). Agriculture is characterised by growth rates that are more stable but less significant than those experienced by other economic sectors. Over the period 2000–2010, the average annual growth rate of the agriculture sector was 4 %, one third that of the construction sector
The tertiary sector is the main economic sector in Albania (Figure 2). Services account for more than half of Albanian GDP. Over the last 15 years (1997–2011), services and construction have been the main contributors to growth in GDP, although the construction sector has experienced a recession since 2003, with negative economic growth rates since 2008.
A significant proportion of the population lives in rural areas (45 % of total population). The rural population is dominated by the younger age groups and massive employment in agriculture (MAFCP 2011).
Figure 2: The structure of Albania’s gross domestic product in 2011
4.1.3 Farm structure
According to the MACFP (2011), agricultural land covers only 24 % (or nearly 700 000 ha) of the land area; a further 54 % is covered by forests, meadows, pastures, etc., and the rest (22 %) is used for other purposes (e.g. urban areas). The size of the agricultural area per inhabitant in Albania is low (only 0.370 ha/inhabitant), such that the country ranks 120 out of 220 worldwide (FAOSTAT). The majority of agriculture land is owned by rural households (80 % of total agricultural area or 562 000 ha) and the rest (134 000 ha) is owned by the
state (3) (MAFCP 2011).
According to the first figures released by Albanian Institute of Statistics from the most recent agricultural census, carried out in 2012, the number of farms decreased from more than 350 000 to 325 000 over 10 years (2000-2010)
(EC 2013) (4). Farms in Albania are characterised by a small
area of arable land and a high level of fragmentation. In the last 10 years, the average farm size has increased by 15 % (from 1.04 ha/farm in 2002 to 1.20 ha/farm in 2012) (INSTAT 2012), but it remains extremely low. The average plot size in 2012 was only 0.26 ha. On average, farms have more than four plots (4.5 plots (MAFCP 2011)), and sometimes these are several kilometres from each other.
Figure 3: Farm size (ha) for 2012 and sales income distribution (value)
4 . C h a r a c t e r i s t i c s o f A l b a n i a n a g r i c u l t u r e a n d m e t h o d o l o g i c a l i s s u e s
4.1.4 Production characteristics
The regions in the western part of the country (Fier, Vlorë, especially the district of Saranda) and the region of Korçë in the eastern part of the country are the main agricultural producers. The four most productive regions (Durrës, Fier, Vlorë and Korçë) account for more than half (55 %) of the agricultural production of the country but only 45 % of the arable area. This group of regions is responsible for more than 60 % of total crop sales. The less productive regions are those of the north-east (Kukës, Dibër), the region of Lezhë in the centre of the country and the region of Gjirokastër in the south of the country. These four regions produce only 14 % of the total national sales (crops and livestock) despite cultivating 21 % of the agricultural area. In terms of crop production, these regions account for less than 10 % of national crop sales. Mostly mountainous, these regions are characterised by steep slopes and low fertility of the agricultural land.
The geography of Albania is more suitable for livestock production than for crop production. In 2012, the livestock sector accounted for 54 % of the total production value and crop production for 46 % (INSTAT 2012). Crop production is more important in the so-called western plain (the regions of Durrës, Tiranë and Fier) and the region of Korçë, characterised
by significant mountainous areas but also the second most important agricultural plain in the country (see Figure 3). The other regions of the country are characterised by a higher proportion of livestock production.
The structure of livestock production has stabilised over the last 10 years (Figure 4). Between 2000 and 2012, livestock production was characterised by important contributions to meat and milk production (nearly 90 % of the value of total livestock production). Other products (honey, eggs) have also increased their contribution (from 9 % to 13 %) but remain less important.
Half of the arable area is cultivated with forage plants, thus increasing the importance of the livestock sector. The breakdown of the harvest for 2000 and 2012 (Figure 5) shows that in nearly 12 years fodder crops have replaced cereals, especially wheat. Wheat imports have steadily increased over the same period (INSTAT 2012; MBUMK 2012). The direct payment scheme applied to fruit trees, particularly olive trees and nuts, and significant private investments have in 10 years doubled the contribution of fruit trees to the value of agricultural production (from 22 % in 2000 to 40 % in 2012)(Figure 5). It seems that, in future, the contribution of fruit trees will increase when newly planted plantations enter into production.
Figure 4: Distribution of livestock production (in value) for 2000 and 2012
The transition in Albania is characterised by an improvement in the productivity of the main crops and livestock production, but productivity remains below the European Union average. The change in the yield of wheat over the last 12 years can be used as an example. Albanian wheat yield during this period (2002–2012) increased by more than one-third (34 %) but is still 20 % lower than the EU-27 average (INSTAT 2012; EUROSTAT 2014); the picture is the same for the milk production. According to Cela et al. (2010), Albanian agriculture still faces significant problems in terms of productivity. The breakdown of the crops value is presented in Figure 6.
Albania remains a net importer of food products (Figure 7). In 2012, Albania imported more than EUR 623 million of food products and exported more than EUR 92 million. Over the last 10 years, agricultural exports have accounted for, on average, only 11 % to 15 % of food imports. The
ratio has improved for 2012 owing to an increase in exports and a stabilisation of imports. Crop and livestock exports over the period 2010–2012 increased by 51 % and 67 %, respectively, whereas imports for the same period increased by only 13 % and 4 %, respectively.
The main Albanian agricultural exports are medicinal herbs and vegetables, tobacco, tinned fish and animal leather; the main imports are meat and meat products and fruit and vegetables. Albanian exports are niche products that require labour-intensive production methods (Cela, Marku et al. 2010). Albania is a world leader in production of some medicinal herbs (sage, thyme, etc.) (Cela, Marku et al. 2010). The traditional collection of wild sage is being replaced by cultivation of sage, creating new types of farming systems, especially in hilly and mountainous areas. The cultivation of sage has the potential to increase farm incomes in those areas where farms have a small area of low-quality land. Figure 5: Breakdown of harvested area share by main crops for 2000, 2005 and 2012
4 . C h a r a c t e r i s t i c s o f A l b a n i a n a g r i c u l t u r e a n d m e t h o d o l o g i c a l i s s u e s
Figure 6: Breakdown of the value of crop production for 2000 and 2012
Sources: MAFCP, 2011 INSTAT, 2012.
Figure 7: Import–export ratio over the period 2000–2012
4.1.5 Agricultural policy framework
The main policy instruments of the Albanian government intervention to handle some of these problems are provided in the agriculture and food sector strategy 2007–2013 (EC 2010). According to (Cela, Marku et al. 2010), the main objectives of the above strategy are (1) the development of sustainable agriculture; (2) the improvement of the livelihood of rural households; (3) an improvement in the economic efficiency of agriculture and the food industry; and (4) the improvement of agricultural markets, etc.
Direct support for production relies mainly on subsidies aiming to increase the production and food-processing capacities. The strategic sectors are permanent crops (olives, nuts and other permanent crops), technology and infrastructure (greenhouses, irrigation on a small scale, new technologies, etc.) and food-processing sector standards and increased capacity.
The first support measures for agriculture in Albania are relatively new (2007), with direct support for permanent crop plantations and for livestock production (sheep and cattle). In recent years the range of activities supported by these schemes has included production of nuts (chestnuts, walnuts), greenhouse construction and almost all livestock production, as well as the agro-industry sector.
As EC (2010) highlights, the ‘direct payments (5) in Albania
are not compatible with EU rules’. They are not decoupled and they have no environmental requirements and/or other types of ‘cross-compliance’ standards.
In 2014, the Albanian government added new policy instruments aiming to increase farmers’ participation in the fresh fruit and vegetable markets. Farmers can apply for extra direct support of 15 % of the product value for fruit and vegetables if the quantity sold to the wholesale markets, processing units and fresh fruit and vegetable collection centres is greater than 3 tonnes for fruits and 5 tonnes for vegetables, up to a limit of 30 tonnes and 50 tonnes, respectively.
4.2 Farm typology in Albania
4.2.1 Introduction
This report is based on information collected from a face-to-face survey of more than 1 000 farmers from three regions of Albania (namely Berat, Elbasan and Lezhë). The extensive questionnaire (see Annex 1) used in the survey elicited information on:
•
the household;•
the agricultural work offered (family and hired labourdistributed by month);
•
the farm (arable land, irrigation, plot characteristics,agricultural mechanics);
•
agricultural activities (crop by plot and livestock production,crop rotations for at least 3 years);
•
destination of agricultural products and agriculturalincomes (self-consumption, sales, processing, stock, etc.);
•
technical data sheet for each crop activity and eachlivestock production (list of detailed costs for each production);
•
agricultural support schemes;•
credit;•
distribution of expenses.The information gathered was processed in order to build up a farm system typology to understand the strategies of the farm systems, the impact of the agricultural policy instruments and the potential future evolution of Albanian agriculture.
The de-collectivisation process that took place in Albania during the 1990s totally reorganised the farming structure. The farming systems created by this reform are small and fragmented (Civici 2001; Civici 2003; Miluka, Carletto et al. 2007; Guri 2008; Deininger, Savastano et al. 2012; Zhllima and Guri 2013; Sikor and Müller 2009). The agricultural land area of nearly 700 000 ha is divided among more than 300 000 farming households, resulting in small farms of less than 1.30 ha on average. Moreover, these tiny areas are
4 . C h a r a c t e r i s t i c s o f A l b a n i a n a g r i c u l t u r e a n d m e t h o d o l o g i c a l i s s u e s
vegetables and fruit trees) and keep several types of livestock (a combination of sheep and goats in the mountainous areas and generally cattle in the lowland areas). Empirical studies show clearly that family is the major source of labour on Albanian farms and that the agricultural labour market is very small (Miluka, Carletto et al. 2007).
Twenty years on, the average land area per farm has improved slightly (by only 16.3 %, increasing from 1.04 ha at the beginning of 2000 to 1.21 ha in 2010) (MBUMK 2012), as has the average plot area (increased by only 1.2 %). Studies have shown that the land market is developed mainly for urbanisation purposes near urban and coastal areas (Guri and Jouve 2003; Guri 2008).
4.2.2 Is a typology really needed in Albania?
The structure of farms in Albania and the way in which these farms were created after de-collectivisation may lead to the conclusion that a farm typology is obsolete in Albania. The de-collectivisation process that ocurred in Albania in 1991 produced farms with similar land areas, soil quality, agricultural techniques, etc. Generally, farms are very small
and poorly equipped. The main objective of post-collective
agricultural farms was subsistence (6) (Kodderitzsch 1999).
The cropping and livestock pattern is based on cereals and vegetables, mainly for family consumption and sale of surpluses. This generalised situation left little room for, on the one hand, farmer-developed strategies and, on the other hand, adapted public policy instruments.
Twenty years later, many factors (geographical, infrastructure, non-agricultural income, introduction of new techniques, agricultural investments, etc.) have made it possible for different farms types to emerge in Albania. In general, the average UAA is still in the same range as it was in 1991, but the cropping pattern and strategies are quite different. Many farms in the western part of the country (Fier Lushnjë Kavaja, etc.) now specialise in vegetable and fruit production for the markets, with a corresponding reduction in the proportion of total production that goes to self-consumption. Other farms
are increasingly specialising in out-of-season production (7).
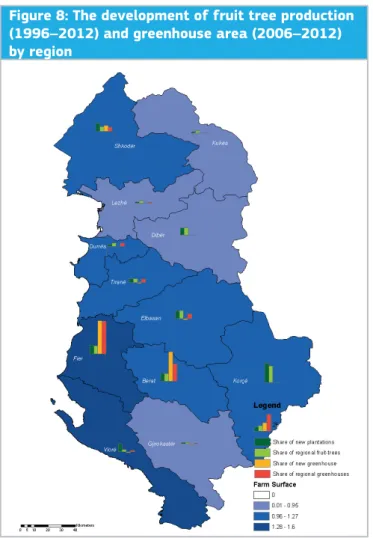
In other regions of the country livestock farming systems predominate. A good example of changing farming systems is the growth of the areas under fruit tree plantations and greenhouses (in hectares) in the period 2006–2012 and 1996–2012, respectively (see Figure 8).
6 According to Kodderitzsch (1999), on average only 18 % of crop, 30 % of livestock and 2 % of on-farm processed production reaches the markets.
Figure 8: The development of fruit tree production (1996–2012) and greenhouse area (2006–2012) by region
The map of fruit tree distribution shows clearly that in regions where fruit tree production has traditionally been important (Fier, Berat, Korçë) the area consumed by fruit tree production increased further over the 16-year period 1996–2012. The same is true of greenhouse production. In regions with significant areas under greenhouses (Fier, Berat), that area has increased even further over the 17-year period 1996–2013. At the same time, regions where a the production of fruit or vegetables in greenhouses was previously low have experienced only a small increase in area, or it may even have decreased (for example, the greenhouse area in the region of Gjirokastër). These two examples show that Albanian agriculture is undergoing a process of specialisation. These general trends need to be analysed in a more detailed way by constructing a farm typology that groups farms with similar characteristics within a group and highlights important differences among groups (Köbrich, Rehman et al. 2003; Iraizoz, Gorton et al. 2007). The creation of a farm system typology allows the specification of research questions, the elaboration of policy instruments and improvements in extension interventions in rural areas (Jouve 1986; Landais 1998).
The role of the typology can be summarised as ‘an efficient method to summarise diversity of farming systems, intrinsic to every rural area’ (Righi, Dogliotti et al. 2011).
In the case of Albania, constructing a representative farming system typology helps the policy maker to develop policy instruments to meet specific needs.
Some scholars conclude that, even in small areas, the typology remains a pertinent instrument to understand farming systems and farmers’ strategies Canali et al., 1998; Biba, 2001; Guri, 2002; Çakalli 2012). Independently of their research objectives, they agree that typology is one of the few instruments that allows us to identify the differences between farms in Albanian rural areas.
The majority of typologies developed until now have been expert-based ones for a limited number of farms and districts. Below we have presented a non-exhaustive list of typologies drawn up in Albania over the last 20 years.
Table 1: A non-exhaustive table of typologies applied in Albania
Author Objective Number of questionnaires Region Main indicators Methodology
(Biba 2001) Farm strategies 70 Lezhë, Korça Agricultural incomes, share of
self-consumption Expert based
(Canali, Hetoja et
al. 1998) Farm strategies n.a. Lushnjë Irrigated area Expert based
(Civici, Gocaj et al.
1997) Farm effectiveness n.a.
Central and north-west Albania
Net agricultural
income/worker Expert based
(Civici 2003) Land use strategies 315
Seven districts of Albania (mainly southern and central areas) Availability to participate in
land market Expert based
(Çakalli 2012) Effectiveness of policy
instruments 70 Vlorë
Agricultural mix
(fruit trees) Expert based
(Guri 2002) Farm strategies 150 Durrës-Kavaja
Agricultural incomes, non-agricultural
4 . C h a r a c t e r i s t i c s o f A l b a n i a n a g r i c u l t u r e a n d m e t h o d o l o g i c a l i s s u e s
The majority of typologies drawn up over the last 20 years deal with the identification of farming systems trajectories and their evolution.
Three are the main indicators recurrently used to group Albanian farming systems:
Agricultural and non-agricultural income Agricultural
income is one of the main research issues in Albania. The higher level of poverty in rural areas (Azzarri, Carletto et al. 2006) is a result of the lower productivity of work in agriculture, limited agricultural resources (especially land), obsolete technologies and the absence of specific support policies. The farm household strategy depends heavily on the quantity of non-farm income (Azzarri, Carletto et al. 2006). The literature shows that generally only a small part of non-agricultural income or remittances is invested in non-agricultural production or improvement of agricultural techniques; however, agricultural activity is shaped according to the availability of labour within the household (Miluka, Carletto et al. 2007).
Land use strategies One of the main issues in Albanian
agriculture is the limited area of agricultural land per farm (on average 1.20 ha/farm (INSTAT 2012)). Moreover, this tiny area is split into several plots of 0.26 ha on average (INSTAT 2012) sometimes located as much as 2 or 3 km away from the farmer’s household. Despite this, the Albanian government has not introduced sufficient specific ways of reversing the situation and increasing the average area of
farms. In this framework, the analysis of land use strategies seems to be one of the main research questions for Albanian scholars (Guri 2002; Civici 2003). In these cases the research is related to the specific region(s) of the country without giving any overview of the whole-country situation.
The effect of policy instruments on agricultural income In 2007, the Albanian government introduced a
set of agricultural investment support schemes, mainly applicable to fruit tree plantations, greenhouse construction, improving herd size, etc. The direct and indirect effects of these instruments on agricultural income/farms are poorly documented. This is partly because insufficient time has elapsed —most investments by farmers are in fruit trees (olives), which are not yet in production. The studies done (Çakalli 2012) are partial and deal only with one type of fruit tree in a limited area (generally a sample in a district). A common feature of all farm typologies developed for Albanian agriculture during the last 20 years is the methodology used, which, generally, has been expert based. Typically the number of questionnaires administered low and the sample covers only a small number of districts. There is only a little information about sample designation and sample representativeness at a country or district level. Only the typology developed by the Albanian Institute of Statistics and presented by Ronza (2011) is capable of being statistically representative at country level, but no detailed information is provided in the paper.
5 . M e t h o d o l o g y
The methodological approach of the study is organised into different parts.
The first part deals with the sample design and identification of regions, districts, communes and farms that are representative of the diversity of Albanian farming systems. The second part of the methodology explains the construction of the farm typology, and the third part presents the indicators used to assess the viability for each farm type.
5.1 The sample design
The sample is designed to be representative of farming systems in Albania. The limited financial and administrative resources meant that the survey had to be restricted to three regions of the country selected for their diversity of farming systems. The farms taking part in the survey were selected randomly to be representative of the farming systems in the area. The methodology of sample selection is explained below.
5.1.1 Selection of three representative regions (prefec-tures)
Albania is divided into 12 administrative counties called ‘prefectures’, ‘qarks’ or ‘regions’ (hereafter regions). To identify a representative sample of Albanian farming systems, a three-step sampling design was used.
Firstly, Albanian regions were stratified into three non-overlapping strata, each the size of four regions. Each stratum included regions that have similar agricultural characteristics in terms of:
Gross added value of agriculture in millions of Albanian lek —as an indicator of the importance of regional agriculture for the national agriculture sector.
Propensity to market (sales/total production (in value))— one of the most cited indicators in the identification of the different types of farming systems in Albania. The propensity to market is generally measured by proportion of total agricultural production accounted for by sales or the contribution of agricultural sales to total income.
Agricultural work productivity (workers/million Albanian lek of production)—an indicator of the intensification of farming systems in the region.
Productivity of the land (million Albanian lek per hectare)— an indicator of the intensification of land in the region. The data used for agriculture gross added value and employment in agriculture came from by INSTAT (Albanian National Statistics Institute), and the data used for the agricultural production (in value), sales (in value) and arable area came from the Statistical Yearbook 2010 of the Ministry of Agriculture Rural Development and Water Management. The latest common year for the two sources is used. 5.1.1.1 Ranking
The selected indicators are used to rank the Albanian regions according to their contribution to total production.
Ranking is done by a user-defined function (8), with the
main goal of ensuring the sustainability of sums. Assuming that each indicator is equally valid, the final ranking uses the average ranking of all indicators. Table 2 shows the classification of Albanian regions into three non-overlapping strata.
8 A function developed by Hans Pottel, commonly used for ranking in statistics, reviewing the Excel RANK function (the sum of ranks for a list
5. Methodology
Indicator 2
Indicator 3
Indicator 4
Average rank
ALL from sales/ ALL produced
W
ork
ers/million ALL produced
ALL produced from crops/
ha National classification Rank Rank Rank 000 ALL/ha Rank 7 0.34 4 2.48 8 173.7 9 7.0 8 4 0.39 7 2.84 11 168.2 7 7.3 7 5 0.53 11 2.34 5 152.2 4 6.3 9 11 0.34 3 3.15 12 159.0 6 8.0 4 12 0.36 5 2.43 7 186.4 10 8.5 3 2 0.39 6 2.32 4 93.9 1 3.3 10 10 0.43 9 2.71 10 156.9 5 8.5 2 1 0.25 1 1.49 2 138.8 3 1.8 12 3 0.27 2 2.39 6 109.1 2 3.3 11 9 0.40 8 2.16 3 188.0 11 7.8 6 8 0.48 10 2.58 9 169.6 8 8.8 1 6 0.54 12 1.08 1 232.1 12 7.8 5
5 . M e t h o d o l o g y
The regions ranked from first to fourth place (Tiranë, Korçë, Fier and Elbasan) are part of the first stratum, regions ranked from fifth to ninth place (Vlorë, Shkodër, Dibër and Berat) are part of the second stratum and the remaining regions (Durrës, Gjikorastër, Lezhë and Kukës) are constitute third stratum. The regional stratification is presented in Figure 9. Within each stratum the regions have similar characteristics of agricultural production.
The first stratum includes the most advanced agricultural regions in the country. The combination of the four selected indicators ranks these regions in first place. This is not universally true for each region and for each indicator. For example, Elbasan is classified among the most advanced regions in terms of agricultural production but its farm propensity to market is not highly ranked. This indicator decreases the overall performance of the region but not so much that it is demoted to the lower group of regions. The agricultural added value of these regions is higher. Farming systems clustered in this group sell a higher proportion of their products than do farms in other regions of the country. Another factor influencing intensification is the presence of at
least one important agricultural products market within the region’s boundaries or in close proximity. Tiranë, Elbasan and Korçë are among the most populated cities in the country. Fier region is in between the capital and the second largest city of the country (Tiranë and Vlorë, respectively). This favourable geographical location reduces the transaction costs of farms in Fier compared with those in other regions of the country. Traditionally these regions have been important agricultural producers at a country level. Some of them specialise in particular products (fruit and vegetables, cereals, potatoes, etc.) or production techniques (greenhouses).
The second stratum is composed of regions that are characterised by a lower proportion of agricultural production or lower productivity. It is difficult to give a general description of the whole stratum.
The third group of regions is composed of mountainous regions, which are more rural and have a lower agricultural production. In this group livestock production is important, but it is difficult for farmers to get their produce to the main agricultural markets of the country.
Figure 9: Region classification
5.1.1.2 Region selection
To ensure better representativeness of the country and farming systems, a region for each stratum is selected. To select the region within the stratum, indicators of farming systems diversification are applied. Following the same strategy as in the first step of sampling, but using indicators of cropping pattern (arable crops, orchards and livestock production in million Albanian lek), the regions of each stratum are ranked within the stratum (Table 3). In each
stratum, the region whose average ranking is closer to the average of the stratum is selected to be the one surveyed. The selected regions are Elbasan among the most agriculturally advanced regions, Berat among the middle regions, and Lezhë among the least agriculturally advanced regions. The main rationale behind region section methodology is not only to have representative regions on a country level, but also to have the greatest representation possible of agricultural systems in each group of regions.
Table 3: Region selection
Arable crop (M ALL) Rank Orchards (M ALL) Rank Livestock (M ALL) Rank Average ranking
Korçë 7 414 2 2 659 2 10 732 2 2.0 Elbasan 7 771 3 3 558 3 13 964 3 3.0 Fier 17 138 4 5 304 4 19 405 4 4.0 Tiranë 5 833 1 2 216 1 10 012 1 1.0 Average 2.5 Shkodër 5 753 4 1 702 2 11 109 4 3.3 Vlorë 2 941 1 3 480 3 9 767 3 2.3 Berat 5 174 3 4 197 4 7 459 2 3.0 Dibër 3 969 2 1 245 1 6 561 1 1.3 Average 2.5 Durrës 4 405 4 1 751 4 8 877 4 4.0 Lezhë 2 997 3 937 2 6 269 3 2.7 Gjirokastër 1 795 2 1 180 3 4 684 1 2.0 Kukës 1 755 1 650 1 5 679 2 1.3 Average 2.25
5 . M e t h o d o l o g y
5.1.2 Farm selection
Albania does not have yet a national farm register (it is expected to be established after the finalisation of the agricultural census (anticipated in 2014)). To select the farmers in each region, a multi-stage sampling method was applied, having as the main variable ‘the area’ (area sampling frame methodology). This methodology is widely used in agricultural surveys in Albania. In this case we have selected a sub-sample of a large master sample: ‘The large sample is intended to provide enough “banked” sample cases to support multiple surveys over several years without having to interview the same respondents repeatedly’ (U.N. 2005).
To select the farms for the sample, there are several methodological steps: (1) stratification; (2) construction of primary sampling units (PSUs), their numeration and selection; (3) the construction of sample Units (SUs), called segments, their selection and identification; and (4) the selection of a fixed number of farmers with activity for each selected segment.
(1) In the first step, the stratification of the regions is done according to the importance of agricultural activity in each area. The region’s area is split into seven strata, of which only four have agricultural interest: (1) land cultivation intensity over 75 %; (2) land cultivation intensity from
25 % to 74.9 %; (3) land cultivation intensity under 25 %; and (4) land cultivation intensity 0 %. Three other strata do not cover agricultural land, namely (1) military areas; (2) principal cities; and (3) water, rivers and lakes. Survey farms are selected from the first four strata.
Identification of strata for each prefecture is made firstly by designing prefecture boundaries on transparent paper from topographic maps (1:100 000) and laying them over satellite images, to identify the areas of different strata, objects and physical boundaries according to the map legend. Following that, the transparent paper is again placed over topographic maps, in order to register the information from satellite images. The stratum boundaries are then painted onto the maps in different colours.
(2) The second step of sample design methodology is the definition of the PSUs. These are designed for each stratum based on the predefined size boundaries (Table 4).
The process of the measurement and design of PSUs on the maps is the same as that used to define the strata at regional level.
A segment is a confined area of land within a PSU with a definite size depending on the stratum and defined absolutely in space using real physical boundaries (Table 5).
Table 4: Definition of the primary sampling units
Stratum Minimum (ha) Desirable (ha) Maximum (ha)
1 800 1 000 1 200
2 800 1 000 1 200
3 1 600 2 000 2 400
4 1 600 2 000 2 400
Source: authors’ calculations.
Table 5: Area definition for each stratum
Stratum Area (ha) Area Margin
1 25 ± 10 %
2 50 ± 10 %
3 100 ± 10 %
4 100 ± 10 %
The total number of segments identified in the country is 41 513.
The allocation of PSUs to strata and regions is done by the proportional to size probability method (comparing the size of each stratum with the country’s total area to identify the PSUs for each stratum, and comparing the size of each region with the stratum size to define the number of PSUs per region). One segment is selected for each selected PSU. The number of selected segments (selected PSUs) and their size is defined based on the sample variability, cost, problems related to identifiable boundaries, farm size, number of farms, etc. To improve the level of precision, to determine if the estimated number of segments was appropriate, estimations are made for different agricultural products in terms of comparing variance between segments with that inside the segments.
The selection of segments is made by a systematic selection process with a random start. The interval is defined by dividing the total number of segments per PSU by the number of selected segments. The segments are identified and localised on maps, measured through the digitisation process and identified in the field using maps on a scale of 1:10 000 or 1:25 000.
The list of farms with or without activity, together with the total land, for each segment is updated by the Ministry of Agriculture, Food and Consumer Protection (MAFCP) in the regions on an annual basis.
This sample can provide good results and representativeness at country and regional level with a limited budget and human resources. ,This method has the following advantages, among others:
•
The potential uses are unlimited—it can be used to collectrepresentative data on the area planted with crops and orchards and on livestock and agricultural production as well as socio-economic data.
•
It can ensure statistical validity—the method used todesign the frame takes into account all areas.
Following the above method, the PSUs and the segments for the survey are selected.
The number of selected segments for each selected region is 30 for Berat, 56 for Elbasan and 30 for the region of Lezhë (Table 6 and Figure 10). From each segment, 10 farms with agricultural activity are selected for surveying. The selection is casual starting point and systematic.
Table 6: Region sample
Region Questionnaires
Berat 276
Elbasan 505
Lezhë 255
Total 1 036
Source: authors’ calculations.