Regions in the Knowledge Economy
Marc L. Johnson
Peripheral but Vigorous
Southwestern Nova Scotia
©
Institut canadien de recherche sur le développement régional / Canadian Institute for Research on Regional Development
The Canadian Institute for Research on Regional Development, located on the campus of the Université de Moncton, was established in 1983. It is an independent, nonprofit organization governed by a board of direc-tors. Through its research, publication and conferences programs, it seeks to encourage continuing research into questions relating to regional development.
The institute views the study of regional development from a broad perspective and encourages a multidisciplinary approach including economy, economic geography, poli-tical science, public policy and sociology.
The institute’s goals are twofold:
1. To act as a catalyst in promoting informed public debate on regional deve-lopment issues
2. To make available to all interested parties objective information and data per-taining to the study of regional development
Scholars with an interest in undertaking research on regional development issues are invited to contact the institute. Our Web site is: www.umoncton.ca/icrdr.
The Atlantic Canada Opportunities Agency (ACOA) represents the interests of the Atlantic region in Government of Canada policy making and has a mandate to encourage federal policies and programs which promote economic development in the four Atlantic provinces. In support of this role, ACOA carries out policy-relevant research on a broad range of issues, challenges, and opportunities associated with the development of the region’s economy.
The Agency’s policy research efforts are strategically focused and actively involve public and private sector partners and key stakeholders from across Atlantic Canada and outside the region. Partners include: independent public policy organizations; govern-ment departgovern-ments and agencies; universities; colleges; economics community; business associations; and individual firms.
ACOA provided support to this study through the Atlantic Policy Research Initiative (APRI). The objective of the Initiative is to enhance the capability of the Agency to coordinate and plan pan-Atlantic federal activities contributing to economic growth in Atlantic Canada.
A
BOUT THE AUTHORSince January 2001, Marc Johnson has been Senior researcher at the Canadian Institute for Research on Regional Development at Université de Moncton. A sociologist, he is a graduate of the universities of Moncton, Strasbourg and Bordeaux, where he completed his doctorate in 1992. He has worked as a research and program evaluation consultant in collaboration with several government organizations, including Human Resources Development Canada, Canadian Heritage, the Canadian International Development Agency, the Office of the Commissioner of Official Languages and the Ministry of Education of Ontario. He has also worked for the National Anti-Poverty Organization and the Canadian Council of Professional Fish Harvesters.
His fields of interest include social, community, and economic development. He has examined the issues of literacy and adult education, employability mea-sures, the vitality of linguistic minorities, and the capacity building of commu-nities in Canada, as well as in Africa, South America, and Eastern Europe.
C
ONTENTS Foreword...07 I. Regional Profile ...08 Population ...09 Employment Sectors ...13 Natural Resources...17 Fisheries Sector ...21 Dynamic Industries ...24 Public Sector...26Labour Force Participation Rate and Income Levels...29
Education and Skills ...34
II. The Challenges of Economic Development ...39
Joint Action by Socio-economic Stakeholders ...39
A Delicate Transition to the Knowledge Economy ...42
Diversification of Goods Production ...43
Transportation Infrastructure and Policy ...44
Human Resources ...45
Tourism...46
Conclusion ...48
F
OREWORDThis study of Southwestern Nova Scotia is part of the watch project on the peripheral economies of eastern Canada, a comparative research program covering a total of eleven regions: Abitibi-Témiscamingue, Saguenay–Lac-Saint-Jean,
Bas-Saint-Laurent, Gaspésie and Côte-Nord in Quebec; Madawaska, Gloucester, Kent and Westmorland counties in New Brunswick; Prince County on Prince Edward Island; the West Coast of Newfoundland; and Southwestern Nova Scotia.
The objective of this research is to acquire a better understanding of the dis-tance factors that affect the economy of Canada’s peripheral regions, and to identify possible ways of revitalizing these regions. The approach taken involves a double comparison: first, a comparison of the eleven peripheral regions under study; and second, a comparison of eastern Canada and northern Europe, which share several characteristics in terms of geography and economic structure and policies.
The research program is conducted jointly by the Institut national de la recher-che scientifique – Urbanisation, culture et société (Montreal) and the Canadian Institute for Research on Regional Development (Moncton). In addition, resear-chers from the Université du Québec à Chicoutimi, the Université du Québec à Rimouski, and the Université de Moncton are contributing to this initiative. The program is funded by Canada Economic Development for Quebec Regions and the Atlantic Canada Opportunities Agency.
The principal results of this regional study are reproduced in the final research report. It also makes a synthesis of the other regional studies, a review of the international literature on peripheral economies, the cross-Canada statistical analysis, and the comparative analyses done in cooperation with researchers from northern Europe. These documents are available on the Web at
www.umoncton.ca/icrdr.
Marc L. Johnson October 2001
Watch Project … Southwestern Nova Scotia I
R
EGIONALP
ROFILEFor those arriving in North America by way of the Atlantic Ocean, Southwestern Nova Scotia is one of the points of entry to the continent. Thus, in 1605, this region received Canada’s first settlers, when the French established the Acadian colony of Port-Royal here, alongside the Micmac nation Gespogoite. This part of the Nova Scotia peninsula was subsequently inhabited by a large number of Loyalists and a small population of Blacks. It is not surprising that many human groups have chosen to live here, as the region’s climate is uncommonly mild. Snow covers the landscape less than one-third of the year. As well, the sea provi-des countless resources, while the land offers a valuable agri-forest heritage.
The region we selected for this study comprises three counties, each named for its main population centre: Digby, Yarmouth, and Shelburne. We subtracted Queens and Lunenburg counties from Statistics Canada’s economic region, as both are too close to Halifax to meet our definition of a peripheral region.1 The region selected is fairly symmetrical, with the small regional capital of Yarmouth in the middle, and Digby and Shelburne on either side. Southwestern Nova Scotia is essentially a rural region, and it is the only region in our research program that has no census agglomeration. In addition, this region has the highest concentration of francophones in Nova Scotia, in the rural municipalities of Clare and Argyle.
Geographically, Southwestern Nova Scotia is a peripheral area of the pro-vince, particularly in relation to Halifax, the metropolitan centre of the Atlantic region. Geography is also what gives Southwestern Nova Scotia, bounded on the south by the Atlantic Ocean and on the west by the Bay of Fundy, an economy based on marine resources. Given the cycles typical of marine resource deve-lopment, the economy of the Southwestern experiences the kinds of highs and lows that have shaped the history of the Atlantic provinces. During the 1990s, for instance, the groundfish crisis that shook the whole Atlantic region did not spare Southwestern Nova Scotia, although some diversification in the species caught, together with excellent lobster catches, afforded a degree of protection from the disaster.
While this region is peripheral in relation to Halifax, it has some invaluable access routes. In Yarmouth, two ferry services link it to the state of Maine, while in Digby, another ferry service links it to the industrial city of Saint John,
Watch Project … Southwestern Nova Scotia New Brunswick. Since the Southwestern’s primary market is the New England states, following the north-south axis, these links represent strategic assets.
Nevertheless, in the pages that follow, we will see that Southwestern Nova Scotia remains a peripheral region from the structural standpoint. While its resource-based economy continues to flourish, it is not benefiting from the deve-lopment of the knowledge-based economy, which remains essentially an urban phenomenon. The region is also heavily dependent on government transfer payments. Still, there are some promising development initiatives. In the Digby area, for example, a dynamic industrial park has successfully replaced the former Cornwallis military base, while at the regional level, the two regional deve-lopment agencies show unparalleled vitality. To begin with, however, let us look at the profile of the regional population, which has stopped growing and is becoming older.
Population
The 1996 census shows that Southwestern Nova Scotia had 64,090 inhabitants (see table 1). This ranks the region as the third smallest of the regions under study in our comparative research program, after Madawaska (N.B.) and Prince County (P.E.I.). Since 1971, the population has grown slightly, an average of 0.15 percent annually, compared with 1.08 percent annual growth in Canada as a whole. It can be seen that the growth in population gradually slowed, becoming negative from 1991 on, with the result that, in 1996, the region had some 1,800 fewer inhabitants than in 1991.
Table 1
Population Levels and Population Growth, Canada and Southwestern Nova Scotia, 1971–96
Total Population
1971 1981 1991 1996
Canada 21,568,255 24,083,395 26,993,800 28,528,015
Southwestern N.S. 61,700 64,690 65,850 64,090
Average Annual Growth (%)
1971–81 1981–91 1991–96 1971–96
Canada 1.01 1.04 0.93 1.08
Southwestern N.S. 0.43 0.16 -0.45 0.15
Watch Project … Southwestern Nova Scotia With regard to the francophone population, the number of people having French as their mother tongue declined by 5.2 percent between 1991 and 1996.2 In 1996, the number of Acadians in Yarmouth and Digby counties, where they are concentrated, was roughly 11,300.3
Two main phenomena are associated with this generally weak growth, the first being the aging of the population. Table 2 shows the changes in population struc-ture, by age, since 1971. The constant decline in the youngest segments of the population can be seen. The under fifteen years of age declined an average of 1.6 percent annually from 1971 to 1996, and the fifteen to twenty-four years of age had an average 1.0 percent annual decline over the same period. Conversely, the oldest age groups experienced positive growth. As Maurice Beaudin has noted, the francophone population seems to be a significant contributor to these changes, as the youngest age groups, all things being equal, are much smaller in this population than the average for the region. Such an observation leads this researcher to fear that this minority group4 will be unable to maintain its numbers.
The second phenomenon that adversely affects population growth is the re-gion’s negative migration balance. Table 3 shows migration flow in Southwestern Nova Scotia, by type of migration and by age group, for two over-lapping periods. Generally, it can be seen that, during the 1990s, the net migration was always negative. As well, in the second period, the numbers showed an even greater loss than in the first. Thus, Digby County lost 338 inhabitants in the first period and 379 in the second; Yarmouth County, 409 and 527; and Shelburne County, 587 and 769. Shelburne, in spite of its smaller population, had the greatest migration loss during the two periods. The same data presented by age group show that it is indeed younger people who are leaving the region in greater numbers. Throughout the periods studied, 68 percent of the migration loss was due to the under-twenty-five years of age. Only the forty-five to sixty-five years of age had a positive migration balance.
Watch Project … Southwestern Nova Scotia Table 2
Population Levels and Population Growth, Southwestern Nova Scotia, by Age Group, 1971–96
Age Group 1971 1981 1991 1996
Under-15-year-olds 18,470 15,010 13,155 12,285
15- to 24-year-olds 10,975 12,225 9,850 8,345
25- to 54-year-olds 19,150 22,430 27,430 27,725
55- to 64-year-olds 5,870 6,620 5,565 5,890
65-year-olds and over 7,220 8,400 9,800 9,850
Totala 61,700 64,690 65,850 64,090
Average Annual Growth (%)
Age Group 1971–81 1981–91 1991–96 1971–96
Under-15-year-olds -1.9 -1.2 -1.1 -1.6
15- to 24-year-olds 1.0 -1.9 -2.7 -1.0
25- to 54-year-olds 1.4 1.8 0.2 1.4
55- to 64-year-olds 1.1 -1.6 1.0 0.0
65-year-olds and over 1.4 1.4 0.1 1.2
Total 0.4 0.2 -0.5 0.1
Source: Statistics Canada, 1971, 1981, 1991, and 1996 censuses; compiled by INRS – UCS. a Because of rounding off, the totals do not add up.
This negative balance is obviously not to Southwestern Nova Scotia’s advan-tage, but it is less pronounced than in the province’s rural regions as a whole. As well, it compares favourably with the migration balance in Canada’s rural regions among the fifteen to seventeen years of age, although it is greater in the twenty to twenty-four years of age.5 The demographic data do not present a very dark picture of Southwestern Nova Scotia, whose weak population growth can be compared with that of the province. Statistics Canada projections for this province indicate that population growth should reach its point of decline in 2006.6 By comparison, it is expected that this threshold will be reached in 2015 in Prince Edward Island, and in 2001 in New Brunswick, while Newfoundland and Labrador already reached it in 1994. Quebec, like Canada, does not anticipate any decline before 2016.
5. R. Dupuy, F. Mayer, and R. Morissette, Rural Youth: Stayers, Leavers and Return Migrants,
report submitted to the Rural Secretariat, Agriculture and Agri-Food Canada, and the Atlantic Canada Opportunities Agency (Ottawa: Statistics Canada, March 2000), tables 21 and 22.
6. Statistics Canada, CANSIM, Population Projections for Canada, 1993-2016, SDDS 3602
Table 3
Migration Balance, by Type of Migration and Age Group,
by County, Southwestern Nova Scotia, 1991–92 to 1995–96 and 1993–94 to 1997–98
1991–92 to 1995–96 1993–94 to 1997–98
Type of Migration Type of Migration
County Population in 1991 Intra-provincial Inter-provincial Inter-national Migration Balance Population in 1993 Intra-provincial Inter-provincial Inter-national Migration Balance Digby 21,656 -263 -140 65 -338 21,384 -328 -133 82 -379 Yarmouth 28,343 -181 -319 91 -409 28,253 -197 -410 80 -527 Shelburne 17,605 -397 -206 16 -587 17,764 -523 -278 31 -769 Total 67,604 -841 -665 172 -1,334 67,401 -1,048 -821 193 -1,675 1991–92 to 1995–96 1993–94 to 1997–98
Age Group Age Group
County 0–17 yrs. 18–24 yrs. 25–44 yrs. 45–65 yrs. 65+ yrs. Total 0–17 yrs. 18–24 yrs. 25–44 yrs. 45–65 yrs. 65+ yrs. Total
Digby -119 -220 -97 99 -1 -338 -120 -214 -117 102 -30 -379
Yarmouth -38 -234 -137 39 -39 -409 -121 -278 -133 23 -18 -527
Shelburne -199 -96 -261 28 -59 -587 -242 -165 -306 0 -56 -769
Total -356 -550 -495 166 -99 -1,334 -483 -657 -556 125 -104 -1,675
Sources: Statistics Canada data obtained from tax files and compiled by the author on the basis of Province of Nova Scotia, Statistical Review 1997 and Statistical Review 2000, Halifax, Department of Finance, Statistics Division; Statistics Canada, Annual Demographic Statistics 1999.
Watch Project … Southwestern Nova Scotia Employment Sectors
The economy of Southwestern Nova Scotia is greatly influenced by its geographic location. It is essentially a maritime economy, oriented towards the fishing indus-try and marine product processing. The primary sector, manufacturing, and trade all rely heavily on, but are not limited to, this industry. Table 4 shows the break-down of jobs by industry in 1971 and in 1996.
Between 1971 and 1996, the total number of jobs in Southwestern Nova Scotia rose from 18,848 to 25,610. The primary sector, trade, and manufacturing accounted for half the jobs in both 1971 and 1996. The main change during that twenty-five-year period was a shift of jobs from manufacturing to the trade sector. The former, which accounted for 21 percent of jobs in 1971, dropped to 16 per-cent in 1996, while the latter rose from 15 perper-cent of jobs in 1971 to 21 perper-cent in 1996. The primary sector remained relatively stable, increasing from 15 to 16 percent over the same period. Contrary to the Canadian trend, the service sector (excluding trade) therefore did not gain a substantially larger share of jobs in the southwestern region.
Figure 1 illustrates the distribution of jobs among the primary, secondary, and tertiary sectors in Southwestern Nova Scotia and Canada in 1996. In spite of its significant trade activity, the southwest actually has an underdeveloped tertiary sector. Of the regions under study in this research program, Southwestern Nova Scotia is most like Prince County, Prince Edward Island, in the sense that these regions have the smallest tertiary sector (64 percent of jobs) and the largest prima-ry sector (17 percent in Prince; 16 percent in Southwestern Nova Scotia). As can be seen from figure 1, this situation contrasts with the employment structure at the national level where the size of the tertiary sector (77 percent) and the primary sector (5 percent) is concerned.
In the service sector, a noticeable increase in the proportion of jobs related to education (three percentage points) and to hotels, restaurants and recreation (three points) can be seen in Southwestern Nova Scotia, while there was a decline in the share of jobs in the public service (five points) and transportation and commu-nication (three points).
Table 4
Jobs by Major Industrial Sectors, Southwestern Nova Scotia and Canada, 1971 and 1996
1971 1996 Southwestern Nova Scotia Canada Southwestern Nova Scotia Canada Industrial Sector Number
of Jobs % Number of Jobs % Number of Jobs % Number of Jobs % Primary sector 2,920 15 445,287 6 4,090 16 683,580 5 Trade 2,855 15 1,195,327 16 5,400 21 2,318,710 17 Manufacturing sector 4,045 21 1,577,117 21 3,985 16 1,799,015 13 Education 1,510 8 631,426 8 2,780 11 1,419,600 11
Hotels, restaurants, bed and
breakfasts, camping, recreation 965 5 412,290 5 1,935 8 1,183,825 9
Public service 1,744 9 615,514 8 940 4 815,250 6
Transportation and communications 1,280 7 652,588 9 1,100 4 982,125 7
Construction 1,095 6 482,650 6 1,195 5 668,285 5
Health and social services 670 4 421,792 6 1,480 6 841,705 6 Personal services 725 4 330,613 4 1,000 4 846,190 6 Finance, insurance, real estate 260 1 344,689 5 670 3 740,010 6
Other 670 4 261,044 3 805 3 397,355 3
Advanced services – technologya 85 0 80,901 1 170 1 271,820 2
Advanced services – othersb 25 0 62,917 1 60 0 379,555 3
Total 18,848 100 7,514,155 100 25,610 100 13,347,025 100
Source: Statistics Canada, 1971 and 1996 censuses; compiled by INRS – UCS.
a Advanced services related to technology (engineering services, architects, information technology services, management services). b Other advanced services (lawyers, notaries, advertising, etc.).
Figure 1
Jobs by Economic Sector, Southwestern Nova Scotia and Canada, 1996
Source: Statistics Canada, 1996 census; compiled by INRS – UCS. Southwestern Nova Scotia
Secondary sector 20% Primary sector 16% Tertiary sector 64% Canada Tertiary sector 77% Secondary sector 18% Primary sector 5%
Watch Project … Southwestern Nova Scotia Table 5 presents a more detailed picture of employment growth by sector over the past twenty-five years. From this table, it can be seen that the health and social services, hotels, trade, and education sectors more or less doubled their employ-ment figures. The primary sector grew appreciably, as did the smaller sector of personal services. The sectors that did not experience any significant growth were construction, manufacturing, transportation and communications, and the public service, the last three of which recorded a net drop. In this figure, we have not included advanced services, which, in spite of their growth in the order of 3 percent annually, account for a negligible share of the work force (230 jobs in 1996).
This brief overview shows us that jobs are concentrated mainly in the primary sector and the trade sector, with the latter enjoying the strongest employment growth. The manufacturing sector is predominant, although its relative share has declined, chiefly because of the 1991 closure of the Dominion Textile plant in Yarmouth (375 jobs). Some services, such as education and health and social services, grew between 1991 and 1996, while the public service declined by half. For a more detailed examination of the employment structure, we will now turn our attention to jobs in the resources sector, especially the fishing industry, and jobs in dynamic industries and the public sector.
Table 5
Employment Growth, Major Industrial Sectors, Southwestern Nova Scotia, 1971–96
1971 1981 1991 1996
Primary sector 100 118 144 140
Trade 100 149 150 189
Manufacturing 100 120 123 99
Education 100 133 157 184
Hotels, restaurants, bed and breakfasts,
campgrounds, recreation 100 145 175 201
Public sector 100 95 118 54
Transportation and communications 100 104 99 86
Construction 100 121 129 109
Health and social services 100 194 190 221
Personal services 100 86 173 138
Finance, insurance, real estate 100 252 294 258
Watch Project … Southwestern Nova Scotia
Natural Resources
As is true for most of the peripheral regions, natural resources are crucial to the economy of Southwestern Nova Scotia. Table 6 shows the breakdown of resource-related jobs, i.e. in the primary sector (agriculture, hunting and fishing, forestry, mining, oil and gas) and those in processing industries directly related to resources (food, fish, lumber, furniture, leather and textiles, etc.). In all, some 7,300 out of 25,600 jobs (roughly one-third) were resource-related in 1996, whereas the proportion at the national level was 12 percent. Among the regions under study in our comparative research program, Southwestern Nova Scotia has the largest resources sector, followed by Prince County (P.E.I.). In twenty-five years, this aggregate sector grew an average of 0.4 percent annually in Southwestern Nova Scotia, slightly less than the rest of the regional economy (1.5 percent).
Among the sectors that rely on the exploitation and processing of resources, the fishing industry is, beyond the shadow of a doubt, the pacesetter. Hunting and fishing alone generated some 3,350 jobs in 1996,7 while marine product proces-sing provided another 2,510 jobs. Therefore, in 1996, a total of 5,860 jobs, or 80 percent of resource-related jobs, depended on this industry. We will come back to this in the next section.
The forestry sector is in second place, but far behind, with some 775 jobs in wood harvesting and processing, and furniture manufacturing. This sector has had very low average annual growth (0.3 percent) for twenty-five years. Employment in forestry operations grew noticeably from 1971 on, at an average rate of 1.6 per-cent annually, reaching 330 jobs in 1996. Employment in wood processing, for its part, grew in an uneven (saw-toothed) pattern, reaching 335 jobs in 1996, or about one hundred fewer jobs than in 1971. From 1995 on, the forestry industry did not do very well on a province-wide basis. Its contribution to the Gross Domestic Product (GDP) declined continuously, dropping from $109.3 million in 1995 to $60.8 million in 1999. Capital investment in this industry fell by more than 60 percent in 1999, and jobs, by 12 percent. Conversely, the total log production
Table 6
Jobs Related to Natural Resources, by Sector, Canada and Southwestern Nova Scotia, 1971–96
Number of Jobs Average Annual Growth (%)
1971 1981 1991 1996 1971–81 1981–91 1991–96 1971–96
Primary Sector Agriculture
Canada 238,607 457,648 483,283 433,605 6.1 0.5 -1.8 2.3
Southwestern N.S. 230 625 465 400 9.5 -2.7 -2.5 2.2
Hunting and fishing
Canada 23,953 31,915 34,216 33,560 2.6 0.6 -0.3 1.3
Southwestern N.S. 2,450 2,605 3,280 3,350 0.6 2.1 0.4 1.2
Forestry
Canada 62,519 78,157 76,582 66,820 2.1 -0.2 -2.2 0.3
Southwestern N.S. 220 200 295 330 -0.9 3.6 1.9 1.6
Mining, oil and gas
Canada 120,208 173,136 169,490 149,595 3.4 -0.2 -2.1 0.8
Southwestern N.S. 20 25 175 10 2.0 19.3 -37.9 -2.6
Secondary Sector – Primary Processing Food, other than fish
Canada 206,860 231,492 220,232 196,420 1.0 -0.5 -1.9 -0.2 Southwestern N.S. 270 135 219 125 -6.1 4.5 -8.9 -2.9 Fish processing Canada 27,044 48,384 39,931 25,035 5.4 -1.7 -7.5 -0.3 Southwestern N.S. 2,300 2,880 3,385 2,510 2.1 1.5 -4.9 0.3 Wood processing
Canada 41,267 63,314 59,209 52,480 4.0 -0.6 -2.0 0.9 Southwestern
N.S.
65 60 130 110 -0.7 7.3 -2.7 2.0
Leather and textiles
Canada 194,583 233,066 165,957 155,145 1.7 -3.0 -1.1 -0.9
Southwestern N.S.
470 520 230 85 0.9 -7.2 -15.3 -6.4
Other – Primary Processing
Canada 418,327 528,370 424,380 406,500 2.1 -2.0 -0.7 -0.1 Southwestern N.S. 110 140 205 80 2.2 3.5 -14.5 -1.2 Total Resources Canada 1,425,840 1,980,918 1,781,930 1,652,245 3.0 -1.0 -1.3 0.6 Southwestern N.S. 6,560 7,580 8,569 7,335 1.3 1.1 -2.6 0.4 Rest of Economy Canada 6,088,315 8,948,752 11,033,708 11,694,780 3.6 1.9 1.0 2.5 Southwestern N.S. 12,288 15,949 17,947 18,275 2.4 1.1 0.3 1.5 Total Jobs Canada 7,514,155 10,929,670 12,815,638 13,347,025 3.5 1.5 0.4 2.2 Southwestern N.S. 18,848 23,529 26,516 25,610 2.0 1.1 -0.3 1.2
Watch Project … Southwestern Nova Scotia volume increased slightly as of 1995.8 Table 7 presents a summary of lumber pro-duction in Southwestern Nova Scotia in 1999. Provincially, this region appears to play a secondary role in the forest industry, except perhaps for Digby County. The wood harvested mainly goes to supply the Bowater Mersey paper mills in Liverpool and Bridgewater, outside the region, and the J. D. Irving plant in Weymouth (Digby County), for subsequent shipment to New Brunswick9. In short, in view of its small share of provincial production, the forest industry does not seem to be a significant factor in the economic development of Southwestern Nova Scotia.
Table 7
Forest Production, Southwestern Nova Scotia, by County, 1999 Solid Wood
(cubic metres) SouthwesternShare of Nova Scotia Production (%)
Share of Nova Scotia Production (%)
Digby 358,254 60 6
Shelburne 69,265 12 1
Yarmouth 172,000 29 3
Southwestern Nova Scotia 599,519 100 10
Nova Scotia 6,163,710 – 100
Source: Province of Nova Scotia, Nova Scotia Statistical Review 2000, Halifax, Department of Finance, Statistics Division, 2000, 68.
Relatively speaking, the agri-food sector appears to play a small role in the regional economy. In 1996, it accounted for some 525 jobs, and its average annual growth rate in the past twenty-five years has been almost nil (0.2 percent). At that time, Southwestern Nova Scotia had 294 farms, or 7 percent of all the farms in the province, and they recorded gross receipts of $20 million, or 5 percent of the province’s farm receipts.10 The textile industry, for its part, which had formerly flourished, especially in the Yarmouth area, almost completely disappeared in 1996. Lastly, the oil and natural gas sector, on which many hopes are still pinned, did not play a significant role during this period.
Watch Project … Southwestern Nova Scotia Fisheries Sector
The fishing industry in Southwestern Nova Scotia is the envy of the other parts of eastern Canada. The primary reason for its success is the year-round fishing. Table 8 compares this industry in the five provinces of eastern Canada from 1990 to 1998. The first thing that can be seen from this table is the effect of the groundfish crisis that struck the overall region in 1991. In 1992, the full effect of the fishing moratoriums could be felt and it translated into a substantial drop in landed volume. The low point seems to have been reached in 1995, when landings of 638,379 tonnes were reported, half the 1990 numbers. However, a contrary trend is noted in landed values, which reached a peak of $1.36 billion the same year, up 43 percent compared with1990!
The crisis affected Nova Scotia a bit later and less brutally than it did the neighbouring provinces. Nova Scotia took advantage of this fact to wrest first place from Newfoundland and Labrador in regard to the quantities landed as of 1991. The main species that were most abundant in Nova Scotia in 1998 were herring (76,361 mt), scallops (48,738 mt), shrimp (23,946 mt), hake (19,437 mt), lobster (18,964 mt) and redfish (15,349 mt).11 Nova Scotia also maintained its first-place ranking in regard to landed value. This enviable position is due to its lobster ($232.5 million), shrimp ($72.5 million), and scallops ($68.7 million) landings. Even though the gap between the two leading provinces gradually diminished from 1996 on, because of Newfoundland and Labrador’s recovery, the fishing industry in Nova Scotia is doing quite well. Between 1997 and 1998, groundfish landings rose again by a few percentage points, their volume increasing by 4.7 percent, and their value by 10.3 percent. Between 1998 and 1999, the number of jobs in this industry rose by 8.7 percent, while the employment income grew by 1.1 percent. In 1999, marine products were Nova Scotia’s main category of exports (25 percent), and their value was in excess of $990 million, an increase of roughly 12 percent over 1998.12
11. Fisheries and Oceans Canada data, compiled by Maurice Beaudin, Towards Greater Value: Enhancing Eastern Canada’s Seafood Industry (Moncton: Canadian Institute for Research on Regional Development, Maritime Series, 2001), Appendix B.
Table 8
Volume and Value of Wild Fish Landings, Eastern Canada, 1990–98
1990 1991 1992 1993 1994 1995 1996 1997 1998
Newfoundland
Volume (metric tons) 545,423 424,808 285,595 247,602 138,237 138,606 195,346 215,467 266,950 Value ($000) 279,474 261,972 199,177 209,112 225,343 345,818 289,758 328,737 413,937
Prince Edward Island
Volume (metric tons) 71,504 59,645 47,372 43,370 47,635 47,501 53,726 57,916 54,097 Value ($000) 62,093 70,612 79,715 73,708 93,353 115,545 100,956 112,665 111,314
Nova Scotia
Volume (metric tons) 493,382 517,335 492,930 402,418 340,155 271,064 279,331 299,840 297,395 Value ($000) 444,861 498,239 511,572 478,255 504,555 512,157 466,227 511,817 540,502
New Brunswick
Volume (metric tons) 157,789 116,785 126,492 122,040 142,170 133,436 107,346 110,941 110,630 Value ($000) 93,334 97,153 104,850 106,625 174,542 208,439 157,906 147,154 129,906
Quebec
Volume (metric tons) 74,330 73,872 70,426 58,553 51,230 47,772 50,691 51,156 49,378 Value ($000) 74,137 86,042 88,881 91,560 130,026 177,274 134,036 114,196 98,777
Eastern Canada
Volume (metric tons) 1,342,428 1,192,445 1,022,815 873,983 719,427 638,379 686,440 735,320 778,450 Value ($000) 953,900 1,014,018 984,195 959,260 1,127,819 1,359,233 1,148,883 1,214,569 1,294,436
Source: Fisheries and Oceans Canada data, compiled by Maurice Beaudin, Towards Greater Value: Enhancing Eastern Canada’s Seafood Industry
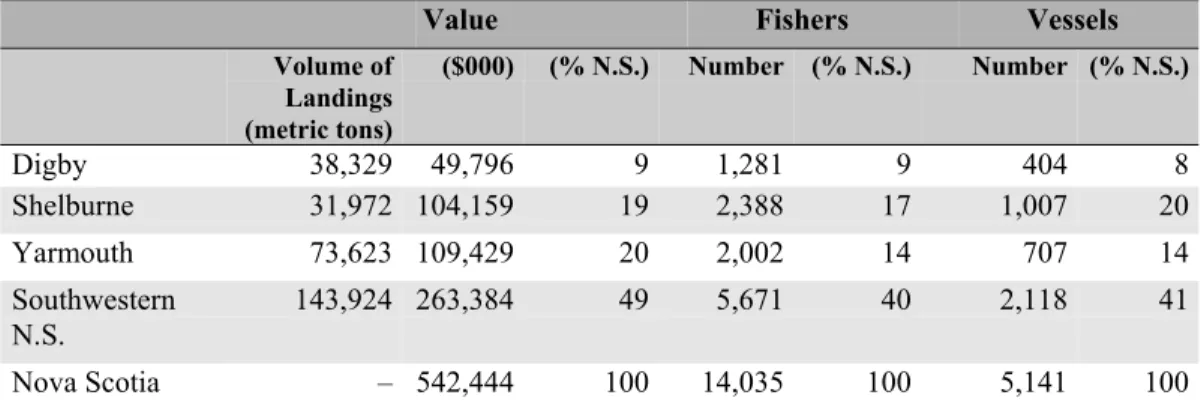
Watch Project … Southwestern Nova Scotia Table 9 summarizes Southwestern Nova Scotia’s fishing capacity. This table shows that the region has 40 percent of the province’s fishing fleet (the rest being concentrated mainly in Cape Breton and the province’s north shore), which pro-vides nearly half the landed value, or $263.4 million in 1998. Within the region, Shelburne County has the largest fishing fleet, followed by Yarmouth and Digby. The ratio between the volume and value of landings gives an indication of the type of fishing that is dominant in each county. Digby, for instance, is cha-racterized by a lower return ($1,300/mt) due to the predominance of scallop fishing.13 In this “scallop capital of the world,” however, the fishing effort calls for the use of fewer (404) but larger boats. In Shelburne, a substantial fleet of small boats (1,007) records a very good yield ($3,260/mt), which reflects the lucrative lobster catch. Yarmouth achieves an intermediate yield ($1,485/mt) and also has a substantial fleet (707), but this county’s landed volume is greater, which is the sign of a mixed fishery that includes lobster as well as pelagic and ground-fish species.
Table 9
Fishing Capacity, Southwestern Nova Scotia, by County, 1998
Value Fishers Vessels
Volume of Landings (metric tons) ($000) (% N.S.) Number (% N.S.) Number (% N.S.) Digby 38,329 49,796 9 1,281 9 404 8 Shelburne 31,972 104,159 19 2,388 17 1,007 20 Yarmouth 73,623 109,429 20 2,002 14 707 14 Southwestern N.S. 143,924 263,384 49 5,671 40 2,118 41 Nova Scotia – 542,444 100 14,035 100 5,141 100
Source: Fisheries and Oceans Canada data, compiled in Province of Nova Scotia, Nova Scotia Statistical Review 2000 (Halifax: Department of Finance, Statistics Division, 2000), table 72.
The lobster fishery, which enjoys a long season, is certainly the region’s main asset. Half the lobster catches in eastern Canada are from Nova Scotia, and the southwestern part of the province is the region where most lobster fishing takes place. Most of the catch is exported live to the New England states. Little value is therefore added to this production, but its price remains exceptionally high. Since Southwestern Nova Scotia is the only Canadian region to market its catches in
Watch Project … Southwestern Nova Scotia While little lobster is processed, fish processing is nonetheless an important industry. As noted earlier, it creates a considerable number of jobs (2,510 in 1996). Some of the main processors are Comeau’s Sea Foods (750 jobs), Kenney & Ross (55), Clearwater Fine Foods (90), Skipper Fisheries Ltd, I. Deveau Fisheries (200), and Sable Fish Packers (300). The increase in fish imports for processing in the region curbed moratorium-related job losses in the processing sector. Groundfish imports from Norway, Russia, Iceland, and the United States added some $155 million to the value of Nova Scotia’s marine products.14 The data do not specify, however, where these landings were processed. Be that as it may, the processing industry now helps to make marine products Nova Scotia’s principal export product.
The aquaculture sector is not yet fully developed, but it is growing rapidly. At the provincial level, aquaculture production in 1998 came to 5,360 mt, for a value of $25.4 million, while in 2000 it reached 11,619 mt, for a value of $50.5 million. Nova Scotia thus lagged far behind New Brunswick, which produced 15,748 mt, for a value of $115 million.15 Within the region, it seems Shelburne County benefits most from aquaculture, having about 25 companies that farm primarily Atlantic salmon, oysters, and halibut.16
Dynamic Industries
The new economy is based mainly on service sector jobs. Within this sector, the term “dynamic services” is used to designate jobs in the areas of distribution, trade, and business services, as well as finance, insurance, and real estate. In addi-tion, the medium and high value-added manufacturing sector remains a central element of the new economy, insofar as its products involve high technological input. For the purposes of this study, we are including all these employment sectors in the dynamic industries category.
Table 10 presents the dynamic industries in Southwestern Nova Scotia and in Canada. The region under study is lagging behind the national average where
14. According to Beaudin, ed., The Economic Region of Southwestern Nova Scotia, 73.
Table 10
Jobs in Dynamic Industries, by Sector,
Canada and Southwestern Nova Scotia, 1971 and 1996
1971 1996
Canada Southwestern Nova Scotia
Canada Southwestern Nova Scotia
Sector Number of Jobs
% Number of Jobs % Number of Jobs % Number of Jobs %
Manufacturing – medium value
added 382,616 5 330 2 527,225 4 625 2
Manufacturing – high value
added 113,864 2 10 0 160,565 1 40 0
Transportation 397,945 5 830 4 539,205 4 595 2
Communications 254,643 3 450 2 442,920 3 505 2
Finance, insurance, real estate 344,689 5 260 1 740,010 6 670 3 Advanced services – technology 62,917 1 25 0 379,555 3 60 0
Wholesale trade 329,305 4 685 4 714,100 5 2,005 8
All dynamic industries 1,885,979 25 2,590 14 3,503,580 26 4,500 18 Rest of the economy 5,628,176 75 16,258 86 9,843,445 74 21,110 82
Total 7,514,155 100 18,848 100 13,347,025 100 25,610 100
Watch Project … Southwestern Nova Scotia dynamic industries are concerned. Over the past twenty-five years, the proportion of these services in the total number of jobs in the region increased from 14 to 18 percent. The number of jobs in the medium or high value-added manufacturing sector doubled, but their relative weight remains negligible. The number of jobs in the transportation sector declined, undoubtedly because of the closure of the railway in 1988, the privatization and reduction of ferry services (1998) and the drop in traffic at the Yarmouth airport. Financial services showed considerable growth, with the number of jobs increasing from 260 to 670, but here again the sector’s relative weight remains negligible. Wholesale trade was the sector that showed the greatest growth, tripling its work force in twenty-five years.17
The 1996 data show that Shelburne County (12.4 percent) and Digby County (13.2 percent) have few jobs in the dynamic services sector, while in Yarmouth County, the regional centre, this sector accounts for a somewhat larger share of jobs (14.5 percent).18 Southwestern Nova Scotia, being essentially a rural region, is unlikely to attract a significant number of jobs in dynamic industries, which more often than not prefer large urban centres, where there is an abundant supply of skilled personnel and business services. In this regard, Southwestern Nova Scotia is at a distinct disadvantage: only 1 percent of jobs in Shelburne, 2 percent in Yarmouth, and less than 1 percent in Digby are related to business services! In Nova Scotia and in the Maritimes as a whole, however, this share is normally in the 4 percent range.
Southwestern Nova Scotia is therefore not in a very good position to benefit from the globalized economy, which is knowledge-based, but local economic players are dealing with this situation by instituting a series of strategic measures, as we will see further on.
Public Sector
The public sector plays an important role in the dynamics of employment, particularly in peripheral regions, where it contributes to a significant increase in wages and salaries. The “public sector” category includes jobs in the areas of education, health and social services, and the public service (see table 11). In Southwestern Nova Scotia, this aggregate represented some 5,200 jobs in 1996, which put this sector in second place after trade (see table 4). It is therefore a key sector.
Table 11
Public Sector Jobs, Canada and Southwestern Nova Scotia, Selected Years
1971 1981 1991 1996
Canada Southwestern
N.S. Canada SouthwesternN.S. Canada SouthwesternN.S. Canada Southwestern N.S.
Education 631,426 1,510 936,444 2,005 1,252,785 2,374 1,419,600 2,780 Health and social services 421,792 670 602,302 1,300 805,254 1,270 841,705 1,480 Public service 615,514 1,744 830,997 1,656 1,015,288 2,064 815,250 940
Total 1,668,732 3,924 2,369,743 4,961 3,073,327 5,708 3,076,555 5,200
Watch Project … Southwestern Nova Scotia Over the full period studied, it can be seen that the public sector in the study region grew until 1991, and dropped off somewhat in 1996. This trend is due to the public service, the only sector that experienced a decline. Between 1991 and 1996, the number of public servants in the different levels of government shrank dramatically: 54 percent of them had disappeared in the 1996 census data! The provincial public administration reduced its work force radically in the 1990s. Between 1991 and 1999, the number of provincial employees fell by 25 percent.19 But the province was not alone in cutting back its human resources. The federal government set the pace, reducing its services over the whole decade. During the same period, the number of federal employees, including members of the military, dropped by 30 percent in this province.
Southwestern Nova Scotia was particularly affected by these job cuts, as the public service is under-represented in this region compared with the provincial average, and even the average for the Maritime provinces. While jobs in this sector represent about 9 percent of all jobs in the Maritimes and 10 percent of all jobs in Nova Scotia, they account for only 4.6 percent of jobs in Shelburne, 3.6 percent of those in Yarmouth, and 3.6 percent of those in Digby. The down-sizing in Southwestern Nova Scotia hit the military bases hardest: the Cornwallis, Shelburne, and Barrington bases were closed. The Yarmouth airport and the Weymouth, Yarmouth, and Digby harbours were privatized, as were the Digby and Yarmouth ferry services. A Fisheries and Oceans Canada hatchery in Yarmouth shut down. The only addition was the creation of some 85 jobs at the former Cornwallis military base, owing to the establishment of the Lester B. Pearson Canadian International Peacekeeping Training Centre.20 It is estimated that, between 1990 and 1998, the number of federal jobs in Yarmouth and Shelburne counties alone dropped from 600 to 100.21
The foregoing data refer to the distribution of jobs up until 1996. It is known, however, that the employment situation improved after 1996. The Labour Force
Survey data for Southern Nova Scotia (including the South-West and Queens and
Lunenburg counties) show an overall growth in employment of 10 percent between 1996 and 2000, which boosted the number of jobs from 48,000 to 53,000. To better understand what impact this employment structure has in the region, we will now examine the labour force and income characteristics.
Watch Project … Southwestern Nova Scotia Labour Force Participation Rate and Income Levels
The participation rate in Southwestern Nova Scotia is relatively low. Table 12 shows that in 2000, the participation rate (56.6 percent),22 which represents the percentage of persons fifteen years of age and over who are employed or unem-ployed, is considerably lower than the national average (65.9 percent), and the provincial average (61.7 percent). Although from 1987 to 2000 the participation rate rose six percentage points in Southwestern Nova Scotia, that region places seventh among the eleven regions in our comparative study.
The region fares better, however, with respect to the unemployment rate, which was 9.8 percent in 2000 (see table 13), still three points above the national average, but third-best of the eleven regions studied. However, that is a recent improvement, given that the unemployment rate stayed above 12 percent from 1993 to 1998.
Incomes in Southwestern Nova Scotia reflect the low participation rate and high unemployment rate. Table 14 shows that the average income per resident in the region in 1996 was $14,436, only 78 percent of the national per capita ave-rage. However, that figure was considerably higher than the 1971 figure of 62 per-cent, and the gap seems to be shrinking gradually.
It is instructive to look at those income figures on the basis of source. Table 15 shows the distribution of sources of income for 1991 and 1996. The percentage of labour income in Southwestern Nova Scotia fell 5 percent between 1991 and 1996, with income from government transfers rising by the same amount, from 22 to 27 percent of total income. The table also shows that the reliance on federal transfer payments is clearly more marked in Southwestern Nova Scotia than in urban Canada (13 percent) and rural Canada as well (20 percent).
22. In this study, the southern region of Nova Scotia, as defined by Statistics Canada, includes
the counties of Queens and Lunenburg. This inclusion enhances the socio-economic image of the region, given their proximity to Halifax.
Table 12
Labour Force Participation Rate (%), by Economic Region, 1987–2000
1987 1988 1989 1990 1991 1992 1993 1994 1995 1996 1997 1998 1999 2000 Canada 66.4 66.8 67.2 67.1 66.5 65.7 65.4 65.2 64.9 64.7 64.9 65.1 65.6 65.9 Newfoundland 54.1 55.1 56.0 56.7 56.2 54.2 53.6 53.6 53.0 52.1 52.5 53.9 56.3 55.8
030 - West Coast- Northern Peninsula and Labrador
58.3 56.3 57.3 55.5 55.5 53.4 51.0 54.0 51.4 51.5 51.3 53.0 55.2 55.1
Prince Edward Island 63.2 64.2 65.2 65.4 64.9 65.6 65.3 65.3 65.1 66.0 66.1 65.7 66.4 66.9 Nova Scotia 59.9 60.7 61.3 62.0 61.6 60.2 60.2 60.2 59.6 59.5 59.9 60.7 61.0 61.7 240 - Southern 51.1 55.6 55.6 57.2 57.4 57.2 54.4 54.9 53.3 53.0 55.5 56.5 58.7 56.6 New Brunswick 58.4 59.1 59.9 60.0 58.6 58.9 59.1 58.6 59.4 58.6 59.9 60.7 61.0 61.6 310 - Campbellton-Miramichi 51.7 51.4 53.2 53.7 50.2 49.3 50.6 50.7 52.4 51.4 56.1 55.4 54.0 55.2 320 - Moncton-Richibucto 60.8 60.8 61.3 61.4 61.0 62.5 62.4 60.7 63.5 64.1 62.7 62.7 63.7 64.8 350 - Edmundston-Woodstock 56.5 58.4 58.3 55.9 52.7 54.4 54.9 57.4 56.9 54.7 57.4 60.2 60.5 61.3 Quebec 63.5 63.7 64.1 64.2 63.5 62.5 62.2 62.3 62.1 61.9 62.1 62.6 62.8 63.2 410 - Gaspésie–Îles-de-la-Madeleine 49.4 52.0 52.5 47.4 45.6 43.8 46.1 47.2 46.3 45.5 51.1 49.5 50.3 51.5 415 - Bas-Saint-Laurent 55.7 56.2 53.1 55.3 57.6 55.9 54.6 56.7 57.4 57.1 57.9 54.9 57.6 54.2 465 - Abitibi-Témiscamingue 58.1 62.1 64.3 60.9 60.4 59.5 59.0 59.9 62.1 61.4 63.7 61.9 62.8 63.6 475 - Saguenay–Lac-Saint-Jean 57.8 57.4 55.8 59.0 58.8 57.3 56.8 53.9 57.5 57.2 57.9 58.1 59.7 59.5 480 and
490 - Côte-Nord and Nord-du-Québec
61.9 64.8 66.1 68.9 66.9 62.3 63.0 63.8 63.5 62.5 62.4 58.3 63.8 62.3
Table 13
Unemployment Rate (%), by Economic Region, 1987–2000
1987 1988 1989 1990 1991 1992 1993 1994 1995 1996 1997 1998 1999 2000
Canada 8.8 7.8 7.5 8.1 10.3 11.2 11.4 10.4 9.4 9.6 9.1 8.3 7.6 6.8
Newfoundland 18.1 16.2 15.5 16.9 18.0 20.2 20.4 20.2 18.1 19.3 18.6 18.0 16.9 16.7
030 - West Coast-Northern Peninsula and
Labrador 23.0 19.5 16.1 17.6 19.5 22.2 24.4 22.5 17.6 21.0 18.9 19.8 19.3 17.8
Prince Edward Island 12.5 12.4 13.7 14.6 16.7 18.1 17.6 17.2 15.0 14.7 15.4 13.8 14.4 12.0 Nova Scotia 12.1 10.2 9.8 10.5 12.1 13.2 14.3 13.5 12.1 12.3 12.1 10.5 9.6 9.1 240 - Southern 10.5 8.3 7.8 8.9 10.9 11.2 12.1 12.8 12.2 12.1 12.1 12.0 10.4 9.8 New Brunswick 13.2 11.9 12.1 12.1 12.8 13.0 12.5 12.4 11.2 11.6 12.7 12.2 10.2 10.0 310 - Campbellton-Miramichi 15.4 14.9 16.3 17.4 17.2 18.1 17.9 18.3 14.0 13.7 17.0 19.0 16.7 16.1 320 - Moncton-Richiboucto 13.7 10.9 11.1 11.5 11.6 12.1 12.1 11.7 11.6 12.4 12.7 11.0 9.5 8.6 350 - Edmundston-Woodstock 11.9 11.7 12.4 11.0 13.0 11.6 9.5 8.8 9.6 8.9 10.5 10.2 8.9 8.9 Quebec 10.2 9.5 9.6 10.4 12.1 12.7 13.3 12.3 11.4 11.9 11.4 10.3 9.3 8.4 410 - Gaspésie–Îles-de-la-Madeleine 16.4 16.4 19.7 20.4 18.2 21.0 22.1 21.6 20.6 18.7 23.5 22.0 20.8 20.0 415 - Bas-Saint-Laurent 12.3 12.4 13.4 13.0 14.7 14.5 16.3 15.3 13.1 14.1 16.2 13.6 10.2 10.3 465 - Abitibi-Témiscamingue 8.7 9.7 11.0 13.3 13.8 13.7 14.0 12.9 11.5 10.9 14.4 15.0 13.4 11.7 475 - Saguenay–Lac-Saint-Jean 13.6 13.1 12.0 13.2 14.9 14.8 15.7 14.9 14.6 14.3 14.5 14.3 11.5 10.4 480 and
490 - Côte-Nord and Nord-du-Québec
12.5 11.8 11.1 10.9 15.5 12.9 14.4 14.5 13.4 15.1 14.8 14.0 14.4 12.6
Watch Project … Southwestern Nova Scotia Table 14
Average Income Per Capita, Canada, and Southwestern Nova Scotia, Selected Years
1971 1981 1991 1996
Canada $2,701 $8,529 $17,271 $18,473
Southwestern Nova Scotia $1,677 $5,960 $13,397 $14,436 Southwestern Nova Scotia/Canada (%) 62.1 69.9 77.6 78.1 Source: Statistics Canada, census data from 1971, 1981, 1991, and 1996; compiled by INRS –
UCS.
The issue of dependence on government transfers is crucial for Southwestern Nova Scotia. Overall, according to Beaudin, income from government transfers accounted for approximately 40 percent of income in the Maritimes during the 1990s.23 Successive budget cuts by Ottawa and then by the provinces pushed disposable incomes down significantly, and, as we saw earlier, over 50 percent of the well-paying jobs in the federal and provincial public services were eliminated between 1991 and 1996. Federal spending on goods and services was also down, and employment insurance benefits dropped 24 percent between 1992–93 and 1997–98. Southwestern Nova Scotia was hard hit by that last round of cuts, given the importance of seasonal employment to its economy, estimated by Beaudin at approximately 16 percent of all jobs. It is therefore not surprising, as Beaudin points out, that economic dependence on employment insurance benefits is higher in Digby (20 percent), Shelburne (18 percent), and Yarmouth (15 percent) than Nova Scotia as a whole (8 percent) or Canada (5 percent).24
In the context of the new economy, one employment criterion, particularly for well-paying jobs, is the level of education and skills of the labour force, which we will now assess.
Table 15
Distribution of Income, by Source, Canada and Southwestern Nova Scotia, 1991 and 1996
1991 1996
Rural Canada Urban Canada Southwestern N.S. Rural Canada Urban Canada Southwestern N.S.
$/res. % $/res. % $/res. % $/res. % $/res. % $/res. %
Labour income 10,114 73 14,400 79 9,288 69 10,888 70 14,791 76 9,174 64 Income from federal
transfers
2,233 16 1,918 10 2,900 22 3,081 20 2,477 13 3,901 27 Other income 1,462 11 1,997 11 1,266 9 1,542 10 2,137 11 1,361 9
Total income 13,810 100 18,315 100 13,453 100 15,511 100 19,405 100 14,436 100
Watch Project … Southwestern Nova Scotia Education and Skills
There is no doubt that today, education and skill-building are key factors in socio-economic development. The “knowledge” economy requires human resources with solid skills. This is true in all areas, and resource-based regions are no exception. Agriculture, forestry and fishing all use technology requiring new skills on the part of workers. An interesting development in the region’s all-important fishing industry is the professionalization of fishers, an initiative led by the Canadian Council of Professional Fish Harvesters that focuses first and foremost on training, emphasizing core skills (reading, writing, math, and communication) as well as the use of technology, an understanding of regulations and environ-mental information, and business management.
In the area of training, Southwestern Nova Scotia made remarkable progress from 1971 to 1996 (see table 16). The percentage of individuals aged fifteen and over who have less than a ninth grade plummeted from 41 to 20 percent during that time, following to some degree the trend in Canada as a whole, where that figure fell from 31 to 12 percent. However, there is still a significant gap between Southwestern Nova Scotia and the national average, as is the case for most of the regions included in our comparative research program.25 Southwestern Nova Scotia also lags behind the province as a whole, as 11 percent of the population had reached this level of education in 1996.
University graduation is a key indicator of the ability of the labour force to make the shift to the knowledge economy. In that respect, Southwestern Nova Scotia again made significant progress. The number of university graduates tripled between 1971 and 1996, however, they still accounted for only 6 percent of the population fifteen years of age and over. In fact, by 1996, the region had only reached Canada’s 1971 level. Degrees in the sciences were low, at 2 percent. The region fares somewhat better with respect to technical training — 10 percent of adults have a diploma from a trade school. Overall, the region’s results are fairly poor from an education perspective and, in fact, Southwestern Nova Scotia places last in this area, along with the West Coast of Newfoundland and Quebec’s North Shore.
Workers with low education levels tend to move into specific industrial sectors. According to the data compiled by Maurice Beaudin (see table 17), those workers are concentrated in goods-producing industries and, to a lesser degree, in
Table 16
Level of Education, Fifteen Years of Age and Over, Canada and Southwestern Nova Scotia, Selected Years
1971 1981 1991 1996
Canada Southwestern
N.S. Canada SouthwesternN.S. Canada SouthwesternN.S. Canada SouthwesternN.S. Education Level Number % Number % Number % Number % Number % Number % Number % Number %
Less than grade nine 4,744,840 31.2 17,595 40.7 3,731,170 20.0 15,380 31.0 2,959,765 13.9 11,805 22.4 2,727,085 12.1 10,330 19.9 University degree 719,890 4.7 1,065 2.5 1,490,040 8.0 1,955 3.9 2,419,645 11.4 2,615 5.0 3,000,675 13.3 3,070 5.9 Certificate or diploma in applied sciences, engineering, agricultural sciences, mathematics or physical sciences 905,230 4.2 1,155 2.2 1,107,880 4.9 1,290 2.5 Diploma or certificate from trade or technical school 1,799,415 8.4 4,520 8.6 1,999,465 8.8 5,060 9.8
Table 17
Educational Attainment of Working Population by Industries, the Maritimes, Nova Scotia, and Southwestern Nova Scotia Counties, 1996
Goods-Producing Industries Dynamic Services Public Services Less than Grade 12 (%) University Degree (%) Less than Grade 12 (%) University Degree (%) Less than Grade 12 (%) University Degree (%) Maritimes 40.4 6.8 22.1 18.0 13.4 34.6 Nova Scotia 39.1 7.8 22.1 20.4 13.2 35.3 Shelburne 56.7 1.4 46.2 6.1 20.4 28.2 Yarmouth 51.2 4.2 29.6 12.4 19.2 29.3 Digby 50.6 5.7 28.6 11.8 15.7 30.6
Source: Statistics Canada, 1996 census data compiled by Maurice Beaudin, ed., The Economic Region of Southwestern Nova Scotia (Moncton:
Watch Project … Southwestern Nova Scotia the dynamic services. Public employees, however, have higher education levels, and one-third of them have a university degree. This correlation between education and job sector is particularly applicable to the region under study, given that in Nova Scotia as a whole, and the Maritime provinces, the education gap between industrial sectors is less pronounced.
There are a number of reasons for this situation. First, Southwestern Nova Scotia is extremely disadvantaged in terms of institutions of higher learning. There is no English-language university in the region. The Université Sainte-Anne serves the Acadian community, where it plays an important role, but it is small (264 students in 1997–98).26 Yet Nova Scotia is known for its high concentration of universities. The province has thirteen universities, the second highest among Canada’s provinces. However, although Nova Scotia is home to 17 percent of Canadian universities, it accounts for only 5 percent of Canadian students. Furthermore, the province’s universities are concentrated in Halifax, with a few located in the regions, including Université Sainte-Anne in the southwest.
At the college level, the Collège de l’Acadie, for francophone students, has two training centres in the region, one in Tusket, in the county of Yarmouth, and the other in La Butte, in the county of Digby. The Nova Scotia Community College also has two campuses in the southwest. The Burridge campus, in Yarmouth, is fifty years old and offers approximately twenty full-time programs. Close to five hundred students are registered full-time at the Burridge campus, with another five hundred part-time students. The campus has doubled registra-tions in the last five year.27 The Shelburne campus is the smallest in the province, with only one hundred and sixty full-time and four hundred part-time students. it offers specialized training in aquaculture and recently introduced a sound recording arts program aimed specifically at the film industry.28
Data on education spending show that Nova Scotia reduced spending on education during the 1990s. In 1998–99, the province invested a total of $1.62 billion on education, a 4 percent drop from 1988–89. Spending at the college level was up 4 percent, but down 3 percent at the university level. In comparison, during the same period, Canada increased education spending by 13 percent, Prince Edward Island by 13 percent, and Quebec by 6 percent, whereas the education budget in Newfoundland and Labrador dropped 11 percent and was down 3 percent in New Brunswick.29 These budget cuts are quite likely to lead to reduced access to education.
Watch Project … Southwestern Nova Scotia The level of training and education of workers has a direct impact on their ability to adapt to changes in the labour market.30 And it is that ability to adapt that economic development leaders in Southwestern Nova Scotia are counting on. As we have seen in this section, the region’s economy is not faring too badly at the moment, thanks to its strong fisheries industry. However, it is far from being a flourishing knowledge economy. Moreover, the labour force is not able to meet the skill demands of the new economy. The labour force’s transition to a knowledge economy is a major challenge for the region. We will now look at this more subjective aspect.
Watch Project … Southwestern Nova Scotia II
T
HE CHALLENGES OF ECONOMIC DEVELOPMENTIt is our belief that the challenges of economic development are targets that must first be identified by regional economic players. Those challenges may consist of overcoming problems or drawing on collective ideals, but they call for the imple-mentation of a number of initiatives. A researcher can, in the best-case scenario, help point out those challenges, but the goals have no real value unless they are rooted in the realities experienced by the players themselves. For that reason, we have based the elements in this second section on discussions we had with socio-economic stakeholders in Southwestern Nova Scotia.31 We selected six major challenges that reflect the main problems to be overcome, and identified the region’s assets in terms of socio-economic development.
Joint Action by Socio-economic Stakeholders
Nova Scotia has a long tradition of community development. One example is the Antigonish Movement at the beginning of the twentieth century, an attempt to help Atlantic communities help themselves. It is thus no surprise to discover that this province still promotes a community economic development approach for its regions. In 1994, after several rounds of consultations, the government created Regional Development Authorities (RDA), and mandated them to implement a community economic development approach.32 The creation of the RDAs also reduced the high number of development structures scattered across the province.33 In 2001, Nova Scotia’s Department of Economic Development is still relying on those regional agencies, one of the two pillars of its development strategy.34 The second pillar is the private management company, Nova Scotia Business Inc., commissioned to foreign attract businesses to the province.
The funding structure of the RDAs contributes largely to their legitimacy in the regions and their ability to take action — they are funded in equal amounts by the three levels of government: municipal, provincial, and federal. By contributing financially to regional development, governments are demonstrating their com-mitment to joint action. It is particularly interesting to see municipal
31. “We” means not only the person who wrote this regional study, but the members of the INRS – UCS team who conducted field studies and, in particular, our colleague Maurice Beaudin of the CIRRD, whose studies provided us with extensive information.
Watch Project … Southwestern Nova Scotia governments participating in this initiative along with the provincial and federal governments.
There are two RDAs in Southwestern Nova Scotia: the Western Valley Deve-lopment Authority (WVDA), which covers both the county of Digby and the county of Annapolis (which is not included in our study), and the South West Shore Development Authority (SWSDA), which serves the counties of Yarmouth and Shelburne.
Those two RDAs are remarkably dynamic. In Digby, the WVDA symbolically set up shop on the former Cornwallis military base. The shockwave sent through the region by the 1994 closing of the base was somewhat lessened by the efforts of the WVDA, which was founded the same year. Having taken the time to establish the foundations of a community economic development initiative, the WVDA seems to have acquired an enviable reputation, both inside and outside the region. As the authors of a recent evaluation of the agency noted, the WVDA is a solid, well-organized agency, led by a committed, dynamic, and skilled team and a dedicated board of directors. The WVDA has earned several distinctions for its work, including being named by UNESCO as an international model of development processes and being included by the United Nations Centre for Human Settlements in a listing of Best Practices for Improving Living Conditions.35
The WVDA has an operating budget of $300,000 used as matching funding to attract other projects or investments in renewable energy, agriculture, sawmilling, employability measures, and so on. The WVDA was recently selected to run the Industry Canada Smart Community Demonstration Project in Nova Scotia, an $11.5 million initiative aimed at integrating rural communities into the new economy through the use of information technology.36
The SWSDA, which serves Yarmouth and Shelburne counties, was created in 1995.37 Although its profile is not as high as the Digby-Annapolis RDA, the SWSDA is doing everything it can. It owns three industrial parks, the former site of the Dominion Textile plant, and a new building that will be home to a large call centre, making it the only RDA that owns property, through an arrangement with the Yarmouth Area Industrial Commission. The SWSDA uses the property, valued at approximately $10 million, as a lever for its promotional and economic development activities.38 The SWSDA focuses on six sectors of economic growth for the region: light manufacturing, berry production, film production, information technology enhancement, communications infrastructure upgrading, and value-added processing. This RDA also plans to continue its efforts to
Watch Project … Southwestern Nova Scotia stabilize and improve the transportation infrastructure in the region, and continues to develop a host of projects not only in the area of economic development, but in training and family and community services as well.
The RDAs are complemented by Community Business Development Corpo-rations (CBDC), which assist rural communities by supporting the development of SMEs. There are three CBDCs in Southwestern Nova Scotia: in Digby, Yarmouth, and Shelburne. They provide advice and financial assistance of up to $125,000 (although the average in Nova Scotia is $30,000).39 Since 1995, the CBDCs are under the jurisdiction of the Atlantic Canada Opportunities Agency, which has a very limited regional presence, with only one liaison officer.
The francophone community, strongly present in the southwest, also has the
Conseil de développement économique de la Nouvelle-Écosse.40 Also, the
Université Sainte-Anne de Pointe-de-l’Église is home to the Jodrey Centre for small businesses, created in 1985 to serve as a resource centre for SMEs and create links among students, researchers, entrepreneurs, and public business assistance programs.
The region thus seems to benefit from an effective degree of joint action among socio-economic stakeholders. They have certainly set considerable deve-lopment goals for themselves, but the private sector and the various levels of government seem to be moving in the same direction. We encountered very little dissension in that regard, something that cannot always be said for other regions. ACOA plays a front-line role, stimulating and financially supporting economic growth. We should also point out the singular role played by Nova Scotia premier John Hamm, whose goal is a more equitable equalization system. His political leadership on that issue should encourage Nova Scotians to take action, which can only benefit their economic development.
Watch Project … Southwestern Nova Scotia
A Delicate Transition to the Knowledge Economy
Like all Canadian provinces and territories, Nova Scotia wants to make the transition to the new economy. In 2000, Premier Hamm’s Conservative govern-ment adopted an economic growth strategy aimed both at reinforcing the province’s foundation industries (fisheries, forestry, agriculture, tourism, and culture) and at stimulating the so-called growth industries, including the digital economy, energy, advanced manufacturing, learning, and life sciences.41 Among other measures, the government is supporting the WVDA Smart Community project, and is working to expand the benefits of that project into the other regions.
In co-operation with ACOA and a number of federal departments, the province has also developed a knowledge economy initiative with a $90 million budget, aimed at developing a better technology infrastructure to support Internet users. One quarter of that amount will be invested in research and development, mainly in universities, although colleges will eventually benefit. The R&D component has no immediate spin-off effect in Southwestern Nova Scotia, because there is no university research facility in the region. Finally, close to 50 percent of the budget is earmarked for schools, and the rest will be used to help communities connect to the Internet.
As we saw earlier, RDAs have also made these priorities their priorities. In addition to the WVDA Smart Community, the region has had a few other successes. In Yarmouth, the US firm Register.com is building a call centre that will employ 300 people. In Shelburne, the closed military base has been turned into a film production centre that has already been selected for the filming of American movies. Moreover, the Shelburne campus of the Nova Scotia Community College has introduced a sound recording arts program. In the municipality of Clare, a technology business incubator (Intellicentre@Clare)42 is being set up and is expected to accommodate four businesses and offer services to approximately fifteen more in the next two years.
In spite of these few successes, however, we cannot ignore the fact that Southwestern Nova Scotia is not well placed in terms of the knowledge economy. The recent study by Beaudin and Breau demonstrates that, overall, Atlantic Canada is lagging behind the rest of the country — 9 percent of jobs in the Maritimes are highly knowledge-based, compared with 13 percent in Canada as a whole. Nova Scotia accounts for the greatest percentage of highly knowledge-based jobs in Atlantic Canada. Beaudin and Breau estimate that 43 percent of those jobs are concentrated in Nova Scotia, mainly in the biopharmaceutical