HAL Id: hal-02696294
https://hal.inrae.fr/hal-02696294
Submitted on 1 Jun 2020
HAL is a multi-disciplinary open access
archive for the deposit and dissemination of
sci-entific research documents, whether they are
pub-lished or not. The documents may come from
teaching and research institutions in France or
abroad, or from public or private research centers.
L’archive ouverte pluridisciplinaire HAL, est
destinée au dépôt et à la diffusion de documents
scientifiques de niveau recherche, publiés ou non,
émanant des établissements d’enseignement et de
recherche français ou étrangers, des laboratoires
publics ou privés.
Simple high-performance liquid chromatographic
method to analyse megazol in human and rat plasma
Bertin Enanga, Christian Labat, Hamid Boudra, G. Chauvière, M. Keita, B.
Bouteille, Michel Dumas, Georges Houin
To cite this version:
Bertin Enanga, Christian Labat, Hamid Boudra, G. Chauvière, M. Keita, et al..
Simple
high-performance liquid chromatographic method to analyse megazol in human and rat plasma. Journal
of Chromatography B - Analytical Technologies in the Biomedical and Life Sciences, Elsevier, 1997,
696 (2), pp.261-266. �10.1016/s0378-4347(97)00262-4�. �hal-02696294�
ELSEVIER
Journal of Chromatography B, 696 (1997) 261-266CHROMATOGRAPHY B
Simple high-performance liquid chromatographic method to analyse
megazol in human and rat plasma
B. Enanga a'c, C. Labat c, H. Boudra c, G. Chauvi~re b, M. Keita a, B. Bouteille a,
M. Dumas a, G. Houin c'*
a
lnstitut d'Epidimiologie Neurologique et de Neurologie Tropicale, FacultO de Midecine, 2 Rue du Docteur Marcland, F o°7025 Limoges, France
hGroupe de Chimie Organique Biologique URA-CNRS 454-470, Universiti Paul Sabatier, 118 Route de Narbonne, Bg~t.IIR1-B2, F 31062 Toulouse. France
~Laboratoire de Cin~tique des Xinobiotiques, Faculti des Sciences Pharmaceutiques, 35 Chemin des Mara~chers, F 31062 Toulouse, France
Received 10 December 1996; received in revised form 18 April 1997; accepted 18 April 1997
Abstract
A simple and sensitive high-performance liquid chromatographic method has been developed to measure megazol in human plasma. The method was optimized and validated according to the Washington Concensus Conference on the Validation of Analytical Methods (V.P. Shah et al., Eur. J. Drug Metab. Pharmacokinet., 15 (1991) 249). The criteria of complete validation were specificity, linearity, precision, analytical recovery, dilution and stability. It involved extraction of the plasma with dichloromethane, followed by reversed-phase high-performance liquid chromatography using a Kromasil R C 8 column and UV detection at 360 nm. The retention times of the internal standard (tinidazol) and megazol were 6.10 and 9.60 min, respectively. The standard curve was linear from 2 ng ml -~ (limit of quantification) to 2000 ng ml-~. The coefficients of variation for all the criteria of validation were less than 6%; 85 to 92% extraction efficiencies were obtained. Megazol was stable during the storage period (one month at -20°C) in plasma and for two months at 25°C in standard solution. The method was tested by measuring the plasma concentration following oral administration to rat and was shown to be suitable for pharmacokinetic studies. © 1997 Elsevier Science B.V.
Keywords: Megazol
1. Introduction
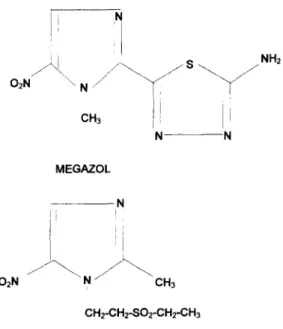
Megazol is a 5-nitroimidazole thiadiazole (Fig. 1) that was first synthesised in 1968 by B e r k e l h a m m e r and Asato [1], who screened it for its efficacy against
Corresponding author.
protozoal infections in mice. Recently, Bouteille et al. [2] studied megazol activity against T r y p a n o s o m a b r u c e i b r u c e i infections in mice. In vitro, megazol exhibited a trypanocidal effect with an MECto 0 (100% minimal effective concentration) equal to 0.1 Ixg m l - 1 , which is ten-times more effective than that o f Suramin ( M E C l o o = I Ixg m l - 1 ) . In vivo, a single 20 mg k g - i injection of megazol cured mice o f acute trypanosomal infection. For subacute infection with 0378-4347/97/$17.00 Copyright © 1997 Elsevier Science B.V. All rights reserved.
262 B. Enanga et al. / J. Chromatogr. B 696 (1997) 2 6 1 - 2 6 6 N
'i
NH2
02N" \ N / / ' ~ " F ~
I , i N - - N MEGAZOLO2N
N
~ " N
~ C H 3
CH2-CH2-SO2-CH2"CH3
TINIDAZOL (I.S.)Fig. l. Structures of megazol and tinidazol.
central nervous system involvement, megazol or Suramin administered alone did not show any effect on the progression of the disease. In contrast, their combined use proved to be extremely effective. It is not known if the trypanocidal effect is due to the parent compound or to one or more of its metabo- lites. Determination of megazol in biological fluids would clarify whether megazol crosses the blood- brain barrier or not, and would allow phar- macokinetic studies to be carried out in vivo.
The purpose of this paper is to describe a complete optimised high-performance liquid chromatographic (HPLC) method and its full validation according to the Washington Conference Consensus on the Valida- tion of Analytical Methods [3]. The quantification of megazol is validated in human plasma and has been applied to rat plasma.
2. Experimental
2.1. Chemicals
Megazol, 2-amino-5- [ 1-methyl-5-nitro-2-im-
idazolyl]l,3,4 thiadiazole was synthesised by G.
Chauvi~re and tinidazol, used as the internal stan- dard, was purchased from Sigma, France (ref. 32H0386).
2.2. Reagents
Chemicals were of analytical grade and human plasma was obtained from Institute Jacques Boy, France.
2.3. Extraction procedure
To 1 ml of plasma, 50 ill of the internal standard solution (10 I~g ml -~ in mobile phase) and 50 Ixl of 1 M sodium hydroxide were added in a 15-ml conical polypropylene tube with 7 ml of dichlorome- thane. The samples were mixed on a rotatory agitator for 20 min, then centrifuged at 1636 g for 10 min.
After centrifugation, the organic phase (5 ml) was transferred to glass tubes and evaporated to dryness at 45°C under a stream of nitrogen. The dried residues were redissolved by vortex agitation in the mobile phase (200 I~1) and 50 Ixl of the extract was injected onto the HPLC column.
2.4. Chromatographic system
The following modular HPLC system was used: a Model SP-8810 precision isocratic pump at 170 bar (Spectra Physics, Darmstadt, Germany), a Model Spectra chrom 100 UV monitor (Spectra Physics) fitted with a Model SP-8875 automatic sampler (Spectra Physics) and equipped with a 50-1xi loop. Data processing and calculations were carried out using a Chrom jet integrator (Spectra Physics) with the help of PCe software WINner/286 (Spectra Physics).
The Kromasil R column (250×4 mm I.D, 10 txm particle size) was packed with C 8 (Bischoff Chroma- tography, Leonberg, Germany). The mobile phase consisted of 0.068 M phosphate buffer, pH 3, containing methanol and acetonitrile (65:20:15, v/v). The flow-rate was set at 0.7 ml min -t and UV detection was at 360 nm. The system was used at room temperature.
2.5. Validation criteria 2.5.1. Specificity
This criteria was validated on analysing human samples from six different subjects.
sion and accuracy of each QC value should not have exceeded a deviation of 15%, except for the QC samples near the limit of quantification (LOQ), where 20% was acceptable.
2.5.2. Analytical recovery
Analytical recovery was determined by comparing the peak areas of extracts to that obtained on direct injection of the same amount of megazol in mobile phase solution. The assay was determined at three concentrations, each of which was analysed in triplicate.
2.5. 7. Pharmacokinetics in rat
Megazol concentrations in rat plasma were ob- tained after a single oral dose of 10 mg kg-~ over 24 h.
3. Results and discussion
2.5.3. Calibration curves
Working standards were prepared in drug-free plasma (900 ~zl) from the stock standard (100 p~l) to yield concentrations of 2, 5, 10, 50, 500, 1000, 1600 and 2000 ng ml -~ (free-base) in plasma. Nine reference samples for calibration were included in the daily series of analysis. The calibration factors were calculated according to least-squares linear regression, weighted by 1/C.
2.5.4. Intra- and inter-day variability
These assays were determined by HPLC analysis of six quality control (QC) samples for each con- centration (5, 110 and 1400 ng ml -~) during the same day (repeatability) and of two samples for each concentration on five consecutive days (reproducibil- ity).
2.5.5. Dilution
The influence of dilution was studied on a blank plasma sample spiked to obtain a concentration that was two-fold higher than the maximal concentration of the calibration curve. It was then diluted to one third with the same plasma.
3.1. Specificity
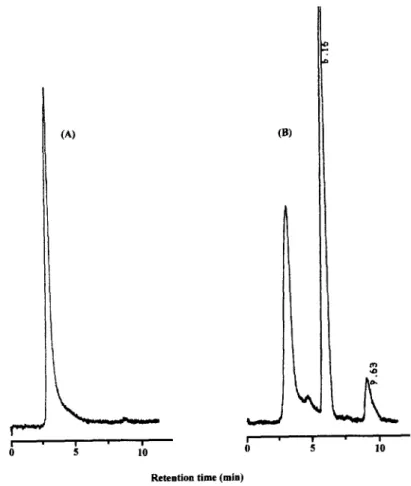
Fig. 2 illustrates representative chromatograms of a blank plasma and plasma spiked with 10 ng ml -t of megazol and with 500 ng of tinidazol. The two peaks were well separated, with retention times of 6.10 and 9.60 min for internal standard and megazol, respectively, using a mobile phase composed of phosphate buffer-methanol-acetonitrile. No peaks from endogenous compounds that interfered with megazol and tinidazol were observed with the six tested plasma samples.
3.2. Extraction and recovery
Since the evaporation time for a dichloromethane extract was significantly lower (20 min) and gave a very clean extract, this solvent was chosen. The analytical recoveries of megazol at 5, 110 and 1400 ng ml -~ were 90.8, 92.2 and 87.5%, respectively (n=3) for each concentration level. The recovery of internal standard was also good (93%) at 2500 ng ml -I.
3.3. Linearity and sensitivity 2.5.6. Stability
The stability of megazol in plasma was evaluated for one month at -20°C, and for three freeze-thaw cycles. The validation criteria were calculated using commonly accepted statistical procedures. The preci-
Excellent linearity was observed between the peak area ratios in plasma (megazol/tinidazol) and the theoretical concentrations (r2=0.999). The LOQ was 2 ng ml -~ in plasma. The calibration curve data obtained throughout the validation study are summa-
264 B. Enanga et al. / J. Chromatogr. B 696 (1997) 2 6 1 - 2 6 6
(A) (B)
,__ <__.__
~
~
~
;
1'0
Retention time (min)
Fig. 2. Chromatograms of plasma extracts. (A) Blank human plasma, (B) human plasma spiked with 10 ng/ml of megazol and 500 ng of tinidazol.
rised in Table 1. The day-to-day slope variability of the calibration curves was 0.57% (n=5).
3.4. Influence of dilution
The precision and accuracy of six replicates of diluted plasma were 2.8 and 99.4%, respectively.
3,5. Intra- and inter-day validation
The within- and between-day variations of QC samples are given in Table 2. For each level, the repeatability and reproducibility criteria were clearly satisfactory. The accuracy for both assays (intra- and inter-day) was greater than 90% for all tested concentrations.
3.6. Stability
After four weeks of storage at - 2 0 ° C , QC sam- ples were shown to be stable at three concentrations (Table 3). No significant degradation of megazol was observed after three freeze-thaw cycles: 101 vs. 102 ng ml ~ and 1304 vs. 1332 ng ml -~. The standard solution of 50 ng ml -~ that was stored at room temperature was tested six times from the time of its preparation up to 25 days and the results indicate that the solution of megazol was stable. Also, the dry extract was shown to be stable at 4°C for 24 h.
3. 7. Application
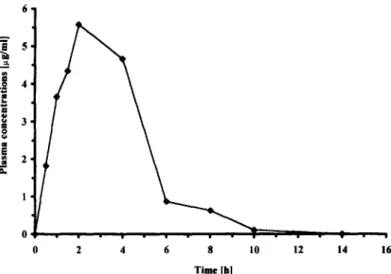
Fig. 3 illustrates the plasma concentrations mea- sured over 24 h after a single oral dose of 10 mg
Table 1
Calibration curve data (inter-assay precision)
C (ng/ml) 2 5 10 50 500 1000 1600 2000 Day 1 1.971 5.216 8.972 5 4 , 6 3 2 494.397 9 8 4 . 6 3 1 1 5 9 4 . 2 9 3 2022.888 Day 2 2.225 5.084 9.466 47.091 4 8 2 . 0 1 9 1 0 1 1 . 4 8 1 1 6 1 7 . 5 3 9 1992.096 Day 3 1.868 4.818 10.737 5 3 . 1 6 2 482.231 9 8 4 . 0 8 6 1 6 1 3 . 2 8 5 2016.813 Day 4 1.996 5.302 9,775 4 8 . 6 0 2 4 8 7 . 5 4 4 1 0 1 7 . 9 3 5 1 6 0 8 . 0 9 0 1987.757 Day 5 2.155 4.496 9.625 5 3 . 3 5 3 497.733 9 9 2 , 0 2 5 1620.301 1987.313 Mean 2.04 4.98 9.71 51.37 488.8 998.0 1610.7 2001.4 S.D. 0.14 0.33 0.65 3.31 7.10 15.71 10.27 17.11 CV % 7.07 6.59 6.65 6.44 1.45 1.57 0.64 0.85 Accuracy % 97,84 99.66 97.15 97.26 97.76 99.8 99.33 99.93 Table 2
Analysis precision of quality control samples
Inter-day precision lntra-day precision
QC1 QC2 QC3 QC1 QC2 QC3 5 110 1400 5.5 119 1410.4 5.5 126.2 1440.2 4.1 112.1 1371.9 4.7 119.8 1366.6 3.2 118.8 1396.1 4.2 119 1370.7 3.9 128.6 1396 4.9 111.3 1420.4 4.6 120.5 1390.5 4.3 114.6 1362.8 Mean 4.50 119.00 1392.60 S.D. 0.70 5.50 25.50 C.V. (%) 16.00 4.60 1.80 Accuracy (%) 89.60 91.80 99.50 5 110 1400 5 112.1 1295.5 4.7 119.8 1352.5 4.1 109 1371.9 5.2 97.7 1366.6 5.3 109.8 1396.5 5.1 102.5 1302.8 Mean 4.90 108.5 1347.6 S.D. 0.40 7.70 40.2 C.V. (%) 8.90 7.10 3.00 Accuracy (%) 98.00 98.60 96.30 Table 3
Stability of megazol in human plasma at -20°C
QC 1 QC 2 QC 3 Mean S.D. C.V. (%) Accuracy (%) 4,600 121.7 1365.80 4.000 107,5 1445.40 3,500 120,3 1411.2 3.900 110,9 1442.8 3.800 116 1297,8 3.000 118.8 1405,30 3.800 115.9 1399.70 0.500 5.6 58.70 14.20 4.80 4.20 75.90 94.70 99.90 k g - J m e g a z o l in rats. E a c h v a l u e c o r r e s p o n d s to the m e a n o f t h r e e s a m p l e s . T h i s figure s h o w s that t h e t e c h n i q u e is s u i t a b l e f o r p h a r m a c o k i n e t i c s t u d i e s o f m e g a z o l . A c k n o w l e d g m e n t s T h i s w o r k r e c e i v e d t h e f i n a n c i a l s u p p o r t o f M i n i s - tbre F r a n q a i s d e la C o o p 6 r a t i o n ( P r o g r a m m e M o b i l i s a t e u r T r y p a n o s o m i a s e , P r o j e t T R - 9 6 0 3 ) . T h e
266 B. Enanga et al. / J. Chromatogr. B 696 (1997) 261-266 g l g
[
u m 6 , i 5 , 4, 3 2 1 0 . . . ! tt 2 4 6 8 10 12 14 Time [hiFig. 3. Plasma concentrations versus time profile of megazol.
16
help of John Woodley in the preparation of the manuscript was gratefully acknowledged.
[3] V.P. Shah, K.K. Midha, S. Dighe, l.J. McGilveray, J.P. Skelly, A. Yacobi, T. Layloff, C.T. Viswanathan, C.E. Cook, R.D. McDowall, K.A. Pittman, S. Spector, Eur. J. Drug Metab. Pharmacokinet. 16 ( 1991 ) 249.
References
[1] G. Berkelhammer, G. Asato, Science 162 (1968) 1146. [2] B. Bouteille, A. Marie-Daragon, G. Chauvi6re, C. De
Albuquerque, B. Enanga, M.L. Dard6, J.M. Vallat, J. P6ri~, M. Dumas, Acta Trop. 60 (1995) 73,