UNIVERSITÉ DE MONTRÉAL
TOOL CONDITION MONITORING AND SURFACE TOPOGRAPHY ANALYSIS DURING THE MACHINING OF CFRP COMPOSITES
XAVIER RIMPAULT
DÉPARTEMENT DE GÉNIE MÉCANIQUE ÉCOLE POLYTECHNIQUE DE MONTRÉAL
THÈSE PRÉSENTÉE EN VUE DE L’OBTENTION DU DIPLÔME DE PHILOSOPHIAE DOCTOR
(GÉNIE MÉCANIQUE) DÉCEMBRE 2016
UNIVERSITÉ DE MONTRÉAL
ÉCOLE POLYTECHNIQUE DE MONTRÉAL
Cette thèse intitulée :
TOOL CONDITION MONITORING AND SURFACE TOPOGRAPHY ANALYSIS DURING THE MACHINING OF CFRP COMPOSITES
présentée par : RIMPAULT Xavier
en vue de l’obtention du diplôme de : Philosophiae Doctor a été dûment acceptée par le jury d’examen constitué de :
M. LAKIS Aouni A., Ph. D., président
M. BALAZINSKI Marek, Docteur ès Sciences, membre et directeur de recherche Mme SAPIEHA Jolanta Ewa, Ph. D., membre et codirectrice de recherche
M. CHATELAIN Jean-François, Ph. D., membre et codirecteur de recherche M. BOUKHILI Rachid, Doctorat, membre
ACKNOWLEDGEMENTS
I would never have been able to complete this thesis without the assistance of my committee members and colleagues, and the help and support of my friends and family.
Foremost, I would like to express my deepest gratitude to my advisor, Prof. Marek Balazinski, for the continuous support of my Ph. D. study and research, for his motivation and enthusiasm. I would like to thank my co-advisors, Prof. Jean-François Chatelain and Prof. Jolanta Klemberg-Sapieha, for their guidance, help and patience.
My sincere thanks also goes to the rest of my thesis committee: Prof. Diane Riopel, Prof. Rachid Boukhili, Prof. Aouni A. Lakis and Prof. Benoit Furet, for their encouragement, insightful comments and hard questions.
I would like to thank technicians at the virtual manufacturing research laboratory (LRFV) in Polytechnique Montreal, Guy Gironne, Vincent Mayer and François Ménard, and at the products, processes, and systems engineering laboratory (LIPPS) in ÉTS, Éric Marcoux, for their advice, time and assistance. I would like to thank our industrial partners in the CRIAQ MANU-413 project. I would also like to thank Karina Mateo-Rodriguez, Marie-Michèle Vézina and Caroline Jodoin at Service des Étudiants de Polytechnique for giving me the job opportunity and help for students with disabilities.
Obviously, I am very grateful to my numerous colleagues and friends who supported me during all those years, with special thanks to my friend, colleague and love, Anna Łoś.
RÉSUMÉ
Les composites polymères notamment FRP (fibre reinforced plastics) sont de plus en plus employés dans l’industrie manufacturière (aéronautique et automobile notamment) pour la confection de leurs produits. L’emploi de carbone dans les FRP est en particulier prisé pour ses caractéristiques mécaniques. Depuis quelques décennies, le mélange de matériaux composites et métalliques au sein de structures de produits apporte des défis supplémentaires lors de leur assemblage. Face à ces nouveaux matériaux, les scientifiques et industriels réemploient les techniques qui ont été bâties et fait leurs preuves pour des matériaux métalliques relativement homogènes. Cependant, de par les propriétés intrinsèques des composites FRP, l’état de surface est fondamentalement hétérogène et la caractérisation de l’état de surface en devient complexe. Un autre point, de par ces spécificités, usiner un tel matériau provoque des petites vibrations additionnelles que l’on pourrait qualifier de bruit sur des signaux vibratoires, en comparaison avec l’usinage de métaux.
Cette thèse vise à répondre aux problèmes de caractérisation de surface mais aussi au développement d’une technique novatrice de suivi de la qualité de coupe. La technique développée se base sur la théorie fractale et l’analyse fractale pour répondre aux besoins de la quantification du bruit sur les signaux de forces de coupe ou de vibration. L’analyse fractale permet de mettre en évidence le niveau de complexité et de rugosité d’objets. Pour bâtir et valider cette méthode, plusieurs tests ont été réalisés : détourage, perçage axial et orbital. Malgré le niveau élémentaire du développement de cette technique, les premiers résultats sont prometteurs. Mise en place sur une cellule de fabrication, cette méthode permet d’évaluer, en un temps très court, le niveau d’usure d’outil (en vue de son possible remplacement) ainsi que la qualité de coupe générée.
Pour la caractérisation de surface de composites laminés, l’étude s’est premièrement basée sur des relevés de profils de surface et de rugosité. Dans chacune des deux directions principales (dans le sens du pli et dans le sens de l’empilement), des problèmes spécifiques ont été mis en évidence. Et pour chacune des directions, un plan correctif des méthodes de caractérisation actuelles a été proposé. Le résultat de ces optimisations proposées permet de mieux évaluer l’état de surface au vue de la qualité de coupe ainsi que de la robustesse du procédé.
ABSTRACT
Polymer composites such as FRPs (fiber reinforced plastics) have been increasingly used by the manufacturing industry (aerospace and automotive in particular) in the making of their products. The carbon selection in FRPs is especially preferred for its mechanical properties. For few decades, the combination of composite and metallic materials within products’ structure has been raising up additional challenges during the assembly. To solve those issues, scientists and industrials often reused techniques that had been built and proved for relatively homogeneous metallic materials. However, due to the intrinsic properties of FRP composites, the surface condition is particularly heterogeneous and such surface condition characterization tend to be more complex. Furthermore, machining a FRP material generates additional short vibrations that could be evaluated as noise in the vibration signals in comparison with the machining of metals.
This thesis is a contribution to solutions to surface characterization issues and proposes an innovative technique of machining quality monitoring. The developed technique is based on the fractal theory and fractal analysis to meet the needs of the noise assessment in the cutting forces or vibration signals. Fractal analysis allows to evaluate the complexity and roughness of objects. To build and validate this method, several tests were performed: trimming, drilling axial and orbital. Despite the relatively low level of development of this technique, first results are promising. Set up in a manufacturing cell, this method allows to evaluate, in a very short time, the tool wear (for possible tool replacement) and the machining quality.
For laminated composites’ surface characterization, the study is primarily based on surface profiles and roughness observations. For both two main directions (in the ply plane direction and in the direction of the stack sequence), specific problems have been highlighted. And for each direction, a corrective plan of current characterization methods proposed. The result of those proposed enhancements to better evaluate the surface condition in view of the machining quality and process robustness.
TABLE OF CONTENTS
ACKNOWLEDGEMENTS ... III RÉSUMÉ ... IV ABSTRACT ... V TABLE OF CONTENTS ... VI LIST OF TABLES ... X LIST OF FIGURES ...XII LIST OF SYMBOLS AND ABBREVIATIONS... XVIII LIST OF APPENDICES ... XIX PREAMBLE ... XXCHAPTER 1 INTRODUCTION ... 1
1.1 Problem description ... 1
1.2 Objectives ... 2
CHAPTER 2 LITERATURE REVIEW ... 4
2.1 Fibre reinforced plastics (FRP) ... 4
2.1.1 Generalities ... 4
2.1.2 Carbon fibre reinforced plastics (CFRP) ... 4
2.1.3 Mechanical properties ... 6 2.2 Machining of FRPs ... 7 2.2.1 Orthogonal cutting ... 7 2.2.2 Chip formation ... 9 2.2.3 Tooling ... 10 2.3 Machining quality ... 11 2.3.1 Surface integrity ... 11
2.3.2 Surface topography ... 13
2.4 Surface roughness ... 15
2.5 Fractal objects ... 18
2.5.1 Concept and generalities ... 18
2.5.2 Fractal analysis techniques ... 19
CHAPTER 3 GENERAL PRESENTATION ... 21
CHAPTER 4 ARTICLE 1: TOOL WEAR AND SURFACE QUALITY ASSESSMENT OF CFRP TRIMMING USING FRACTAL ANALYSES OF THE CUTTING FORCE SIGNALS 24 4.1 Abstract ... 24
4.2 Introduction ... 24
4.2.1 CFRP ... 24
4.2.2 Fractal analysis ... 25
4.3 Workpiece, machine, setup and tooling specifications ... 26
4.4 Methodology ... 27
4.4.1 Design of experiments ... 27
4.4.2 Measurements ... 28
4.4.3 Analyses performed ... 29
4.5 Fractal dimension calculation methods ... 30
4.5.1 Box-counting fractal analysis ... 32
4.5.2 Correlation fractal analysis ... 33
4.5.3 Regularization fractal analysis ... 35
4.6 Results and discussion ... 37
4.6.1 Statistical parameters ... 37
4.6.2 Fractal parameters ... 39
4.7 Conclusion ... 45
4.8 Acknowledgements ... 46
4.9 References ... 46
CHAPTER 5 ARTICLE 2: A NEW APPROACH FOR THE SURFACE ROUGHNESS PROFILE CHARACTERIZATION OF LAMINATED COMPOSITES IN THE PLY PLANE DIRECTION ... 49 5.1 Abstract ... 49 5.2 Introduction ... 49 5.3 Methodology ... 51 5.3.1 Design of experiments ... 51 5.3.2 Experimental setup ... 52 5.3.3 Measurements ... 52
5.3.4 Calculated roughness parameters ... 54
5.4 Results and discussion ... 58
5.4.1 Roughness profiles ... 58 5.4.2 Autocorrelation ... 59 5.4.3 Fractal analysis ... 62 5.5 Conclusion ... 64 5.6 Acknowledgements ... 64 5.7 References ... 64
CHAPTER 6 ARTICLE 3: SURFACE PROFILE TEXTURE CHARACTERIZATION OF TRIMMED LAMINATED COMPOSITE IN THE STACKING SEQUENCE DIRECTION .... 66
6.1 Abstract ... 66
6.2 Introduction ... 66
6.2.2 Surface profile characterization ... 68
6.3 Methodology ... 70
6.3.1 Primary profiles filtering ... 70
6.3.2 Machining experiments ... 75
6.3.3 Profile measurements ... 75
6.3.4 Parametrization and filtering method assessment ... 76
6.3.5 Complementary analysis ... 77
6.4 Results and discussion ... 78
6.4.1 Primary profiles ... 78
6.4.2 Roughness profiles obtained using linear Gaussian filter ... 81
6.4.3 Roughness profiles obtained using standards filtering for different stratified properties surface ... 81
6.4.4 Roughness profiles with valleys removing ... 83
6.5 Conclusion ... 89
6.6 Acknowledgements ... 90
6.7 References ... 90
CHAPTER 7 GENERAL DISCUSSION ... 92
7.1 Fractal analysis of CFRP machining signals ... 92
7.2 Topography analysis of laminated composite ... 93
CHAPTER 8 GENERAL CONCLUSION AND RECOMMENDATIONS ... 94
8.1 Original contributions ... 94
8.2 Future works ... 97
BIBLIOGRAPHY ... 98
LIST OF TABLES
Table 2.1: Carbon fibre general characteristics (Berthelot, 2012) ... 5
Table 2.2: Mechanical characteristics of epoxy resin (Berthelot, 2012) ... 6
Table 4.1: Tool geometrical characteristics ... 26
Table 4.2: Chosen cutting parameters for the machining experiments using three tools with the same characteristics ... 27
Table 4.3: Picture samples of the clearance tool wear for the tool 1 along its tool life ... 28
Table 5.1: Chosen cutting parameters for the machining tests ... 52
Table 5.2: Profile length datasheet ... 53
Table 6.1: Profile characteristics datasheet ... 69
Table 6.2: Chosen profile parameters ... 77
Table 6.3: Averages and maximums of the relative standard deviations calculated on each face for up and down milling faces, for primary parameters (a); for roughness parameters from roughness profiles filtered using the linear Gaussian function with the 0.25 mm cut off length (b); for roughness parameters from profiles filtered using the filtering technique from ISO 13565-1, using the same 2.5 mm cut off length (c) and two different cut off lengths (2.5 mm and then 0.25 mm) (d) – (all values are in percentage) ... 82
Table 6.4: Averages and maximums of the relative standard deviations calculated on each face for up- and down-milling faces and for plateau primary parameters and plateau roughness profiles (the values are presented in percentage) ... 86
Table 8.1: Journal publication list (ranked by chronological order using the submission date) .... 95
Table 8.2: Communication list in conferences (ranked by chronological order using the conference/symposium date as reference) ... 96
Table A.1: Conducted plans of experiments for the twist drills ... 113
Table A.2: Means of the titanium burr height ratios for each couple of feed and speed corresponding to the titanium layer... 118
Table A.3: Means of the aluminium burr height ratios for each couple of feed and speed corresponding to the aluminium layer ... 120 Table A.4: Means of the calculated force signal fractal dimensions 𝐷𝑅 for each couple of feed and
speed levels corresponding to the CFRP layer ... 124 Table B.1: Cutting parameters ... 132
LIST OF FIGURES
Figure 2-1: Lay-up laminate (Campbell, 2010) ... 5
Figure 2-2: Longitudinal strength/ultimate strength ratio as function of ply angle (left); Tensile properties of fibers, matrix and composite material (right) (Campbell, 2010) ... 6
Figure 2-3: Orthogonal and oblique cutting process geometries (Altintas, 2012) ... 7
Figure 2-4: Crack propagation modes (Hudson & Harrison, 1997) ... 8
Figure 2-5: McKenzie angles definition (Bonnet, 2010) ... 8
Figure 2-6: Cutting mechanisms for CFRP composites machining in parallel and perpendicular directions (Koplev et al., 1983) ... 9
Figure 2-7: UD cutting mechanisms (Arola, Ramulu, & Wang, 1996) ... 9
Figure 2-8: Up- and down- milling (Sheikh-Ahmad, J. Y., 2009) ... 10
Figure 2-9: Delamination types (Colligan, 1991) ... 12
Figure 2-10: Delamination factor (Davim, J. P. & Reis, 2005) ... 12
Figure 2-11: Fibre orientation effect on the profile surface roughness with different depth of cut (a) 0.001mm; (b) 0.050mm (Wang, X. M. & Zhang, 2003). ... 15
Figure 2-12: Comparison of roughness profiles for four orientations using three set of cutting parameters (Chatelain et al., 2012) ... 16
Figure 2-13: Different types of roughness profiles (Chatelain et al., 2012) ... 17
Figure 2-14: Koch curve iterations (Davim, J. et al., 2011) ... 19
Figure 2-15: Fractal analysis evaluating the British coastline length using different stick lengths (Andrus, 2005) ... 20
Figure 3-1: Thesis organization plan ... 23
Figure 4-1: Experimental setup used for short cuts machining (100 mm) ... 27
Figure 4-2: Cutting forces measured from the first cut of the 1st pass of the tool 1 (for graph clarity, the signals were shifted one from another) ... 30
Figure 4-3: Weierstrass-Mandelbrot functions generated with different values of the parameter or fractal dimension 𝐷 ... 31 Figure 4-4: Total cutting force signal samples FT over three rotational periods for different tool
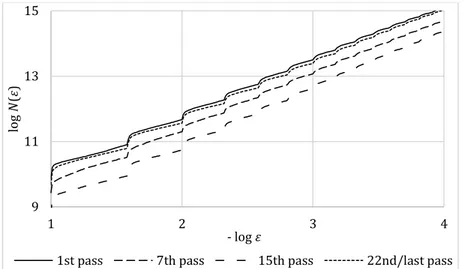
wear of tool 1 (from 1st pass with a new tool to the 22nd pass with a worn tool) ... 32 Figure 4-5: Box counting graph (box number containing the curve vs the size box) for different
tool wear of the tool 1 ... 33 Figure 4-6: Correlation analysis graph (log (𝜀) vs log 𝜀) for different tool wear of the tool 1 ... 34 Figure 4-7: Regularization analysis graph (log 𝑙𝑎 vs log 𝑎) using the 1st derivative Gaussian
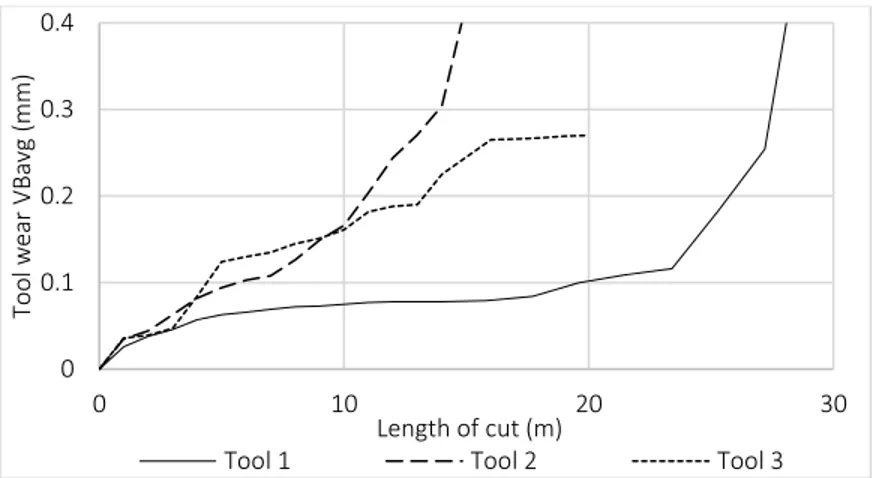
function kernel ... 36 Figure 4-8: Regularization analysis graph (log 𝑙𝑎 vs log 𝑎) using the rectangular kernel ... 36 Figure 4-9: Evolution of the tool wear VBavg vs the length of CFRP cut ... 37 Figure 4-10: Averages and standard deviations of the total cutting force signals vs the averaged
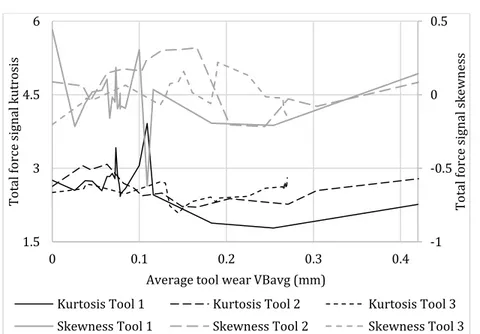
tool wear VBavg ... 38 Figure 4-11: Skewness (asymmetry) and kurtosis (flatness) of the total cutting force signals vs the
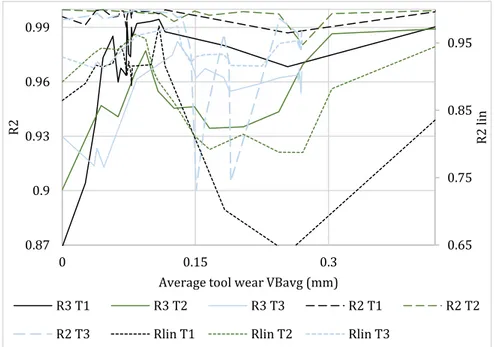
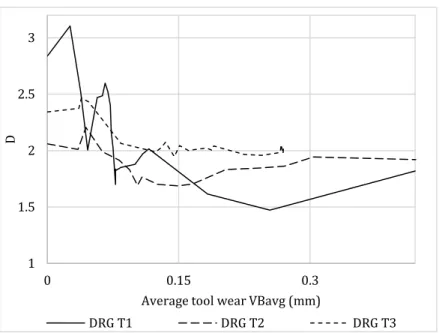
averaged tool wear VBavg ... 38 Figure 4-12: Topothesy results vs the tool wear average VBavg ... 39 Figure 4-13: Fractal dimensions graph (fractal dimensions DBC, DC, DRG, DRR) in comparison to the
averaged tool wear VBavg ... 40 Figure 4-14: Coefficient of fractal dimension slope determination vs the averaged tool wear VBavg ... 41 Figure 4-15: Fractal index If vs the tool wear VBavg ... 42 Figure 4-16: Cutting force signal samples over two tool rotational periods for different tool wear
of tool 1: feed force signal 𝐹𝑓 (left), normal force signal 𝐹𝑛 (centre) and vertical force signal 𝐹𝑧 (right) ... 43 Figure 4-17: Fractal dimensions graph in comparison to the averaged tool wear VBavg ... 44 Figure 4-18: Coefficient of fractal dimension slope determination vs the averaged tool wear 𝑉𝐵𝑎𝑣𝑔
Figure 5-1: Roughness profiles examples of -45° ply orientation giving similar Ra, Rsk and Rku with low (left) and high (right) tool wear ... 51 Figure 5-2: Measurement area on the machined coupon face ... 53 Figure 5-3: Roughness profile samples for the four ply orientations and both face milling types and
machined with different tool wear (first, ninth and twentieth passes respectively a, b and c, respectively with the tool wear of 0 mm, 0.07 mm and 0.19 mm) of tool 1 ... 55 Figure 5-4: Roughness parameters associated with the normalized autocorrelation function 𝑎𝑐𝑓 56 Figure 5-5: Regularization analysis graph using the rectangular kernel ... 57 Figure 5-6: Roughness parameter Ra values average vs. the averaged tool wear VB for the four ply
orientations and both milling types ... 60 Figure 5-7: Autocorrelation results 𝑅𝐴𝐶𝑎0 average (𝑎𝑐𝑓 average deviation towards zero) vs the
averaged tool wear 𝑉𝐵 for the four ply orientations and both milling types ... 61 Figure 5-8: Fractal parameter 𝑅𝑅2 ℎ𝑖𝑔ℎ results average vs the averaged tool wear 𝑉𝐵 for the four
ply orientations and both milling types ... 63 Figure 6-1: Surface profile measurements in longitudinal and transverse direction on a trimmed
laminated composite surface ... 67 Figure 6-2: Simplified chart of surface profile characterization ... 68 Figure 6-3: Examples of waviness profiles using the Gaussian probability density function filter
and different cut-off lengths ... 69 Figure 6-4: Roughness profile examples using the Gaussian probability density function filter and
different cut-off lengths (roughness profiles are in black based on the primary profile in grey) ... 70 Figure 6-5: Filtering technique using the modified ISO 13565-1 method ... 72 Figure 6-6: Simplified chart of the plateau roughness characterization ... 73 Figure 6-7: Plateau roughness profile example: removal of the profile deep valleys (left), primary
and roughness plateau profiles (right) ... 74 Figure 6-8: Surface profile measurement area on the coupon ... 76
Figure 6-9: Primary profiles examples for different tool wear and both up- and down-milling with the stacking sequence from left to right for each profile: 0˚/+45˚/-45˚/+45˚/-45˚/0˚/-45˚/ +45˚/90˚/90˚/+45˚/-45˚/0˚/-45˚/+45˚/-45˚/45˚/0˚/+45˚/-45˚ (uncut fibres are circled) ... 79 Figure 6-10: Amplitude Distribution Curves (ADC) and Bearing Area Curves (BAC) examples of
primary profiles for different tool wear and both up- and down-milling ... 80 Figure 6-11: Amplitude Distribution Curves (ADC) and Bearing Area Curves (BAC) examples of
roughness profiles for different tool wear obtained from filtered profiles using two different cut-off lengths during the ISO 13565-1 standard filtration ... 84 Figure 6-12: Mean and median of 𝑅𝑡 and 𝑅𝑘 roughness parameters for both milling type and
different tool wear with the deviation of ±2 standard deviation on the mean ... 85 Figure 6-13: Plateau roughness profiles after removing the deep valleys and applying a second
filtering ... 87 Figure 6-14: Mean and median of 𝑃𝑅𝑎 and 𝑃𝑅𝑘 roughness parameters for both milling type and
different tool wear with the deviation of ±2 standard deviation on the mean ... 88 Figure A-1: Box counting example for a five circle inversion fractal ... 108 Figure A-2: Stack material specifications ... 111 Figure A-3: Experimental set-up of the fixture of the workpiece, mounted over the Kistler force
measurement table and a junction part ... 112 Figure A-4: Top view of the holding table and frame of the stack ... 112 Figure A-5: Depths for the measurements of hole diameter and circularity (the references are at the
top of each layer in the stack)... 115 Figure A-6: Titanium burr height ratio versus the tool wear VBBmax ... 116
Figure A-7: Titanium burr height ratio versus the thrust force under same cutting parameters corresponding to the central point of the variation parameters for titanium ... 117 Figure A-8: Titanium burr height ratio versus the torque under same cutting parameters corresponding to the central point of the variation parameters for titanium ... 117
Figure A-9: Aluminium burr height ratio versus the tool wear VBBmax ... 119
Figure A-10: Aluminium burr height ratio versus the thrust force under same cutting parameters corresponding to the central point of the variation parameters for titanium ... 119 Figure A-11: Measured thrust force signals for sharp and worn tools during CFRP machining 120 Figure A-12: Measured thrust force signals for sharp and worn tools over a period during CFRP
drilling (magnification of the frames from Figure A-11) ... 121 Figure A-13: Graphs ln la (length of the convolution product estimated for the size 𝑎) versus ln a
computed from the thrust force signals obtained during the CFRP machining using one tool after drilling the holes 1, 17, 34, 55, 82 and 115 ... 122 Figure A-14: Graphs ln la (length of the convolution product estimated for the size 𝒂) versus ln a
from the thrust force signals obtained from the CFRP machining using one tool after drilling the holes 1, 17, 34, 55, 82 and 115 (magnification of the area between the vertical lines from Figure A-13) ... 123 Figure A-15: Measured thrust force signals for sharp and worn tools over a period during titanium
machining ... 123 Figure A-16: Relative standard deviations of fractal dimensions 𝐷𝑅, calculated for different
sampling lengths ... 124 Figure A-17: Fractal dimension DR versus the number of hole drilled for 100% CFRP cutting speed
and feed levels (LS 1-3: Fractal dimension DR estimated with least square method for tools
1-3, Min: minimum limit of Fractal dimension DR, Max: maximum limit of Fractal dimension
DR) ... 125
Figure A-18: Fractal dimensions DR using least square (LS) method versus the tool wear VBBmax
... 125
Figure A-19: Fractal dimensions DR using least square (LS) method versus titanium burr height
ratio... 126 Figure A-20: Fractal dimensions DR using least square (LS) method versus aluminium burr height
ratio... 126 Figure B-1: Experimental setup representation ... 132
Figure B-2: Filtered cutting forces (top), total cutting force (center) and filtered and root mean square (RMS) acoustic emission (AE – bottom) signals... 133 Figure B-3: Zoom samples, from the analyzed section presented in Fig. 2, of the total cutting force
(𝐹𝑇) signals – up – and of the acoustic emission (AE) signals – down – over two tool rotation periods for different holes ... 134 Figure B-4: Graph of curve samples for the fractal dimension determination using the rectangular kernel of total cutting force and acoustic emission signals ... 136 Figure B-5: Results of the fractal dimension D, the topothesy G and the 𝑅2 from the analysis of 𝐹
𝑇 and AE signals vs the number of holes drilled ... 137 Figure B-6: Fractal index, 𝐼𝐹, results and the tool wear in function of the number of holes drilled ... 138 Figure C-1: Measurement positions on trimmed surfaces in the transverse direction ... 142 Figure C-2: Measurement positions diagram on hole surfaces ... 143 Figure C-3: Primary profiles of up- and down-milling trimmed surfaces for three different tool
wear ... 144 Figure C-4: Ra average results with ±2 standard deviations obtained on up- and down-milling faces ... 145 Figure C-5: Roughness parameters Ra along the hole orientation for a sharp tool ... 146 Figure C-6: Roughness parameters Ra for medium (left) and high (right) tool wear ... 147 Figure C-7: Profile samples for different tool wear at several hole angular positions (colored section
LIST OF SYMBOLS AND ABBREVIATIONS
CFRP Carbon fiber reinforced plasticsCVD Chemical vapor deposition FRP Fiber reinforced plastics
PCBN Polycrystalline cubic boron nitride PCD Polycrystalline diamond
PVD Physical vapor deposition RMS Root mean square
LIST OF APPENDICES
APPENDIX A – ARTICLE 4: BURR HEIGHT MONITORING WHILE DRILLING CFRP/TITANIUM/ALUMINIUM STACKS ... 106 APPENDIX B – ARTICLE 5: FRACTAL ANALYSIS OF CUTTING FORCE AND ACOUSTIC
EMISSION SIGNALS DURING CFRP MACHINING ... 130 APPENDIX C – ARTICLE 6: SURFACE PROFILE TOPOGRAPHY OF TRIMMED AND
PREAMBLE
The research presented herein started following my internship at Bombardier Aerospace in Montreal, within the framework of the CRIAQ project MANU-413. At this time, my research was focused on the optimization of the drilling process of multimaterials’ stack composed of carbon epoxy composite and, titanium and aluminum alloys. To evaluate this process, different criteria were used, such as cutting forces average and amplitude, accelerometer signal root mean square, surface quality, burrs and hole sizing.
Firstly, while analyzing the cutting force signals to extract data such as mean and amplitude, I noticed that the averaging the signal caused a considerable amount of information lost, especially for the cutting forces acquired while drilling CFRP (carbon fiber reinforced plastic). For example, the shape patterns from the cutting force signal were evolving along the increase of the tool wear. This observation was particularly clear when the signal was observed for only few tool rotation periods. At high magnification range, it was noticed that the ‘ruggedness’ of the signals acquired from machining with different tool wear was changing as well. Literature review allowed to find an innovative technique to quantify the shape evolution and signal roughness: the fractal analysis. Thus, it was successfully used to estimate the burr heights from the cutting force signals acquired during the drilling of CFRP within the stack (Appendix A).
Secondly, while analyzing the hole quality of the CFRP layer, the surface texture profile was measured and roughness parameters calculated. The roughness parameters deviation found at this time was too high to be relevant at this point. I decided then to investigate further and propose new methods to evaluate the surface condition of laminated composites through their roughness profile.
CHAPTER 1
INTRODUCTION
Aircrafts’ structure design is mainly driven by weight reduction and safety. The latter is a particularly obvious airworthiness requirement. The former, weight reduction, is motivated by regulation compliance (in terms of e.g. noise reduction and gas emission) and by the competitive aerospace market (for instance aircraft range, gas consumption and noise level).
To reduce the weight of an aircraft, while maintaining or even improving mechanical properties of the parts, the aerospace industry uses new materials for their airplanes structure. In addition to metallic materials, such as aluminum or titanium alloys, traditionally being used in the last four decades, aircraft designers are increasingly selecting new types of materials, such as lithium aluminum alloy and composite materials. In composite materials, the most used are ply-laminated composites of carbon fiber and epoxy resin matrix. After manufacturing those composite parts, machining operations are required, either, drilling and riveting for assembly purposes, or trimming to finish the workpiece edges. Those machining operations need to be closely evaluated to maintain sufficient quality and to remain within the requirements.
The evaluation of machining processes can be assessed, among others, through the cutting force signals and/or vibrations generated during the operation. It can also be performed by investigating the integrity of the machined surface. Because of the heterogeneous nature of the carbon fiber reinforced plastics (CFRP), the quality of surface condition is poorly characterized using traditional roughness parameters.
Carbon Fiber Reinforced Plastics (CFRP) have a heterogeneous structure made of carbon fibres and epoxy matrix resin. Due to CFRP physical characteristics, the cutting mechanisms are more complex compared to metallic materials and their consequences are not sufficiently known. Machining quality, which is required to assess the process reliability in the industry, is therefore more difficult to evaluate. That is why current methods of monitoring and surface condition estimation need to be re-evaluated to this heterogeneous material.
1.1 Problem description
The unidirectional fiber composite cutting process has been investigated in numerous studies over the last thirty years focusing on different aspects, such as the chip formation, the machining quality,
the surface condition and the cutting force prediction. When the surface roughness was evaluated, the traditional roughness parameter Ra was very often the only parameter used. Variations of the
Ra parameter were studied multiple times, either in accordance with the feed or the cutting speed
or even to different tooling types. However, reducing a surface characterization to a single value may be a subject to criticism. Such reduction is adequate in certain cases allowing to properly evaluate a surface roughness thanks to a single value. Indeed, surface profile parameters have been heavily used for homogeneous materials, such as metals. However, researchers note that the use of the Ra parameter is inadequate to composite materials due to their heterogeneity (Landon, Y. & Cherif, M., 2013). Depending on the orientation of the ply or direction of the roughness profile, this profile has various shapes (Chatelain, Zaghbani, & Monier, 2012).
In addition to surface characterization problems, determining appropriate cutting parameters can be challenging depending on the machining process and the requirements. Monitoring composite machining operations can turn machinists puzzled. The tool wear evolution follows the same trends as the one for metals. However, a worn tool, which could be acceptable for metals’ machining, can generate e.g. delamination and resin damage. Different wear indicators could be proposed based, for instance, on vibrations and cutting force signals.
The tool wear indicators would greatly help in the FRP machining monitoring to avoid scrapped parts. Nowadays, ensuring a sufficient machining quality is difficult on a production line. For instance, a matrix thermal damage is practically impossible to detect without using a scanning electron microscope. Nevertheless, an appropriate model could predict the tool wear and the surface quality based on the analysis of the cutting forces signals and vibrations generated during the composite machining.
1.2 Objectives
The main objective of this thesis is to characterize and estimate the surface condition of trimmed CFRP samples.
The secondary objectives are defined as follows:
1. Understand characterization problems using traditional techniques of profile measurements for laminate composite surfaces.
2. Propose a new filtering process to obtain roughness profiles from surface measurements on laminate composite.
3. Propose new parameter(s) allowing a proper characterization of machined composite materials’ surfaces.
4. Develop tool wear and surface condition estimating method based on the analysis of cutting force signals during the CFRP machining.
CHAPTER 2
LITERATURE REVIEW
In this chapter, a state of the art is shortly presented, focusing on the trimming of carbon fibre reinforced plastics (CFRPs). However, the following literature review is only a familiarization and vulgarization of terms and concepts that are to be heavily discussed in the next chapters in order to avoid repetitive content. In each chapter or appendix containing an article, a separate state of the art oriented to the topic is presented.
Complementary subjects are highlighted in this literature review such as cutting force while CFRP machining, tool wear mechanisms, tool wear, surface integrity and roughness. Fractal analysis is mentioned in the machining framework as well. This technique, which has strong capabilities, is now unfortunately underused in manufacturing.
2.1 Fibre reinforced plastics (FRP)
2.1.1 Generalities
Composite properties are characterized by both of the materials used: matrix and reinforcement. In addition to the constitutive materials, the interface plays a major role in the composite constitution. The reinforcement-matrix interface allows to maintain the composite structure and it permits the mechanical load transfer between both constituents.
In this study, unidirectional fibre composites with a plastic matrix are considered. Their fibrous structure is important. It allows the designer to increase composite mechanical properties in selected directions. The lay-up composite type is called laminate. Such laminate is manufactured by stacking unidirectional pre-impregnated fibre plies in different orientations (Figure 2-1).
2.1.2 Carbon fibre reinforced plastics (CFRP)
The FRP chosen in this study is the Carbon FRP (CFRP). The laminated CFRP used was prepared using pre-impregnated plies. The CFRP was manufactured using manual lay-up and then cured in autoclave.
Figure 2-1: Lay-up laminate (Campbell, 2010) 2.1.2.1 Fibre
Fibres are used as reinforcement in the composite – they support the mechanical loads. The carbon fibre is known to have a high tensile and compressive strength and low density (Table 2.1). Carbon fibres are placed by threads of several thousand fibres, in a ply. Herein, fibres are all oriented in one direction per ply and impregnated with resin.
Table 2.1: Carbon fibre general characteristics (Berthelot, 2012)
Carbone HR Carbone HM Carbone THM
Volume mass ρ (g/cm3) 1.75 1.81 1.95
Diameter (µm) 5 – 7
Young modulus Ef (MPa) 230 400 600
Specific modulus Ef/ρ (MNm/kg) 130 210 310
Fracture stress (MPa) 3000 – 4000 2800 2000
Specific fracture stress σfu/ρ (kNm/kg) 1710 – 2290 1550 1000 – 1200
2.1.2.2 Resin
Two types of matrix can be used: thermoset and thermoplastic. For CFRP, the matrix is a thermoset resin which is the epoxy resin in this study. Contrary to thermoplastics, this resin can be irreversible when thermally damaged beyond relatively low temperature (Bonnet, 2010; Lasri, 2009). Epoxy resin is known to have good fatigue resistance (Table 2.2). It allows keeping the fibres attached to one part and transferring the mechanical loads to the fibres.
Table 2.2: Mechanical characteristics of epoxy resin (Berthelot, 2012)
Density (g/cm3) 1.1 – 1.5
Tensile elastic modulus (GPa) 3 – 5
Tensile yield stress (MPa) 60 – 80
Bending yield stress (MPa) 100 – 150
Elongation upon break (%) 2 – 5
Shear strength (MPa) 30 – 50
Heat deflection temperature (°C) 290
2.1.3 Mechanical properties
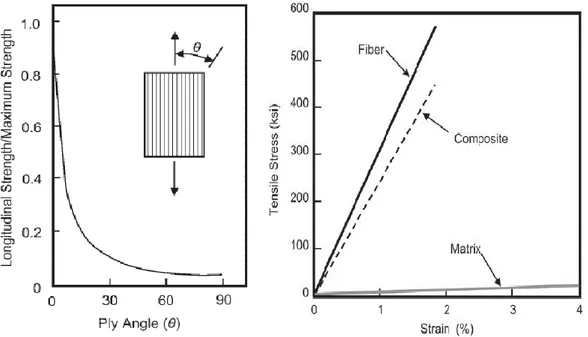
Main CFRP characteristics are high specific stiffness and strength, high fatigue and corrosion resistance, and light weight. Due to their laminated structure, CFRPs are anisotropic and their mechanical properties vary depending on the direction. For one unidirectional fibre ply, the elastic modulus is different depending on the angle between the fibre and the applied force (Figure 2-2). The 0° fibre ply orientation admits the highest longitudinal tension load. In this case, the axial mechanical loads are supported by the fibres and the matrix prevents fibre buckling in compression and allows load distribution among fibres in tension.
Figure 2-2: Longitudinal strength/ultimate strength ratio as function of ply angle (left); Tensile properties of fibers, matrix and composite material (right) (Campbell, 2010)
By stacking up plies in different fibre orientations, a laminate lay-up is obtained (Figure 2-1). The lay-up sequence is defined by the desired part thickness and mechanical properties.
2.2 Machining of FRPs
This study scope focuses on conventional machining by material removal. Non-conventional methods (laser, electric discharge, ultrasonic and waterjet machining) are left off in this study due to their shortcomings, such as production rate, affected zone and high price (Wang, D. H., 1993). Before presenting machining process of laminated composite materials, orthogonal cutting is shortly introduced.
2.2.1 Orthogonal cutting
2.2.1.1 Metal / homogeneous material
To understand issues of CFRP machining, machining of homogeneous material is presented. The base of material removal machining process can be reduced to orthogonal and oblique cutting (Figure 2-3). In orthogonal cutting, the cutting edge is perpendicular to the feed/tool direction. In the oblique cutting situation, the cutting edge is angled to the plan normal to feed direction in the machined surface plan.
Figure 2-3: Orthogonal and oblique cutting process geometries (Altintas, 2012)
The material removal is caused by the shearing of the material. Regarding machining unidirectional fibre laminated composite, the material removal can be caused by various elementary mechanisms. Figure 2-4 depicts fracture mechanics with different crack propagation modes.
Figure 2-4: Crack propagation modes (Hudson & Harrison, 1997)
Different cases of chip formation are overviewed in the next section depending on the tool direction vs the fibre.
2.2.1.2 FRP material
FRP material machining is in some ways similar to wood cutting in particular with the position of the tool vs the wooden fibre. In the fifties, Kivimaa and McKenzie proposed notations to position the tool edge in the reference frame of the wooden fibres (McKenzie, 1960) (Kivimaa, 1950). Those notations can be used as well in the FRP machining (Figure 2-5).
Figure 2-5: McKenzie angles definition (Bonnet, 2010)
First cutting mechanisms of unidirectional fibred composites were explored by Koplev et al. (Koplev, Lystrup, & Vorm, 1983), where material removal was studied for machining fibres at 0° and 90° (Figure 2-6).
Figure 2-6: Cutting mechanisms for CFRP composites machining in parallel and perpendicular directions (Koplev et al., 1983)
2.2.2 Chip formation
The work started by Koplev et al. was followed by the one from Wang et al. which showed different chip formation ranked in five types, during CFRP machining, depending on the fiber orientation and the cutting edge rake angle (Figure 2-7) (Wang, D. H., Ramulu, & Arola, 1995a).
Later, Arola et al. found the chip formation type was mainly due to relative position of the fibre orientation to the cutting edge feed direction (Arola et al., 1996).
In conventional cutting, two types of milling are possible: up- (opposite feed and tool rotational direction) and down- milling (same feed and tool rotational direction) (Figure 2-8). In the case of CFRPs, Bérubé et al. found up-milling generates a smoother surface and lower cutting forces during trimming (Bérubé, 2012).
Figure 2-8: Up- and down- milling (Sheikh-Ahmad, J. Y., 2009)
2.2.3 Tooling
The chip formation is different between FRPs and metallic material machining. During the CFRP machining we can observe very severe level of abrasive wear of the cutting edge in particular due to the carbon fibres hardness. In consequence, the tool edge needs a relatively high hardness and toughness to resist to the fibre abrasiveness and to the mechanical loads during the cutting.
The chip formation during FRP machining tends to be more compression shearing or fibre fracturing whereas the chip formation during metal cutting leads to plastic deformation. In consequence, the tool edge should be relatively sharp and with a positive rake angle. Due to the carbon characteristics, the cutting tool needs to be hard and tough enough to bear the carbon abrasiveness and the machining loads as well (Sheikh-Ahmad, J. Y., 2009). Different tool material can be selected for this type of machining, e.g.:
1- Cemented tungsten carbides; composed of hard carbide particles cemented between each other using a metallic binder.
2- Coated carbides; tool material of cemented carbide coated with hard ceramics, the coating can be applied using the chemical vapor deposition (CVD) or physical vapor deposition (PVD).
3- Ceramics; composed of sintered alumina at high pressure and temperature. Ceramic tools have a relatively low toughness and tend to chip under heavy and scattering loads. Producing ceramic tools with sharp edges is also a source of concern.
4- Polycrystalline diamond (PCD); characterized by good thermal conductivity, low friction and high tool life. Composed of polycrystalline diamond compacted using cobalt binder at high temperature and pressure.
5- Polycrystalline cubic boron nitride (PCBN).
6- Diamond coated carbides; obtained by applying a low-pressured synthetized diamond on a carbide substrate using chemical vapor deposition. The diamond coating greatly improves the tool life length in CFRP machining although after the diamond deposition is altered the tool wear drastically increases.
2.3 Machining quality
During machining, the cutting mechanisms of composite materials, in particular FRPs, are more complex compared to metallic materials. Phenomena, such as fibre pulling or matrix thermal damage, are part of machining problems and need to be assessed and controlled.
The tool wear is an important aspect in controlling a machining process. However, the tool wear is often used to assess the most important criteria in manufacturing: quality. The machining quality is identified by observing the surface integrity and the surface condition. In the CFRP case, the former can be affected with issues such as delamination and thermal damage. The latter may be evaluated through dimensional defects, surface roughness, waviness etc.
2.3.1 Surface integrity
2.3.1.1 Delamination 2.3.1.2 Delamination
A delamination is a failure mode causing the fiber debonding from the matrix. Delamination within a FRP composite can be either intra- (delamination of the fiber within a ply) or inter-delamination (fiber delamination between plies) (Gouleau, Garnier, & Furet, 2007; Persson, Eriksson, & Zackrisson, 1997).
Delamination can be ranked based on its characteristics (Colligan, 1991) (Figure 2-9): Type I: The surface areas where ply fibers are missing;
Type II: The uncut fibers overhung from the trimmed edge;
Type I/II: A combination of both Type I, and Type II delamination; Type III: The loose fibers partially attached to the trimmed surface edge.
Figure 2-9: Delamination types (Colligan, 1991)
To evaluate the delamination level, Davim et al. proposed a delamination factor Fd, shown in
Figure 2-10.
In drilling, delamination phenomena are more eager to appear at the inlet (e.g. fiber pull-up) and at the hole outlet (Persson et al., 1997). Delamination can be also observed to a lower extent in the composite core next to the hole (Gouleau et al., 2007).
Different techniques of non-destructive control (such as ultrasounds, infrared thermography, tomography) are used to evaluate the manufacturing and machining quality in regards with the delamination (ECSS, 2011). In addition to those techniques, a visual check can be conducted as well. Surface resin microbreakages might be pinpointed. Depending on the size and orientation of those resin microbreakages, the ultrasound inspection may be preferred.
Regarding delamination symptoms, Sheikh-Ahmad et al. found that delamination often occurs closed to the surface with I and I/II delamination types (Sheikh-Ahmad, J., Urban, & Cheraghi, 2012). To limit those defects, it was proposed to decrease the cutting feed and increase the speed as well.
Hintze et al. observed CFRP delamination during milling using PCDs tools and noticed a high relationship between delamination and, the tool sharpness and the fibre orientation (Hintze, Hartmann, & Schütte, 2011).
2.3.1.3 Heat damage
The other main damage is the thermal degradation of the matrix. The matrix thermal damage is characterized by the matrix vaporisation or melting next to the cutting zone. This degradation is caused by the friction between the tool cutting edges and the composite surfaces. The damage depth depends on the heat generated (Guegan, Lemaitre, & Hamann, 1992).
Two solutions can be applied to reduce the heat generated by the cutting (Bonnet, 2010):
- Selecting a better set of cutting parameters such as a cutting speed decrease and a feed increase.
- Redesigning the tool geometry by reducing the impact of the flute fillets (or increasing the clearance angle) on the composite surface.
2.3.2 Surface topography
The surface topography includes all the surface shape at different scales but focuses only on the surface texture. This surface topography can have large defects vs the predicted surface. It also
represents the surface waviness and roughness. The roughness and waviness of a surface characterize the primary surface.
The surface condition depends on the cutting condition such as tool geometry, cutting dynamics, workpiece material characteristics, fibre orientation and cutting parameters. During their life cycle, the reliability of machined parts partly relies on the surface condition and therefore needs to be looked at. The surface finish is also important for assembly purposes e.g. riveting.
2.3.2.1 Dimensional defects
Dimensional defects, such as the non-circularity of a hole, are mainly due to the composite anisotropy (Guegan et al., 1992; Piquet, Ferret, Lachaud, & Swider, 2000).
2.3.2.2 Waviness, roughness surfaces
To evaluate a surface condition, a visual check can be performed. However, measurements are often preferred to improve reproducibility rates. Measurements can be performed by acquiring topography point mesh height over a surface or on a profile line. Even if the surface measurements have usually narrower result deviation, they are more time consuming to conduct than surface profile measurements. In the industry, the surface profile characterization is preferred. The characterization is a parametrization of the profiles reducing a scattered profile into a single value (e.g. Ra – average deviation of the profile).
Regarding the process leading to waviness and roughness profiles, the raw profile obtained from the measurement leads to the primary profile by slope correction. This primary profile is composed of the waviness profile and the roughness profile which can be extracted by filtration.
On the machined coupons, there are also two preferable directions of observation (Sheikh-Ahmad, J. et al., 2012):
1- Longitudinal direction (in the ply plane); very often the object of inspection since it is also the feed direction in trimming.
2- Transversal direction (in the stacking sequence direction); more concerned for hole inspection.
The following chapters deeply investigate problems encountered by the scientific community and propose characterization tools based on current standards.
2.4 Surface roughness
In the scientific community and to a higher extent in the industry, the surface condition is mainly characterized using roughness profile parameters (Jawahir et al., 2011). Those roughness parameters were built for homogeneous materials such as metals. However, a study shows the Ra roughness parameter is highly influenced by fibre orientations while other parameters such Rt and
Rz allow to assess machining damages (Wern, Ramulu, & Colligan, 1993).
An experimental research involving orthogonal cutting of UD (unidirectional) composites shows roughness profiles with different fibre orientations (Wang, X. M. & Zhang, 2003). Figure 2-11 depicts variations of roughness profiles for different fibre orientations with different cutting angles and depth of cut. For a specific machining setup (tooling, machining angles and cutting parameters), the average value of roughness parameters can jump from one to seven times depending on the fibre orientation. The highest values were obtained for the 120°-fibre-orientation. This statement is confirmed in experimental trimming tests (Chatelain et al., 2012) (Figure 2-12, Figure 2-12 and Figure 2-13) and in experimental drilling tests as well (Landon, Y. & Cherif, M., 2013).
Figure 2-11: Fibre orientation effect on the profile surface roughness with different depth of cut (a) 0.001mm; (b) 0.050mm (Wang, X. M. & Zhang, 2003).
Figure 2-12 depicts different roughness profiles for the main orientations of 0°, +45°, 90° and -45° and for three sets of cutting parameters. Those roughness profiles were measured in the ply plane, so the longitudinal direction, allowing to observe one fibre orientation only. For each fibre orientation, a specific pattern can be observed whatever the cutting parameters are.
Figure 2-12: Comparison of roughness profiles for four orientations using three set of cutting parameters (Chatelain et al., 2012)
In Figure 2-13, different types of roughness profiles are displayed for each of the four main fibre orientations (0°, +45°, 90° and -45°). Each profile tends to have specific features depending on the fibre orientation.
Based on those observations, the current characterization of laminated composites in the ply plane direction should be reconsidered. Due to the high surface variations and patterns depending on the fibre orientation, the characterization in the transverse direction (in the stacking sequence direction) should be reassessed as well.
Nevertheless, the scientific community mainly uses current surface characterization tools (which were built for homogeneous materials) instead of challenging them in the perspective of heterogeneous and/or laminated materials. In such case, the modus operandi is also at stake. Performing a measurement on different plies successively could alter results in comparison with a single fibre orientation inspection.
Figure 2-13: Different types of roughness profiles (Chatelain et al., 2012)
Besides research studies which evaluates impacts of tool wear, tool coating or cutting parameters, a article relates the machining quality monitoring using acoustic emissions and cutting force signals during the CFRP drilling (Arul, Vijayaraghavan, & Malhotra, 2007). However, the inspection of the hole surfaces is limited to hole diameter and uncut fibres at the hole outlet.
A thesis, focused on the CFRP/Aluminium stack drilling, evaluated the machining quality using neural network (Roudgé, 2011). In this study, several factors were taken into account, such as cutting forces, tool wear, hole dimensioning (diameter, circularity and cylindricity).
2.5 Fractal objects
Fractal generation and analysis are already used in multiple domains such as economy, weather forecast, medicine, engineering and graphics simulation. Fractal concepts and analysis are discussed at large in this chapter. The motivation of the fractal analysis used in therein and further details are to be heavily reviewed in the following chapters.
2.5.1 Concept and generalities
Fractal analysis was brought to light by Mandelbrot (Mandelbrot, B., 1975). The fractal principle stands in the fact that the area of a table is not necessarily a defined figure but can change depending on the scale of observation. The area of a table can be relatively easily calculated at a human scale (e.g. 1m x 1.5m = 1.5m2). However, if you zoom in a section of a table, the surface area increases as well. It even tends to an unlimited area with the continuous magnification increase. Fractal theory brings an answer to this problem by observing the scale dependency on the area (Mandelbrot, B. B., 1982).
A fractal can be described as a geometrical set with an auto-similarity characteristic, which can be observed as a ‘small’ part of the set representing the set itself (Robert, 2001; Russ, 1994). For instance, the Koch flake is one the most famous fractal object (Figure 2-14) (Davim, J., Barman, & Sahoo, 2011).
The different iterative steps to build the Koch curve are as follow: - Step 0: a L-length line is chosen;
- Step 1: the central part of the third of the line is removed and replaced by the two other lines of the equilateral triangle (using this removed segment as base for the triangle); - Step 2: the same operation is repeated on each of the four L/3-length segments at a lower
scale;
- Step3 and so on: same iterative operation at each step.
The length of such object is indeed infinite and yet can be easily described by a single parameter: the fractal dimension. In this case, the Koch curve has a fractal dimension D that can be expressed by:
𝐷 = lim 𝑛→∞
ln(𝑛)
ln(ℎ) (2.1)
Where h is the homothetic scale factor (1/3 in this case) and n is the number of sticks at the first step (4 in this case) (Sapoval, 1997). Herein, this fractal dimension D (also called homothetic fractal dimension) has a value close to 1.26.
Figure 2-14: Koch curve iterations (Davim, J. et al., 2011)
The fractal dimension can admit non-integer values. For instance, an object contained in a two-dimension coordinate space can have a fractal two-dimension from 1 up to 2. The fractal two-dimension is considered as an index characterizing the level of complexity of a set.
Fractal objects can be drawn using this fractal dimension calculated e.g. from the equations of Weiertrass-Mandelbrot. Numerous fractal analysis techniques exist (three of them are presented and evaluated in Chapter 4) and the most known method is presented in the next section.
2.5.2 Fractal analysis techniques
Last section showed how to build fractal objects using a fractal dimension (Sapoval, 1997). However, fractal analysis evaluates the fractal dimension of a given object. The first and one of the
most known example of fractal analysis (stick-counting) is the measurement of the British coastline length (Figure 2-15).
The British coastline is approximated using sticks with different lengths. For each stick size, sticks can be easily counted. The fractal dimension is then assessed as the slope of the log-log graph with the stick size for the X-axis and the stick count in the Y-axis.
Figure 2-15: Fractal analysis evaluating the British coastline length using different stick lengths (Andrus, 2005)
In Chapter 4, three fractal analyses are presented and evaluated from experimental cutting force signals. In Appendix A and Appendix B, the regularization analysis (another type of fractal analysis) is used to monitor the tool wear.
CHAPTER 3
GENERAL PRESENTATION
Previously, the introduction and the literature review were presenting the subject framework and previous research up to date. This chapter shows the general structure of the thesis with the introduction of the articles and objectives. The next three chapters, which compose the dissertation core, are three journal articles. Another three journal papers in appendix round off the study. The organization of the papers incorporated in this thesis is shown in Figure 3-1.
The fourth chapter is the paper “Tool wear and surface quality assessment of CFRP trimming using fractal analyses of the cutting force signals” which was accepted by peer reviewers for publication in CIRP Journal of Manufacturing Science and Technology. The research work presented therein is focused on the analysis and discussion of the cutting forces during the CFRP trimming. Aside traditional techniques, three types of fractal analysis were described and applied on the cutting forces signals. The use of fractal analysis was motivated by the different ‘noise’ levels identified along the tool life in the cutting force signals, which noise is difficult to evaluate using traditional methods. The results shown promising future developments in tool condition and machining quality online monitoring during CFRP trimming.
The fifth chapter is constituted of the article “A new approach for the surface roughness profile characterization of laminated composites in the ply plane direction” which was submitted to peer reviewers for publication in Canadian Aeronautics and Space Journal. In this research article, new roughness parameters are proposed based on the fractal analysis method. The surface of CFRP composite, which is composed of laminated unidirectional plies, admits relatively high variations and patterns depending on the direction of profile observation. Surface profile observations show possible correlation between the machining quality and the roughness profile ‘noise’ in the ply plane direction, regardless to the ply orientation. Experimental results of the newly introduced fractal analysis based roughness parameters are found better estimate than current roughness parameters.
The sixth chapter exhibits the journal article “Surface profile texture characterization of trimmed laminated composite in the stacking sequence direction” which was accepted by peer reviewers for publication in the journal Measurement. In the perpendicular direction to the CFRP ply plane, so in the transverse direction, different problems occur. For instance, during hole inspections, depending on the angular position of the measurement, roughness parameter results can widely
vary and are improper to evaluate the machining quality. In this research article, a new filtering method is proposed to reduce the problem. To evaluate this new technique, numerous measurement were performed on CFRP trimmed coupons in the transverse direction and roughness parameters from the current and the new proposed filtering methods are presented. The introduced filtering method allows reducing by up to half the roughness parameter dispersion.
The Appendix A presents the journal paper “Burr height monitoring while drilling CFRP/Titanium/Aluminium stacks” which was accepted by peer reviewers for publication in
Mechanics and Industry. The research work presented therein was the first application of fractal
analysis on CFRP drilling cutting force signals in order to evaluate the tool wear and the burr generated at the outlet of titanium and aluminium layers in a multimaterial stack. At this point the results were promising.
Another article “Fractal analysis of cutting force and acoustic emission signals during CFRP machining” is shown in the Appendix B. This article was presented during the conference High
Performance Machining (Chemnitz, Germany) in 2016 and published in the peer reviewed Procedia CIRP journal. The fractal analysis was applied on both cutting force signals and acoustic
emission signals during the orbital drilling of the multimaterial stack of CFRP/titanium. The results show great potential and is currently under investigation for further development.
The Appendix C presents the paper “Surface profile topography of trimmed and drilled carbon/epoxy composite” which was presented during the Conference on Surface Integrity (Charlotte, North Carolina, U.S.A.) in 2016 and published in the peer reviewed Procedia CIRP journal. The research presented therein states the different problems of surface profile characterization. The surfaces at stake were from drilled holes and straight trimmed coupons. The thesis ends with a general discussion of the articles, followed by the general conclusion and recommendations. This allows to sum up the original contributions of the research herein and propose orientations for future work.
CHAPTER 4
ARTICLE 1: TOOL WEAR AND SURFACE QUALITY
ASSESSMENT OF CFRP TRIMMING USING FRACTAL ANALYSES
OF THE CUTTING FORCE SIGNALS
Xavier Rimpaulta, Jean-François Chatelainb, Jolanta E. Klemberg-Sapiehac, Marek Balazinskia aDepartment of Mechanical Engineering, Polytechnique Montréal, Canada
bDepartment of Mechanical Engineering, École de Technologie Supérieure, Canada cDepartment of Engineering Physics, Polytechnique Montréal, Canada
* Published in CIRP Journal of Manufacturing Science and Technology, vol.16, pp.72-80, 2017.
4.1 Abstract
The surface quality of machined carbon fibre reinforced plastics (CFRP) differs depending on cutting conditions e.g. cutting parameters and tool wear. Fractal analyses were performed on the cutting force signals, acquired during the trimming of CFRP, to describe the signal complexities variations. Fractal parameters, such as dimension and topothesy, were used to describe the signal irregularity and complexity. Statistical parameters, e.g. average and amplitude, and fractal parameters were compared related to the tool wear and to the surface quality. The fractal results from cutting force signals can estimate the tool wear and the surface quality.
Keywords: Fibre reinforced plastic, trimming, cutting force signal, fractal analysis, tool wear.
4.2 Introduction
4.2.1 CFRP
Thanks to their high strength-to-weight ratios, carbon fibre reinforced plastics (CFRP) have been more and more used in the aerospace industry. However, the heterogeneity and anisotropy of those materials implies rethinking or developing new machining and metrology techniques commonly used for metal alloy parts.
As a result of the use of moulds to manufacture composite, CFRP components obtained are close to their final shape and does not need several finishing operations. However, some processes remain inevitable e.g. drilling and trimming. Several problems may occur during fibre reinforced
plastic (FRP) machining, such as inter-ply and intra-ply delamination, uncut fibres, pulled fibres and burnt resin [1-3]. Jahanmir et al. found that the thermal damage of the resin is caused by the high heat generated during the machining bound with the low heat conductivity of the resin matrix [4].
Due to the abrasiveness and hardness of the carbon fibres, abrasion is considered as the foremost wear mechanism [5, 6]. The coating and tool geometry can be optimized to increase the tool life. In the industry, diamond coating is the most commonly used coating to machine CFRP. To obtain a higher surface quality, the radius angle of the tool cutting edge can be reduced. However, this geometry change weakens the cutting edge and may induce a faster wear. Following the tool condition, the heat generated in the cutting zone becomes higher with the dullness of the tool. Hamedanianpour et al. found that, even if the tool wear is still considered as functional, the resin may be burnt during the CFRP machining leading to imply a lower surface quality [7].
4.2.2 Fractal analysis
Fractals were introduced by the mathematician Benoit Mandelbrot to describe the length of Britain coastline [8]. Nowadays, fractals are seen as an object which owns a self-affine pattern or singularity [9]. In metrology, fractal analyses have already been investigated and used to define the roughness of surfaces. However, only few research articles show interest to apply this analysis technique to machining such as for signal analysis of machining acoustic emissions. Bukkapatnam
et al. proposed analysis methods based on chaos theory and fractal analysis to extract information
from signals such as acoustics emissions, cutting force signals and accelerometers during the machining of steel in lathe [10, 11].
The cutting force acquired during trimming can be estimated for homogeneous materials such as aluminium and titanium alloys [12]. For laminate composites, the cutting force prediction is more complicated due to its composition. For example, the CFRP used in this study is made of two different components – carbon, which is very hard to cut, and epoxy resin, which has a high machinability index. Karpat et al. and Kalla et al. proposed mechanistic force models for milling laminated composites [13-15]. However, those models do not integrate the tool wear impact and the noise of the cutting force signals.
Kabaldin et al. and Fu et al. used fractal analysis techniques to characterize the noise in the signals of, respectively, accelerometer and acoustic emission sensors while machining steel [16, 17]. The results showed trends towards the tool wear in both studies with an increase of the vibration noise. Throughout the machining of the CFRP, the carbon fibres are fractured due to a charge of the tool on the fibre. The fracture of the carbon fibres during the CFRP machining generates an additional noise in the vibratory and cutting force signals in comparison with the machining of homogenous metallic material. This noise is usually not taken into account in the analysis of the cutting forces. However, this signal noise may give additional information about the machining such as the tool wear and the quality of the generated surface. For example, the cutting force signal noise diminishes with the increase of the tool wear.
4.3 Workpiece, machine, setup and tooling specifications
The machined composite was an autoclave-cured 24-ply CFRP laminate. This quasi-isotropic composite was produced using pre-impregnated plies oriented in the stacking sequence [90˚/-45˚/+45˚/0˚/+45˚/-45˚/+45˚/-45˚ /0˚/-45˚/+45˚/90˚]s. This resulted in a flat laminated composite part with a 4.44 mm thickness and a 64% fibre volume fraction.
The machining experiments were carried out using the K2X10 Huron® high-speed machining centre. This 3-axis computerised numerical control (CNC) machine allows a maximum spindle speed of 28 000 RPM at 30 kW. For health and safety purposes, a dust extraction system was mounted onto the machine.
The cutting tool used was an end mill router with six straight flutes. The geometrical characteristics of this cutter are listed in Table 4.1. This end-mill was a carbide tool coated using a diamond chemical vapour deposition.
Table 4.1: Tool geometrical characteristics
Rake angle Clearance angle Helix angle Diameter
8° 10° 10° 3/8”
Two setups were used for our experiments. One allowed to machine 100 mm test coupons in order to proceed to a full inspection of the trimmed surface e.g. roughness evaluation, machined surface quality, thermal damage. This first setup is depicted in Figure 4-1. The other setup allowed to trim longer cuts – 900 mm in length – in order to generate tool wear. No coupon was kept after
machining with this second configuration. In this operation, all the laminate part machined was transformed into “chips and dust”. The fixture of both setups was screwed to a dynamometer table (Figure 4-1).
Figure 4-1: Experimental setup used for short cuts machining (100 mm)
4.4 Methodology
4.4.1 Design of experiments
The machining tests were performed with the parameters listed in Table 4.2. The cutting parameters were selected according to the best operational cutting conditions for a similar tool and CFRP material in the literature [18]. Three tools were used herein, sharing the same characteristics, and one set of cutting parameters was assigned to each one (Table 4.2).
Table 4.2: Chosen cutting parameters for the machining experiments using three tools with the same characteristics
Test/Tool Feed (mm/min) Speed (m/min)
1 1524 400
2 2794 300