HAL Id: hal-00271583
https://hal.archives-ouvertes.fr/hal-00271583
Submitted on 18 Jun 2019
HAL is a multi-disciplinary open access
archive for the deposit and dissemination of
sci-entific research documents, whether they are
pub-lished or not. The documents may come from
teaching and research institutions in France or
abroad, or from public or private research centers.
L’archive ouverte pluridisciplinaire HAL, est
destinée au dépôt et à la diffusion de documents
scientifiques de niveau recherche, publiés ou non,
émanant des établissements d’enseignement et de
recherche français ou étrangers, des laboratoires
publics ou privés.
quasi 1-D Spin S = 1 System
P. Vonlanthen, K. B. Tanaka, Atsushi Goto, W. G. Clark, P. Millet, J. Y.
Henry, J. L. Gavilano, H. R. Ott, F. Mila, C. Berthier, et al.
To cite this version:
P. Vonlanthen, K. B. Tanaka, Atsushi Goto, W. G. Clark, P. Millet, et al.. High Magnetic Field NMR
Studies of LiVGe_2O_6, a quasi 1-D Spin S = 1 System. Physical Review B: Condensed Matter
and Materials Physics (1998-2015), American Physical Society, 2001, 65, pp.214413.
�10.1103/Phys-RevB.65.214413�. �hal-00271583�
arXiv:cond-mat/0112203v1 12 Dec 2001
P. Vonlanthen,1 K. B. Tanaka,1 Atsushi Goto,1, 2 W. G. Clark,1 P. Millet,3 J. Y. Henry,4 J. L. Gavilano,5
H. R. Ott,5 F. Mila,6 C. Berthier,7 M. Horvatic,7Yo Tokunaga,7 P. Kuhns,8 A. P. Reyes,8 and W. G. Moulton8
1Department of Physics and Astronomy, University of California at Los Angeles, Los Angeles, CA 90095-1547, U.S.A. 2National Institute for Materials Science, Tsukuba, Ibaraki 305-0003 JAPAN
3Centre d’Elaboration des Mat´eriaux et d’Etudes Structurales,
29 rue J. Marvig, 31055 Toulouse Cedex, France
4Centre d’Etudes Nucl´eaires, DRFMC/SPSMS/MDN, F-38054 Grenoble Cedex 9, France 5Laboratorium f¨ur Festk¨orperphysik, ETH-H¨onggerberg, CH-8093 Z¨urich, Switzerland 6Institut de Physique Th´eorique, Universit´e de Lausanne, 1015 Lausanne, Switzerland 7Grenoble High Magnetic Field Laboratory, BP 166, 38042 Grenoble Cedex 9, France
8National High Magnetic Field Laboratory, Tallahassee, Florida 32310
(Dated: October 25, 2018) We report7
Li pulsed NMR measurements in polycrystalline and single crystal samples of the quasi one-dimensional S = 1 antiferromagnet LiVGe2O6, whose AF transition temperature is TN≃ 24.5 K.
The field (B0) and temperature (T ) ranges covered were 9-44.5 T and 1.7-300 K respectively. The
measurements included NMR spectra, the spin-lattice relaxation rate (T−1
1 ), and the spin-phase
relaxation rate (T−1
2 ), often as a function of the orientation of the field relative to the crystal
axes. The spectra indicate an AF magnetic structure consistent with that obtained from neutron diffraction measurements, but with the moments aligned parallel to the c-axis. The spectra also provide the T -dependence of the AF order parameter and show that the transition is either second order or weakly first order. Both the spectra and the T−1
1 data show that B0 has at most a small
effect on the alignment of the AF moment. There is no spin-flop transition up to 44.5 T. These features indicate a very large magnetic anisotropy energy in LiVGe2O6 with orbital degrees of
freedom playing an important role. Below 8 K, T−1
1 varies substantially with the orientation of B0
in the plane perpendicular to the c-axis, suggesting a small energy gap for magnetic fluctuations that is very anisotropic.
PACS numbers: 75.30.Kz, 75.50.Ee, 76.60.-k
I. INTRODUCTION
Recently, a new quasi 1-D spin S = 1
sys-tem, LiVGe2O6, has been the object of intensive
experimental1,2,3 and theoretical investigations.4,5,6 It
has an antiferromagnetic phase transition at about 25 K and the expected Haldane gap is either absent or strongly suppressed. Quantum chemistry calculations4 indicate
that a second-order splitting ∆CF of the t2gorbitals may
play a dominant role in this system. Our new measure-ments indicate that ∆CF might be much smaller than
previously thought,1leading to a large uniaxial magnetic
anisotropy and orbital fluctuations.
It has been established by neutron diffraction mea-surements that the low temperature phase has a rather simple, long-range antiferromagnetic order.3 In this
pa-per, we report the results of a number of different NMR measurements on this material. We also address several important questions about the phase transition which re-mained open previously, including the order of the phase transition, the size and origin of the energy gap in the magnetic excitation spectrum below the N´eel tempera-ture, and the orientation of the magnetic moments in the antiferromagnetic phase. Many of the results re-ported here were obtained on powder samples. Some of the more recent measurements were made on single crystal samples.
The7Li NMR measurements we report include NMR
spectra, the spin-lattice relaxation rate T1−1, and the spin-spin relaxation rate T2−1, at magnetic fields B be-tween 9.0 and 44.5 T and temperatures T over the range 1.7 - 300 K. In spite of various attempts to observe the resonance signal of51V nuclei above the transition and
at the lowest temperatures in the AF-phase, only a tiny spurious signal could be detected in the polycrystalline sample and no signal at all was found in the single crystal samples. The 9.0 T measurements were made at UCLA, the measurements between 23 and 44.5 T were done at the NHMFL in Tallahassee, and measurements at 12 T were performed at the GHMFL in Grenoble. We have extended previous NMR measurements on a polycrys-talline powder sample2 to much lower temperatures as
well as to much higher magnetic fields. Furthermore, we present the first NMR measurements on LiVGe2O6single
crystals as a function of the polar and azimuthal angles, which give new insides on the low temperature behavior of this system, where orbital degrees of freedom seem to play an important role.
This paper is organized as follows. First, we describe the preparation of the samples and the measurement pro-cedures. Then, we present the experimental results and a partial interpretation of some of them. In the subse-quent discussion we address issues concerning the mag-netic structure, the phase transition, the relaxation rate and the influence of orbital degrees of freedom.
II. SAMPLES AND EXPERIMENTAL METHODS
The LiVGe2O6 powder sample was prepared as
de-scribed by Millet et al.1 The single crystal samples were
synthesized at the Centre d’Etudes Nucl´eaires in Greno-ble using a flux of GeO2:Li2B4O7 with the molar ratio
8:1. After reducing the V2O5 with H2 and using a slow
increase of the temperature up to 720 C, the compound LiVGe2O6was obtained with a thermal treatment of the
components up to 800 C under Ar with 2 % vol H2. Then,
a mixture of 70 %wt of the flux and 30 %wt of the com-pound was put in platinum crucible and heated for 1 day at 970 C. After that, it was slowly cooled at the rate of 2 C per hour to 780 C, after which the power to the furnace was switched off and allowed to cool to room tem-perature. Finally, the products were washed with boiling water. Pale green needles were obtained, the maximum size of which was approximately 1 mm × 0.10 mm × 0.050 mm. The typical dimensions of the samples used for our NMR measurements were 700 µm × 100 µm × 50 µm, which corresponds to a mass of about 15 µg and ∼ 3 · 1016 7Li spins. The small NMR coils used for most
of the single crystal work were a few turns of 25 µm diameter insulated copper wire wound tightly onto the sample.
LiVGe2O6crystallizes in the monoclinic system, space
group P 21/c.1 The chains of VO6 octahedra are
paral-lel to the c-direction and are connected to their neighbor chains only by two GeO4 tetrahedra. There is a very
small coupling perpendicular to the chains. The Vana-dium atoms are located in distorted oxygen octahedra and the three t2g orbitals are split into a low-lying
dou-blet (dxy, dyz) and a single orbital (dxz) at an energy ∆CF
above the doublet.
All of the NMR results reported here were performed on the7Li nuclei using standard spin-echo techniques
car-ried out with a spectrometer and probes built at UCLA. The NMR spectra were obtained by frequency-shifted and summed Fourier transform processing7 with fixed
applied magnetic fields between 9.0 and 44.5 Tesla. Ro-tation of the field alignment about one axis during the measurements was done by placing the sample and NMR coil on a goniometer platform whose orientation was con-trolled from the top of the probe. Further rotation about a second axis perpendicular to the goniometer rotation axis was carried out by changing the placement of the coil and sample on the goniometer platform when the probe was out of the cryostat. We estimate that the ab-solute accuracy of the corresponding angle settings was approximately ±10 deg and that the precision in chang-ing the angle with the goniometer was ±0.5 deg. Part of the uncertainty in the absolute angle was associated with the small size of the samples and part of it from thermal contraction in the goniometer control upon cooling from room temperature to low temperatures.
An unsuccessful attempt was made to observe the51V
NMR signal in a single crystal sample. A thorough search
was done by sweeping the resonance frequency in the absence of any external field at 4.2 K as well as sweeping B (aligned along the c-axis) between 0 and 14 T with T in the range 1.5 K-5 K at the fixed frequencies 200, 300 and 550 MHz. We attribute the lack of a signal, which otherwise should have been rather intense, to values of T1or T2that were less than the approximately 2 µs dead
time of the NMR spectrometer. It may be that extending such measurements to much lower T will reveal this51V
signal.
The 7Li T−1
1 measurements were performed by first
rotating the nuclear magnetization out of equilibrium by a short saturation chain of rf-pulses, then waiting a variable recovery time, t, and finally measuring the in-tegrated spin-echo intensity, m(t). As discussed below, the quadrupolar splitting of the NMR line is very small, about 15 kHz, so that a single exponential form is ex-pected for m(t) as long as all parts of the sample have the same value of T1−1. To monitor any deviation from the single exponential behavior, we used a stretched ex-ponential to fit our data:
m(t) = m∞+ (m0− m∞) exp(−t/T1)β, (1)
where m0 and m∞ are the nuclear magnetization at
t = 0 just after the saturation sequence and the equi-librium magnetization, respectively. The fit parame-ter T1 is the single time that characterizes the
recov-ery of the magnetization. It is the time for the quantity [m∞−m(t)]/[m∞−m0] to decay to 1/e. The exponent β
reflects the width of the distribution of relaxation rates. For β = 1, it corresponds to a single exponential and as β decreases from 1, it represents a progressively broader distribution. The T1−1 measurements were done at
Lar-mor frequencies between 149 and 762 MHz and applied magnetic fields between 9.0 and 41.5 T. For some of the measurements at high magnetic fields below 3 K only the beginning of the recovery curves were measured and the parameter m∞ was set using values from the
measure-ments between 10 and 3 K and the inverse temperature dependence of m∞.
Our T2−1measurements were done at 148.981 MHz in a
field of 9.0 T. The pulse sequence used was a π/2 prepa-ration pulse applied to m∞ followed a time τ later by a
second pulse whose angle was set to maximize the am-plitude of the echo. The integral of the spin echo signal was recorded as a function of τ . The decay of the signal was analyzed using the function:
m(2τ ) = m(0) exp −(2τ /T2)β, (2)
where β is the stretched exponential parameter between 1 (exponential decay) and 2 (gaussian decay). For the powder sample the β parameter was usually left free dur-ing the fit, and resulted in values around 1.4. The spin-echo amplitude for the single crystal measurements was modulated by the quadrupolar interaction, which caused strong deviations of m(2τ ) from an exponential decay. In this case, the value of β used in the analysis was fixed at 2.
III. EXPERIMENTAL RESULTS A. NMR spectra of polycrystalline LiVGe2O6
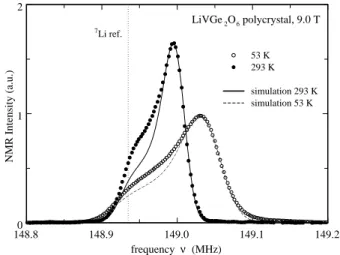
Figure 1 shows two NMR spectra of the powder sample in the paramagnetic regime, i.e. at T > TN≈ 25 K. The
experimental points are indicated by the symbols and the solid and dotted lines are fits to a model of a polycrys-talline powder in the presence of an axially symmetric, anisotropic shift,8 as discussed below.
148.8 148.9 149.0 149.1 149.2 frequency ν (MHz) 0 1 2 NMR Intensity (a.u.) 7Li ref. LiVGe2O6 polycrystal, 9.0 T 53 K 293 K simulation 293 K simulation 53 K FIG. 1: 7
Li NMR spectra in the paramagnetic phase of polycrystalline LiVGe2O6. The dotted line is the expected
position of7
Li in a reference compound like LiCl. The solid and dashed lines are simulations (see text).
For the simulation of the asymmetric NMR spectra in the paramagnetic regime we assumed each V ion to have a moment along the applied magnetic field, whose magnitude is independent of the orientation. Hence, the anisotropy of the g-factor was not taken into account. It was, however, verified that when 1 > g⊥/gk ≥ 0.5,
results similar to those for an isotropic g-factor are ob-tained. The corresponding magnetic field at the Li sites was then calculated by adding all the dipole contributions of the V ions in a sphere of about 5 nm diameter around the Li ion. It was verified that modifying the diameter of the sphere does not have any effects on the results. The hyperfine field at the Li sites cannot, however, be fully accounted for by assuming a purely dipolar field of the V moments. An additional isotropic hyperfine cou-pling of the order of 0.048 T/µB is needed. The latter
may arise in a manner similar to the superexchange in-teraction. By assuming a randomly distributed powder, i.e., the direction of the applied magnetic field is point-ing along all possible directions of the unit sphere, the Li spectra were then simulated at different temperatures. From the simulations of the measured spectra, one ob-tains for the average component < MZ> of the magnetic
moments along the direction of the applied field 0.048 µB
at 300 K and 0.080 µB at 53 K, respectively. Their ratio
is what one expects from the temperature dependence of the dc-susceptibility.2 The simulations, shown in Fig. 1
are based on only three parameters: i) an isotropic hy-perfine coupling, which is the same for all the data, ii) the size of the magnetic moment on the V ions, whose temperature dependence follows the dc-susceptibility and iii) a gaussian broadening function. In view of the small number of parameters the fits agree fairly well with the measured data. Some deviations are observed in the low frequency part of the signal; their origin is not yet un-derstood. 147 148 149 150 151 frequency ν (MHz) 7Li NMR Spectra 27.05 K 24.81 K 25.02 K 25.32 K LiVGe2O6 polycrystal 9.0 T 23.72 K 24.02 K 24.23 K 24.42 K 24.62 K 15.30 K 19.70 K 22.57 K FIG. 2: 7
Li NMR spectra of polycrystalline LiVGe2O6 at
9.0 T for T between 15 and 27 K.
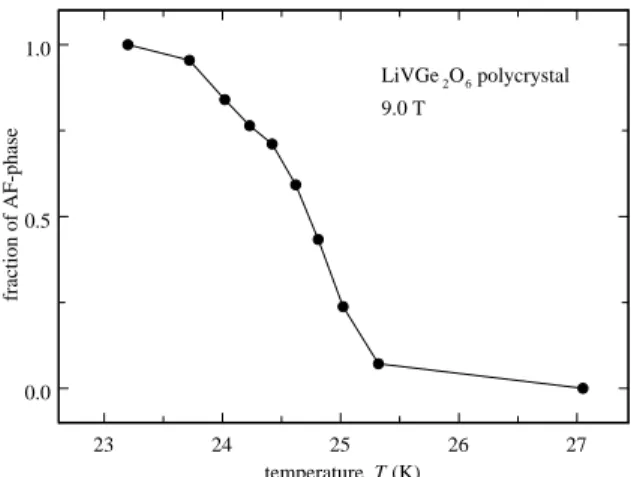
The 9.0 T NMR powder spectra near the transtion and in the ordered phase are shown in Fig. 2. They show a continuous transfer of spectral weight from a narrow line in the paramagnetic phase to a broad signal in the antiferromagnetic (AF) phase that occurs over a narrow temperature range. As seen in Fig. 3, which shows the fraction of the intensity in the AF phase, both phases coexist in a temperature range of about 1.5 K around 24.4 K.
The order parameter of the AF phase is the magnitude and polarization of the AF moments associated with the V atoms. They generate a corresponding magnetic field Bi at the i-th 7Li sites, which can be calculated for a
given AF moment configuration. Depending on the con-figuration of the AF state, Bi may have a sequence of
values at different7Li sites or be given by a single value
for all of them. At the high magnetic fields used in our experiments, the7Li spins probe the static order
parame-ter through the shift in their spectrum, which is given by the component of Bi that is parallel to the applied field
B0. For a randomly-oriented polycrystalline sample, the
NMR spectrum in the AF phase depends on the response of the AF polarization to the varying orientation of the external field.
23 24 25 26 27 temperature T (K) 0.0 0.5 1.0 fraction of AF-phase LiVGe2O6 polycrystal 9.0 T
FIG. 3: Fraction of the total NMR intensity in the polycrys-talline LiVGe2O6 spectra at 9.0 Tesla which is attributed to
the antiferromagnetic phase.
broad, nearly rectangular shape. This shape is expected for a randomly oriented powder spectrum if Bi has the
same magnitude at all7Li nuclei, is parallel or
antipar-allel to a single crystalline direction and maintains the same orientation with respect to the crystalline axes for all orientations of B0. For Bi ≪ B0, the field at the
nuclei is given by B0+ Bicos(θ), where θ is the polar
an-gle in spherical coordinates. Then, the frequency shift is: f = γBicos(θ). The probability (dN ) that a particular
value of θ occurs is: dN = 1/2 sin(θ)dθ and the density of states in the powder pattern is:
dN df = dN dθ dθ df = 1 2γBi , (3)
i.e., constant and results in a rectangular shape for the spectrum.
Since this shape is indeed observed, the powder spectra indicate that the direction of the internal magnetization is not affected by the orientation of the external magnetic field. From these measurements (see Fig. 2) we obtain the value Bi= 0.106 T.
In Fig. 4 the part of the NMR linewidth (∆ν(T )) pro-portional to the AF order parameter is plotted as a func-tion of temperature. The contribufunc-tion of the width in the paramagnetic phase is subtracted in quadrature from the AF contribution using
∆ν = (∆ν2
AF− ∆νP2)1/2 , (4)
where ∆νAFand ∆νP are the HWHM of the spectra in
the AF phase and in the paramagetic phase at 26 K, respectively. The solid line corresponds to a power law behavior ∆ν(T ) ∝ (TN− T )0.4±0.05. The onset of the
broadening of the spectra occurs at 25.04 K, which we identify as the N´eel temperature TN for the
polycrys-talline sample. 10 15 20 25 temperature T (K) 0.0 0.5 1.0 1.5 2.0 frequency shift ∆ ν (MHz) LiVGe2O6 polycrystal 9.0 T
FIG. 4: Frequency shift ∆ν from the NMR spectra of poly-crystalline LiVGe2O6. The width in the paramagnetic phase
at 26 K has been subtracted. The solid line is a fit to the data (see text).
B. NMR spectra of LiVGe2O6 single crystals
The coordinates shown in Fig. 5 will be used to discuss our measurements on the single crystal samples. They in-clude the crystalline axes a, b, and c, the cartesian axes x, y, and z, and the spherical coordinates θ (polar an-gle) and φ (azimuthal anan-gle). X-ray measurements9have
shown that the long dimension of LiVGe2O6single
crys-tals is along the crystallographic c-direction. For all of our single crystal NMR measurements, the value of φ is close to zero, unless specified otherwise.
b c a θ B φ x z y
FIG. 5: Definition of various coordinates for a typical LiVGe2O6 single crystal.
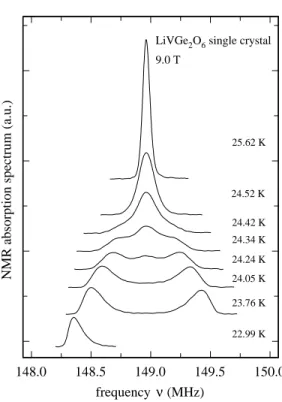
Figure 6 shows NMR spectra of a LiVGe2O6 single
crystal at temperatures between 23 and 26 K for θ ≈ 60◦.
phase and two lines in the AF phase that correspond to the two magnetically inequivalent 7Li sites. As for the
powder spectra, both phases coexist over a small range of T . However, this range is substantially narrower with a value ≃ 0.3 K for the single crystal.
148.0 148.5 149.0 149.5 150.0
frequency ν (MHz)
NMR absorption spectrum (a.u.)
25.62 K
22.99 K
LiVGe2O6 single crystal
9.0 T 24.52 K 23.76 K 24.05 K 24.24 K 24.34 K 24.42 K
FIG. 6: Single crystal7
Li NMR spectra of LiVGe2O6 near
TN. The needle direction, which corresponds to the
crystallo-graphic c-direction, is aligned 60◦from the applied magnetic
field.
As for the powder sample, the single crystal linewidths are rather broad near TN. Just above the transition,
∆ν(T ) is about 36 kHz compared to 19 kHz at 38 K. Since the dc-susceptibility increases with increasing T in this range, the opposite change in the linewidth may indicate that there are slow, short range fluctuations above the phase transition that enhance the linewidth somewhat. Furthermore, in the whole considered temperature range, the linewidths of the single crystal signals are consistent with the width of the broadening function used to fit the spectra of the polycrystalline sample. The large NMR line width seen just below TN may also be caused by a
distribution of TN in the sample.
In Fig. 7, ∆ν(T ), representing the splitting of the two peaks in the 7Li NMR spectrum, is plotted as function
of T for B0= 9.0, 41.5 and 44.5 T, with θ = 30◦at 9.0 T
and approximately 20◦for the measurements at 41.5 and
44.5 T. The data obtained at 41.5 and 44.5 T have also been multiplied by 1.15 and 1.28, respectively, to bring
0 5 10 15 20 25 temperature T (K) 0.0 0.5 1.0 1.5 frequency difference ∆ν (MHz)
LiVGe2O6 single crystal 9.0 T
41.5 T ( * 1.15) 44.5 T ( * 1.28) exponent: 0.3
FIG. 7: Frequency shift ∆ν of the7
Li peaks in the AF phase of LiVGe2O6 from the peak in the paramagnetic phase as a
function of T . For comparison, the measurements at 41.5 and 44.5 Tesla have been multiplied by the factors 1.15 and 1.28 respectively. The solid line is a fit to the data (see text).
the curves together. This indicates a somewhat reduced value of the order parameter for the measurements in higher fields, an aspect that will be discussed later. For the same reason, the values of T have been reduced by 0.6 K and 1.6 K for the measurements at 41.5 T and 44.5 T, respectively. We attribute these adjustments in T as being caused by differences in the instrumentation, which resulted in an uncertainty of about 1 K in TNfor
the measurements at these higher values of B0.
Because of the large values of B0, a substantial
reduc-tion of TN proportional to B20 is expected.10 However,
as can be seen in Fig. 7, no such reduction is observed. This seems rather surprising because gµBB/kB = 54 K,
for B = 44.5 T with g = 1.79, i.e., about twice TN. It may
be, however, that the value of g = 1.79, obtained from the paramagnetic susceptibility1is too large because, as will
be discussed later, the measurements of Lumsden et al.,3
as well as our own measurements, show that the value of the ordered moment is only about 1.14 µB. Furthermore,
it is evident that a large change in B0 has no significant
effect on the T dependence of the order parameter in the ordered phase, as the three curves coincide. The solid line is a power law fit to the data just below the transition with ∆ν(T ) ∝ (TN− T )0.3±0.05. The value of the
expo-nent is somewhat smaller than that 0.4 obtained for the polycrystalline sample. Qualitatively, such a reduction is consistent with the smaller distribution of TNinferred
from the smaller temperature range over which a coex-istance of two phases is indicated in the single crystal samples.
C. T−1
1 (T , B) for polycrystalline LiVGe2O6
In this section we describe our spin-lattice relaxation rate measurements at 9.0 and 23 Tesla performed on the polycrystalline sample. Below TNthe measurements were
done at the same frequency and magnetic field as above the transition. But because of the very broad linewidth of about 3.5 MHz in the AF-phase, only a small part of the NMR spectrum was covered by the RF-pulses. The nuclei near resonance were those with θ ≈ 90◦; i.e., B0
close to lying in the azimuthal plane. The angle φ is distributed randomly over 2π.
10-3 10-2 10-1 100 time t (s) 0.0 0.2 0.4 0.6 0.8 1.0
normalized echo integral
m β = 0.92 T = 28.8 K ν = 148.981 MHz H = 9.0 T LiVGe2O6 polycrystal 0 12 24 36 temperature T (K) 0.0 0.5 1.0 β 23.0 Tesla 9.0 Tesla
FIG. 8: Recovery of the magnetization during a T−1 1
mea-surement in polycrystalline LiVGe2O6. The solid line is the
fit of Eq. 1 for β = 0.92. Inset: Plot of β as function of T at 9.0 and 23 T.
Figure 8 shows a typical magnetization recovery curve (filled circles). The best fit using Eq. 1 (solid line), which yields β = 0.92, is an excellent fit to the data. The inset of Fig. 8 shows that the T -dependence of β is essentially the same at both 9.0 T and 23.0 T. Except for T close to TN, above 12 K the values obtained for β are close to
1 and correspond to a relatively narrow distribution of T1−1. Near the transition and below 12 K, β considerably deviates from 1, which indicates a substantially broader distribution of T1−1 at these temperatures. We attribute
the broadening of the distribution of T1−1 close to TNto
the distribution of TN for the different parts of the
sam-ple mentioned earlier. As discussed below for the single crystal measurements, the large deviation from β = 1 seen below 12 K reflects a large, unexpected dependence of T1−1 upon φ.
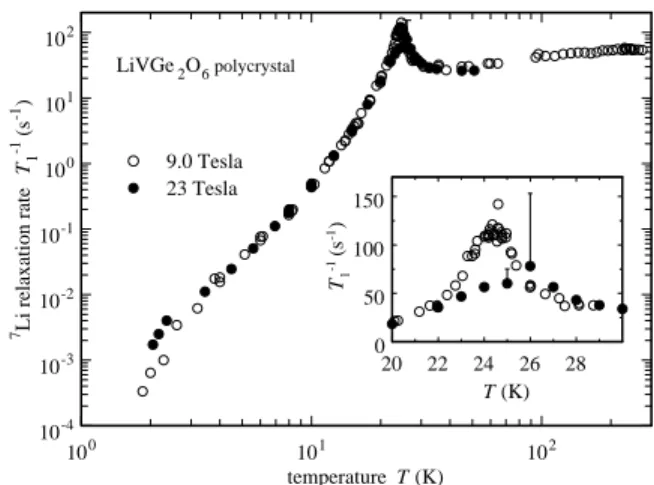
The T1−1 values obtained for 9.0 T and 23.0 T are
shown in Fig. 9. Where β is substantially less than 1, a wide distribution of values for T1−1 is present. There-fore, the plotted value is the one that represents the single recovery rate that characterizes this distribution. Never-theless, from its T -dependence useful information on the dynamics of our system can be obtained, even at the
low-100 101 102 temperature T (K) 10-4 10-3 10-2 10-1 100 101 102 7Li relaxation rate T1 -1 (s -1) 9.0 Tesla 23 Tesla LiVGe2O6 polycrystal 20 22 24 26 28 T (K) 0 50 100 150 T1 -1 (s -1) FIG. 9: 7 Li T−1
1 as function of T in polycrystalline LiVGe2O6
at 9.0 (open circles) and 23 Tesla (filled circles).
est values of T . For the 9.0 T measurements, well above TN, T1−1depends only weakly on T , slowly increasing by
about a factor 2 between 40 and 200 K and remaining almost constant between 200 and 300 K. Therefore, as previously reported1,2, there is no indication of a
Hal-dane gap in this quasi 1-D system. Below 40 K, T1−1
increases rapidly to a maximum value of about 140 s−1
at TN, presumably due to critical fluctuations near the
transition.
Below 23 K, T1−1drops very rapidly by about 6 decades
to a value near 3 · 10−4s−1at 1.8 K. In the low T regime,
the effect of B0 on T1−1(T ) is very weak. Because the
value of gµBB/kB for 23 T is close to TN this result was
unexpected, as was the small influence of B0on the
spec-tra shown in Sec. III B which are also affected only weakly by B0.
D. T−1
1 (T ) of a LiVGe2O6 single crystal
Figure 10 shows measurements of T1−1as a function of
T for a single crystal of LiVGe2O6 for θ = 90◦, 60◦, and
30◦, with φ ∼ 0◦. Over the whole temperature range,
no significant deviations from β = 1 were observed. This behavior indicates that unlike the polycrystalline sample, there is no distribution in T1−1; i.e., the relaxation follows a single exponential. In principle, this result should make a detailed interpretation of the results more straightfor-ward.
The general behavior of T1−1(T ) is similar to that of
the polycrystalline sample. From 200 K to 40 K the relaxation rate slightly decreases by about a factor of two, but subsequently increases by more than one order of magnitude towards TN, and decreases rapidly below
TN. The inset of Fig. 10 shows a log-log plot of T1−1
for θ ≈ 90◦ close to T
N as a function of |T − TN| with
100 101 102 temperature T (K) 10-2 10-1 100 101 102 7Li relaxation rate T1 -1 (s -1) 90 deg 60 deg 30 deg
LiVGe2O6 single crystal 9.0 T 10-1 100 101 |T-24.45| (K) 102 3 4 5 7 2 3 4 T1 -1 (s -1) 90 ; T > 24.45 K 90 ; T < 24.45 K FIG. 10: 7 Li T−1
1 as function of T in a single crystal of
LiVGe2O6. The three values of the polar angle θ are 90◦
(open circles), 60◦ (open triangles), and 30◦ (filled circles).
Inset: T−1
1 as function of |T − 24.45| above (open circles) and
below (filled circles) TN for θ ≈ 90◦.
below and above TN, fall on the same curve, given by
T1−1∝ |T − 24.45|−0.55. (5)
Although the exponent −0.55 is expected to reflect the critical behavior of the AF transition in this material, it should be interpreted with caution. Because the width of the transition shown by the coexistence of both phases (Fig. 6) over a range of 0.3 K may indicate a distribution of TNin the sample, it may be that the exponent is really
a lower limit on the rate of the divergence on approaching TN.
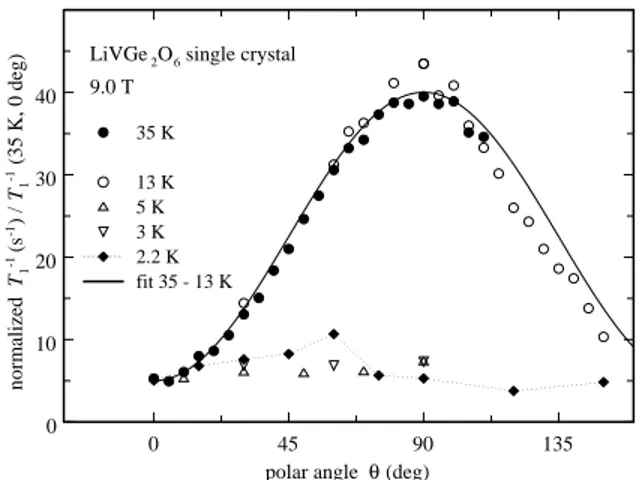
0 45 90 135
polar angle θ (deg) 0 10 20 30 40 normalized T1 -1 (s -1) / T1 -1 (35 K, 0 deg) 35 K 13 K 5 K 3 K 2.2 K fit 35 - 13 K
LiVGe2O6 single crystal 9.0 T
FIG. 11: Angular dependence of T−1
1 in a LiVGe2O6 single
crystal at five temperatures between 35 and 2.2 K. The solid line is a fit to the data at 35 and 13 K (see text).
Figure 10 also shows that the θ-dependence of T1−1(T )
on T has a crossover from θ being approximately inde-pendent of θ below 8 K to a strong dependence above 10 K. This behavior is shown in more detail in Fig. 11, where T1−1is plotted as function of θ for several values of T both above and below 10 K. Above 10 K, T1−1 is well
described by
T1−1(θ) = A(T )[35 sin2(θ) + 5] , (6)
where A determines the magnitude of T1−1. The
mea-surements at 5 and 3 K do not show any dependence on θ. At 2.2 K, the moderate θ-dependence of T1−1 is not well enough established to draw useful conclusions.
0.0 0.1 0.2 0.3 0.4 0.5 0.6 inverse temperature T -1 (K-1) 10-4 10-3 10-2 10-1 100 101 102 103 7Li relaxation rate 1/ T1 (s -1)
LiVGe2O6 single crystal
9 Τ; θ = 90 28.5 Τ; θ = 90; φ1 = −45 28.5 Τ; θ = 90; φ2 = 0 ∆ = 2.6 Κ ∆ = 14.7 Κ FIG. 12: 7 Li T−1
1 as function of 1/T in a LiVGe2O6 single
crystal at 28.5 T and the polar angle θ = 90◦ for two
az-imuthal angles φ1 = −45◦(filled circles) and φ2 = 0◦ (filled
squares) and at 9.0 T at θ = 90◦ (open circles). The solid
and dashed lines indicate energy gaps of 2.6 and 14.7 K re-spectively. The dotted line is a guide to the eye.
Now we turn to measurements in which φ was varied and θ is held fixed at 90◦; i.e., B
0 was rotated in the
azimuthal plane. For these measurements, the direction corresponding to φ = 0 is always the same, but the lo-cation of φ = 0 in the azimuthal plane is not known. Figure 12 shows T1−1 at θ = 90◦ as a function of 1/T for
φ1 = −45◦ and φ2 = 0◦ at 28.5 T and, for comparison
at 9.0 T and φ = 0◦. In addition the φ dependence of
T1−1for 4.5 and 1.7 K at θ = 90◦ and 28.5 T is shown in
Fig. 13. A huge change of two decades in T1−1 is seen for
a variation of only 30◦in φ.
These variations of T1−1 with θ and φ help to explain
the observation that β ≤ 1 throughout the entire range of T for the polycrystalline sample (Fig. 8). Below ∼ 8 K, the variation of T1−1as a function of φ causes a very broad
distribution of T1−1 in the polycrystalline sample that is qualitatively consistent with the established small values of β. Similarly, above TN, the narrower distribution of
T1−1 caused by its variation with θ (Fig. 10) results in
a value of β that is slightly less than one. In the range 10-20 K, the moderate range of θ near 90◦selected by the
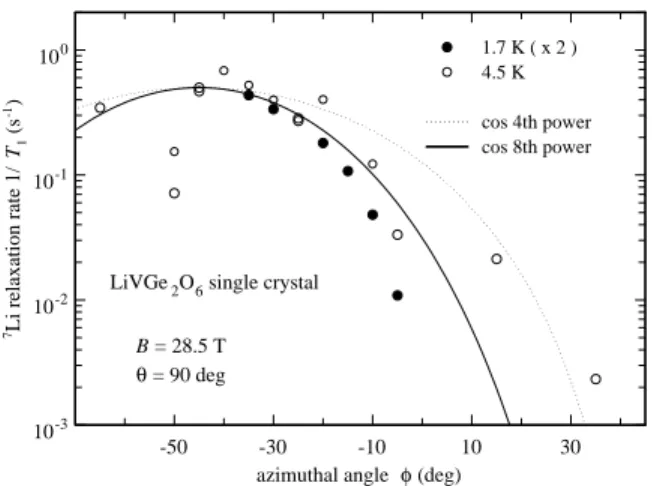
-50 -30 -10 10 30 azimuthal angle φ (deg)
10-3 10-2 10-1 100 7Li relaxation rate 1/ T1 (s -1)
LiVGe2O6 single crystal
1.7 K ( x 2 ) 4.5 K cos 4th power cos 8th power B = 28.5 T θ = 90 deg FIG. 13: 7 Li T−1
1 as function of φ in a LiVGe2O6 single
crystal at 28.5 T and θ = 90◦ for T = 4.5 K (open circles)
and T = 1.7 K (filled circles).
rf pulse at the center of the spectrum and the variation of TN in the sample are probably the major conditions
responsible for the measured value of β.
Our T1−1measurements at the highest B0of 41.5 T for
a limited number of angles and temperatures are shown in Fig. 14 and its inset. No significant deviation from the results at lower B0 is evident. This behavior shows
that although the dynamical properties of the electron moments that form the AF state are quite sensitive to the alignment of B0, they are nearly independent of its
magnitude up to 41.5 T. 0.05 0.10 0.15 0.20 inverse temperature T -1 (K-1) 10-2 10-1 100 101 7Li relaxation rate 1/ T1 (s -1)
LiVGe2O6 single crystal
41.5 Τ ; θ = 30; φ = 0 41.5 Τ ; θ = 70; φ = 0 0 20 40 60 angle θ (deg) 0.0 0.2 0.4 0.6 T1 -1 (s -1) T = 12 K B = 41.5 T φ = 0 FIG. 14: 7 Li T−1
1 as function of 1/T in a LiVGe2O6 single
crystal at 41.5 T for θ = 30◦(solid circles) and θ = 70◦(open
squares. Inset: θ-dependence of T−1
1 at 12 K and 41.5 T. E. T−1 2 (T ) of LiVGe2O6 0 100 200 300 τ(µs) 0.0 0.2 0.4 0.6 0.8 1.0
normalized echo integral
m
LiVGe2O6 single crystal 9.0 T, 36 K
θ = 0
0.00 0.02 0.04 frequency ν (MHz)
fft (a.u.)
FIG. 15: Spin-echo decay as a function of τ in a LiVGe2O6
single crystal at 9.0 Tesla. Inset: FFT of the spin-echo decay.
Figure 15 shows the oscillatory behavior of the ampli-tude of the spin-echo decay as a function of the pulse spacing τ at 9.0 T, 36 K, and θ = 0 in a single crystal sample. We attribute the modulation of the echo height to the static quadrupole interaction of the 7Li nuclei.
From the period of the modulation, τm, the quadrupole
frequency, νQ, is obtained:11νQ= 1/τm. Since the
orien-tation of the electric field gradient (EFG) tensor at these sites is not known, our limited measurements do not pro-vide an exact value of νQ. However, from the fourier
transform of the decay curve for a T2measurement with
one of the shortest periods (see inset Fig.15), an approxi-mate value of νQ≈ 15 kHz is obtained for the quadrupole
frequency. Actually, two frequencies νQand 2νQare seen,
as expected for a nuclear spin I = 3/2 system.11Also no change in the modulation was observed over the entire range of T that was covered. This behavior indicates that the EFG is constant and that no structural change occurs at TN, in agreement with neutron and x-ray diffraction
measurements.3
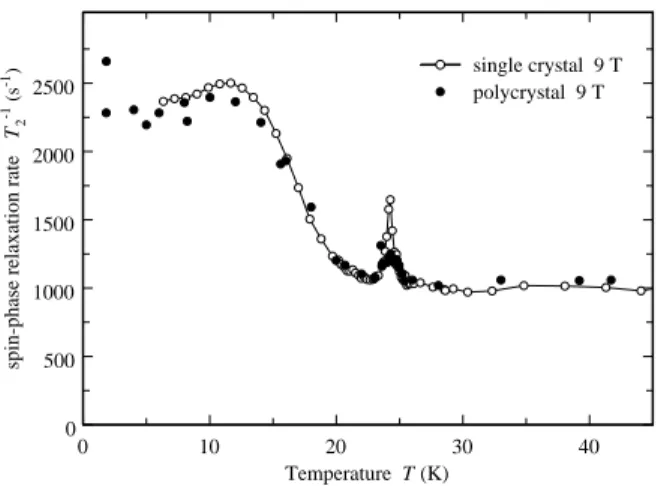
In Fig. 16, T−1
2 as function T is plotted at B0= 9.0 T
for both a polycrystalline powder sample and a sin-gle crystal sample. Several features are seen in these measurements. Except for very close to the transition, T2−1≃ 1000 s−1 above T
N. Also, there is a narrow peak
in T2−1 within 1 K of TN in which T2−1 is enhanced by
about 25 % for the powder sample and by 70 % for the single crystal one. We attribute these increases to slow, critical fluctuations, of the local field near TN.
As T decreases below 23 K, there is an increase in T2−1 by the factor 2.3. From elementary considerations, one might expect a reduction in T2−1 caused by the AF field
“detuning” the7Li spins. Although it should be present,
this mechanism is clearly not the dominant one for T2−1.
0 10 20 30 40 Temperature T (K) 0 500 1000 1500 2000 2500
spin-phase relaxation rate
T 2 -1 (s -1) single crystal 9 T polycrystal 9 T FIG. 16: 7 Li T−1 2 as function of T at 9.0 T in polycrystalline
LiVGe2O6(filled circles) and a LiVGe2O6single crystal (open
circles).
for such an increase in T2−1: (1) A slow fluctuation of
the local magnetic field or EFG in the frequency range near to T2−1, (2) an increase in T1−1to values on the or-der of or larger than T2−1 caused by other mechanisms, or (3) an enhancement of the spin-spin interactions be-tween the nuclei being measured. We expect that the first is not determining T2−1 because it seems unlikely
that slow fluctuations would be independent of T when the fast ones that determine T1−1vary so rapidly with T . The second obviously does not apply because all of the measured values of T1−1are too small. It may be that the
third mechanism does apply through the 7Li-7Li
spin-spin interaction being enhanced by the Suhl-Nakamura interaction mediated by the AF spin wave modes12that
are expected to form at low T . Although this approach shows some promise, to evaluate it in detail is beyond the scope of this paper.
IV. DISCUSSION
In this Section, we discuss and interpret features of our results that have not been covered in the above presen-tation of the data.
A. Magnetic structure
In this Section we discuss how the NMR spectra of both the powdered and the single crystal samples can be used to infer the spatial arrangement of the moments in the AF phase of LiVGe2O6. First, we consider what can
be inferred from the data in the randomly oriented poly-crystalline sample. Its NMR spectra in the AF phase can be analyzed in a similar way as in the paramagnetic phase (see Sec. III A); i.e. sum the contribution of all
the V3+ ions in a sphere of about 5nm around the 7Li
nuclei, but with the magnetic moments on the V3+ ions
having an AF configuration. We used the AF structure corresponding to a simple AF period along the chains, a ferromagnetic order between the chains and a value of 1.14 µB for the magnetic moments reported by
Lums-den et al.,3 but with several different orientations of the
magnetic moments. For the moments pointing along the (100) direction, a total field of only 0.022 T, which is much less than the measured value of about 0.106 Tesla (see Sec. III A), is obtained. However, when the moments are parallel to the (001) direction, the result is 0.104 T, which is very close to the measured value. Thus, the poly-crystal measurements are compatible with the proposed AF structure by Lumsden et al.3, but with the magnetic moments pointing along the crystallographic c-direction instead of the a-direction.
0 90 180 270 angle θ (deg) -2 -1 0 1 2 frequency shift ∆ν (MHz)
LiVGe2O6 single crystal
9 T ; 10 K Fit of 9 T data 23 T ; 20 K 23 T ; 10 K 41.5 T ; 11 K
ν (MHz) = 149.013 ± 1.864•cos(θ) + 0.015•cos(2θ) ± (-0.033)•cos(3θ) 0 10 20 30 40 B0 (T) 0 2 4 ∆νmax (MHz)
FIG. 17: Shift of the 7
Li NMR-absorption peaks in LiVGe2O6 as function of θ at 9.0, 23.0 and 41.5 T. The solid
lines are fits to the data at 9.0 Tesla (see text) and the dashed lines are guides to the eye. Inset: Frequency difference ∆ν between the two NMR lines in the AF phase, as function of B0 at T ≈ 10 K. The solid line is a guide to the eye.
The measurements on the single crystal samples pro-vide even more direct epro-vidence that the hyperfine fields at the Li sites, and therefore the moments on the V3+ions, are aligned parallel (and antiparallel) along the crystal-lographic c-direction. This can be seen from Fig. 17, where ∆ν for the two peaks in the7Li spectrum caused
by the magnetically inequivalent sites in the AF phase near 10 K is plotted as function of θ. For the measure-ments at 9.0 T, a good fit to ∆ν is given by:
∆ν = 149.01 ± 1.86 cos(θ) + 0.01 cos(2θ) ∓ 0.03 cos(3θ). (7) The dominant term in this fit is proportional to cos(θ), which is consistent with Bi being parallel to the c-axis
for all values of θ. Since Bi has this orientation for the
AF ordered moments parallel to the c-axis, we conclude that the moments themselves are aligned with the c-axis
in the AF phase.
For the measurements at 9.0 T, the deviations from the cosine function are quite small. The cos(2θ) dependence can be interpreted as a slight tipping of the moments by B0.13 The inset of Fig. 17 shows the maximum shift
∆νmax as a function of B0 at T ≈ 10 K. The few high
field measurements near 10 K indicate a small reduction of the order parameter. Because of the small number of measurements, this point needs confirmation by a more complete set of measurements.
B. Phase transition
As shown in Sec. III A, the NMR spectra of the poly-crystalline sample indicate the coexistence of the para-magnetic and AF phases over a range of 1.5 K, centered around TN. It has been suggested2 that a first order
transition is responsible for the coexistence of the two phases. On the other hand the T -dependence of the split-ting, which is proportional to the order parameter, varies continuously and smoothly to zero at the transition tem-perature. This behavior indicates that the phase tran-sition is of second order, or at most, very weakly first order. An alternative explanation for the coexistence of the two phases is a distribution of transition tempera-tures TN. Such a distribution, caused by dislocations,
stacking faults and V vacancies, could easily be present in a polycrystalline sample. This explanation is also con-sistent with the small value of the exponent β near the transition (inset of Fig. 8), which indicates a very broad distribution of T1−1 about TN, where T1−1 varies more
rapidly with T than at temperatures nearby. The vari-ation of T1−1 with T very close to the transition (inset, Fig. 9) is slower than expected given the divergent criti-cal behavior near a second order transition. As indicated earlier, this suppression of the critical divergence could be caused by a distribution of TN.
This interpretation in terms of a distribution of TN
is supported by our measurements on single crystals. In comparison with the polycrystalline sample, the data im-ply a coexistence of both phases over the substantially narrower range of about 0.3 K and a peak in T1−1 that
is narrower and higher near TN (inset, Fig. 10). This
behavior is qualitatively consistent with a distribution of TN in which the single crystal has fewer imperfections
and therefore a more narrow distribution of TNthan the
polycrystalline sample.
In Sec. IV A it was shown that the AF state of LiVGe2O6 has a rather simple magnetic structure. It
has, however, some unusual features which we turn to now. First, consider the magnitude of TN. We start with
a simple spin Hamiltonian which, as will be discussed later might not be sufficient to describe the system:
H = Jk X hi,ji Si· Sj+ D X j (Sjz)2+ J⊥ X (i,j) Si· Sj , (8)
where hi, ji denotes an intrachain nearest-neighbor pair
and (i, j) denotes an intrachain one. Jk and J⊥ are
re-spectively the the intrachain and interchain coupling con-stants, and D is the single-ion anisotropy. The value about 45 K has been estimated for Jk.1,2 Because of
the quasi 1-D character of the crystal structure, it is surprising that the measured value TN ∼ 25 K could
be more than half Jk. On the basis of a mean-field
calculation14and the assumptions J
k= 45 K, four
neigh-boring chains, and TN = 25 K, J⊥ has been estimated3
to be about 1.4 K, or [J⊥/Jk] ≃ 0.03. More advanced
calculations15,16,17 show, however, that such a ratio is
barely enough to induce an AF transition, and very un-likely to have a value of TN as large as Jk/2. In fact
based on the calculation of S´en´echal et al.16 we
esti-mate the ratio of the interchain to the intrachain cou-pling constant which would be needed to explain the rela-tively high transition temperature to be larger than 0.06. From crystal considerations, however, this value seems to be very large. For example, AgVP2S6, which is a
com-pound with a structure similar to LiVGe2O6, has a ratio
J⊥/Jk ≤ 10−5.18 Therefore, it seems that the relatively
high transition temperature cannot be explained by the interchain coupling alone. If, however, the Haldane gap is not present, even a very small coupling between the chains might be enough to induce an AF phase transi-tion. Later, we will consider this possibility in terms of a large single-ion anisotropy.
Another remarkable feature of LiVGe2O6 is the weak
influence of B0 on the properties of the AF state. This
applies to TN, is seen in the properties of an apparent
gap in the fluctuations responsible for T1−1 (to be
dis-cussed later), and is evident in the absence of a spin-flop transition for B0 as high as 44.5 T. The last point is
noteworthy because on the basis of a simple mean-field approximation, the spin-flop field (HSF) is expected to
be19
HSF= (2HEHA− HA2)1/2 , (9)
where HAis the anisotropy field and HEis the exchange
field. The field HAis related to the single-ion anisotropy
according to D = HAgµB/S. From these considerations,
D > 50 K, which might be responsible for closing the Haldane gap20 and may explain the relatively high
AF-phase transition temperature TN. Although the
mean-field approximation used here might not be fully appro-priate because HA is comparable to HE, it does allow
us to obtain at least a rough estimate of the single-ion anisotropy using the Hamiltonian of Eq. 8.
It should be pointed out that according to a recent publication,6no phase transition is expected to occur in
LiVGe2O6. In this work, mid-gap states are assumed
to be responsible for the susceptibility anomaly in the experimental data of LiVGe2O6 and it is predicted that
this anomaly will be weaker if their are fewer crystal de-fects and non-magnetic impurities. This interpretation is in clear contradiction with the prior NMR2and neutron
diffraction3experiments and our NMR measurements
and high quality single crystal samples show clearly that a magnetic phase transition occurs and permit us to re-fine the magnetic structure proposed earlier.3 Although
the phase transition appears to be more complicated than a simple ordering driven by inter- and intrachain cou-pling, there is no doubt that the V moments order anti-ferromagnetically below approximately 25 K.
C. T−1
1 as function of T ,B, θ and φ
Although in principle part of the coupling responsible for T1−1 of the7Li spins could be quadrupolar, the
dis-cussion in the next paragraph argues that there is no sig-nificant quadrupolar contribution to it. As a result, our interpretation of T1−1involves only magnetic coupling to
the7Li spins.
There are basically two mechanisms for electric field gradient fluctuations that might contribute to T1−1 of
the7Li spins: Charge fluctuations associated with some
instability of the lattice and the Raman-type phonon process first described by van Kranendonk.21 Since the
quadrupolar splitting found in Sec. III E is very small and does not change over the temperature range stud-ied, there is no reason to expect a significant contribu-tion to T1−1from charge fluctuations. Also, the small7Li
quadrupolar interaction and observed T -dependence of T1−1 rule out quadrupolar relaxation by phonons.21 We
therefore conclude that there is no significant quadrupo-lar contribution to T1−1and that it is caused by magnetic fluctuations. 0.0 0.1 0.2 0.3 0.4 0.5 0.6 inverse temperature T -1 (K-1) 10-4 10-3 10-2 10-1 100 101 102 7Li relaxation rate 1/ T1 (s -1) 9 T 23 T ∆≈11 K ∆≈14 K LiVGe2O6 polycrystal FIG. 18: 7 Li T−1 1 as function 1/T in polycrystalline
LiVGe2O6 at 9.0 and 23 T. The solid dashed lines are fits
to the low T data using Eq. 10. The values shown for ∆ are 14 K at 9 T and and 11 K at 23 T.
In Fig. 18 the spin-lattice relaxation rate, T1−1, of
poly-crystalline LiVGe2O6 is plotted as function of T−1 for
B0= 9.0 T and 23 T. Well into the AF phase below 10 K,
the behavior of T1−1 has the T -dependence expected of
electron spin excitations across an energy gap (∆); i.e. the slope of the curve is constant and negative at low T . If one simply fits the data to
T1−1(T ) ∝ exp(−∆/T ) , (10)
the values obtained for ∆ are 14 K at 9.0 T and 11 K at 23 T.
Such values must, however, be interpreted as an aver-age over a distribution of ∆ that is quite broad. This is seen in Fig 12, where there is a large variation of the slope for two different values of φ at 28.5 T (solid lines), and a large slope at 9 T and φ ≃ 0 (dashed). The two values ∆ =2.6 K and ∆ =14.7 K indicate a very large effect of the alignment of B0 in the azimuthal plane on ∆ for
magnetic excitations at low T . Therefore, the following discussion of the polycrystalline sample results applies to an average behavior and is approximate and phenomeno-logical.
First, consider the effect of B0on ∆. In a 3-d
antiferro-magnet, when there is a gap in the excitation spectrum, it usually depends strongly on B0because of the Zeeman
interaction, which is ∝ gµBB0. Instead, our
measure-ments show the very weak field dependence of less than 3 K for a difference in applied field of 14 Tesla. Since gµBB/kB, with g = 1.79, is about 28 K for B = 23 T,
the usual expectations for the dependence of ∆ on B0do
not apply.
Also, in comparison to our results in Sec. IV B, ∆ ap-pears too small to be attributed to a magnon gap. From ∆ = 14 K and 11 K at 9.0 T and 23 T respectively, one would expect a ∆ ≃ 16 K. From this value, a spin-flop field smaller than 20 T is expected, which is contradicted by the absence of a spin-flop transition up to 44.5 T shown by our NMR-spectrum measurements. On the ba-sis of this evidence, it appears that at low T the magnetic fluctuations responsible for T1−1 in LiVGe2O6 are not
simple magnon excitations. This is particularly evident from the T1−1 measurements shown in Figs. 12 and 13,
where very large anisotropies in T1−1 are seen.
It is rather difficult to identify the microscopic mech-anism responsible for the very large anisotropy of T1−1
shown in Fig. 13, where, for comparison, the variation cos4φ and cos8φ are shown by the dashed and solid lines,
respectively. For example, if it were caused by a fluctu-ating magnetic field aligned with the value of φ corre-sponding to the maximum in T1−1, for other values of
φ, one would expect the much weaker angular variation T1−1∝ cos2φ. Similar arguments for quadrupolar
relax-ation (excluded above from other arguments) by a fluc-tuating EFG could give a variation up to cos4φ.
Although we do not have a microscopic model for it, the temperature and angular variations seen in Figs. 12 and 13 suggest a gap-type behavior with a split-ting which itself is very anisotropic. More work, both experimental and theoretical, is needed to identify the mechanisms for this behavior.
In summary, the angular dependence of the spin-lattice relaxation rate measurements for the single crystal
sam-ples is rather complicated and it is difficult to construct a detailed interpretation. For both the paramagnetic regime and the AF regime down to about 8 K, T1−1 Fig. 11 and Eq. 6 indicate that the largest contribution to T1−1has the angular dependence ∝ sin2θ. This behavior
is consistent with magnetic fluctuations that are predom-inantly along the c-direction that have dipolar coupling and only a small isotropic contribution. It may reflect primarily amplitude fluctuations of the AF order param-eter.
Below about 8 K, the disappearance of the θ-dependence of T1−1 and the emergence of its
φ-dependence indicates that at low T , the origin of the fluctuations responsible for T1−1 is very different from what it is at higher T .
D. Orbital degrees of freedom and magnetic anisotropy
In this section we mention some points about the mag-netic anisotropy and the orbital degrees of freedom of the V electrons in LiVGe2O6 suggested by our
measure-ments. They suggest that the second order splitting ∆CF of the t2g orbitals is rather small, with the
con-sequence that (i) there is a large uniaxial anisotropy as g⊥= 2(1 − λ/∆CF) (λ = spin-orbit coupling) is strongly
reduced for small values of ∆CF, and (ii) orbital
fluc-tuations may play a significant role in the properties of T1−1.
A large anisotropy energy has not yet been observed di-rectly from51V NMR measurements because we were not
able to observe the signal. It can, however, be inferred from several aspects of our 7Li NMR measurements. In
particular, the absence of a significant B0-dependence of
TN (Fig. 7), the absence of a spin-flop transition for B0
up to 44.5 T, and the θ dependence of ∆ν (Fig. 17) all indicate a large uniaxial anisotropy for the static magne-tization. A similar picture emerges from the T1−1
mea-surements above about 8 K, where the θ-dependence of T1−1 (Fig. 11) indicates that the fluctuations of the V
moments are constrained mainly to the c-direction. The situation of the V ions in LiVGe2O6 is similar to
those in V2O3, where it has been reported22that, at least
for the metallic phase, T1−1at the V sites is dominated by
orbital fluctuations. In LiVGe2O6the presence of orbital
fluctuations of the V3+t
2gorbitals is suggested by the
az-imuthal φ dependence of the spin-lattice relaxation rate at the7Li site (Figs. 12 and 13) which is very anisotropic and independent of the magnitude of B0. Furthermore,
orbital fluctuations might be very effective at the51V site
itself, and may be responsible for the absence of the51V
NMR signal.
According to a quantum chemistry analysis of LiVGe2O6,1,2 if ∆CF between the V3+ orbitals is
simi-lar to the hopping integrals between neighboring V sites,
it is not possible to describe the system with a pure spin Hamiltonian and the orbital degrees of freedom have to be included explicitly. Our NMR data indicate that this is the case in LiVGe2O6. Therefore, the Hamiltonian
given in Eq. 8 should be modified to better describe the physics of LiVGe2O6, and include orbital degrees of
free-dom which might or might not be strongly coupled to the spin degrees of freedom.
V. CONCLUSIONS
We have presented pulsed 7Li NMR measurements in
polycrystalline and single crystal samples of the quasi one-dimensional antiferromagnet LiVGe2O6 over the B0
and T ranges 9-44.5 T and 1.5-300 K respectively. They cover both the paramagnetic and the AF phases, for which the transition is at TN ≃ 24.5 K. The
measure-ments include NMR spectra and the relaxation times T1−1
and T2−1, often as a function of alignment of B0. From
the spectrum measurements, we find that in the AF phase the magnetic structure is consistent with that reported on the basis of neutron diffraction measurements,3 but
with the moments aligned parallel to the c-axis. Mea-surements of T2−1 show oscillations caused by the static electric field gradient. The corresponding interaction is quite small and independent of T , which indicates that over the range of T that was covered, no lattice struc-tural transition is observed in LiVGe2O6. The spectrum
measurements also provide the T -dependence of the or-der parameter and show that the transition is either sec-ond order or weakly first order. The coexistence of the two phases over a narrow range around TN and the
be-havior of the NMR linewidth below it is attributed to a distribution of TN in the samples. Both the spectra and
the angular dependence of T1−1indicate that the external field has at most a small effect on the alignment of the AF moment. There is no spin-flop transition up to 44.5 T. These features show that there is a very large anisotropy energy in this material and that the Hamiltonian should include orbital degrees of freedom to adequately describe it. Below 8 K, a rapid dependence of T1−1 on the az-imuthal angle suggests the presence of a low energy gap for magnetic fluctuations that is highly anisotropic.
VI. ACKNOWLEDGEMENTS
The UCLA part of the work was supported by NSF Grants DMR-0072524. Work performed at the National High Magnetic Field Laboratory was supported by the National Science Foundation under Cooperative Agree-ment No. DMR-9527035 and the State of Florida. One of us (A.G.) was supported by the National Institute for Materials Science, Tsukuba, Ibaraki, 305-0003 Japan.
1
P. Millet, F. Mila, F. C. Zhang, M. Mambrini, A. B. Van Oosten, V. A. Pashchenko, A. Sulpice, and A. Stepanov, Phys. Rev. Lett. 83, 4176 (1999).
2
J. L. Gavilano, S. Mushkolaj, H. R. Ott, P. Millet, and F. Mila, Phys. Rev. Lett. 85, 409 (2000).
3
M. D. Lumsden, G. E. Granroth, D. Mandrus, S. E. Nagler, J. R. Thompson, J. P. Castellan, and B. D. Gaulin, Phys. Rev. B. 62, R9244 (2000).
4
F. Mila and F. C. Zhang, Eur. Phys. J. B 16, 7 (2000).
5
J. Lou, T. Xiang, and Z. Su, Phys. Rev. Lett. 85, 2380 (2000).
6
L. Yichang, S. Liqun, H. Inoue, and S. Qin, Phys. Rev. B. 63, 134428 (2001).
7
W. G. Clark, M. E. Hanson, F. Lefloch, and P. S´egransan, Rev. Sci. Instrum. 66, 2453 (1995).
8
G. S. Carter, L. H. Bennett, and D. J. Kahan, volume 20 of Progress in Materials Science, Pergamon Press, Oxford (1977).
9
S. Ravy and A. Thiollet, private comm. (2001).
10
Y. Shapira and S. Foner, Phys. Rev. B. 1, 3083 (1970).
11
H. Abe, H. Yasuoka, and A. Hirai, J. Phys. Soc. Japan 21,
77 (1966).
12
D. Hone, V. Jaccarino, T. Ngwe, and P. Pincus, Phys. Rev. 186, 291 (1969).
13
T. Nagamiya, K. Yosida, and R. Kubo, Advan. Phys. 4, 1 (1955).
14
D. J. Scalapino, Y. Imry, and P. Pincus, Phys. Rev. B. 11, 2042 (1975).
15
T. Sakai and M. Takahashi, Phys. Rev. B. 42, 4537 (1990).
16
D. S´en´echal, Phys. Rev. B. 48, 15880 (1993).
17
A. Koga and N. Kawakami, Phys. Rev. B. 61, 6133 (2000).
18
H. Mutka, C. Payen, P. Molini´e, J. L. Soubeyroux, P. Colombet, and A. D. Taylor, Phys. Rev. Lett. 67, 497 (1991).
19
S. Foner, in Magnetism I, ed. G. Rado and H. Suhl, p. 383, New York and London: Academic Press (1963).
20
H. J. Schulz and T. Ziman, Phys. Rev. B. 33, 6545 (1986).
21
J. V. Kranendonk, Physica (Utrecht) 20, 781 (1954).
22
M. Takigawa, E. T. Ahrens, and Y. Ueda, Phys. Rev. Lett. 76, 283 (1996).