Effects of Data Exploration and Use of Data Mining Tools to
Extract Knowledge from Databases (KDD) in Early Stages of
the Engineering Design Process (EDP)
by
Ma Lorena ESCANDON-QUINTANILLA
MANUSCRIPT-BASED THESIS PRESENTED TO ÉCOLE DE
TECHNOLOGIE SUPÉRIEURE IN PARTIAL FULFILLEMENT FOR THE
DEGREE OF DOCTOR OF PHILOSOPHY
Ph.D.
MONTREAL, JUNE 5, 2017
ÉCOLE DE TECHNOLOGIE SUPÉRIEURE
UNIVERSITÉ DU QUÉBEC
© Copyright reserved
It is forbidden to reproduce, save or share the content of this document either in whole or in parts. The reader who wishes to print or save this document on any media must first get the permission of the author.
BOARD OF EXAMINERS
THIS THESIS HAS BEEN EVALUATED BY THE FOLLOWING BOARD OF EXAMINERS
Mr. Mickaël Gardoni, Thesis Supervisor
Department of Automated Production Engineering, École de technologie supérieure
Mr. Patrick Cohendet, Thesis Supervisor
Department of International Business, HEC Montréal
Mr. Yvan Beauregard, President of the Board of Examiners
Department of Mechanical Engineering, École de technologie supérieure
Mr. Michel Rioux, Member of the Board of Examiners
Department of Automated Production Engineering, École de technologie supérieure
Mr. Vincent Sabourin, External Examiner
Department of Strategy, Social and Environmental Responsibility, UQAM
THIS THESIS WAS PRESENTED AND DEFENDED
IN THE PRESENCE OF A BOARD OF EXAMINERS AND THE PUBLIC ON JUNE 1ST, 2017
ACKNOWLEDGMENTS
The last four years have been some of the most challenging and exciting of my career. For this, I owe credit to my advisors, Mickael Gardoni and Patrick Cohendet. For everything they taught me, their guidance, and the wonderful opportunities they made possible, thank you!
I am also grateful to the board of examiners who took the time to review my thesis, and for their comments to improve the end result: Dr. Yvan Beauregard, Dr. Michel Rioux, and Dr. Vincent Sabourin.
A very special mention to Louis Côté and all the ÉTS Summer School on innovation and
technological design team, Marjolaine, Hélène, Yung, Jorge, Mario and Samuel, who worked
tirelessly to create and manage the course. Thank you for your trust and support.
The continued support by TKM, who provided the data mining software, is also to thank. In particular Mr. Christophe Lecante, Florian and Romain.
I greatly appreciate our research group, Luz Maria J.N., Ahmed C., Mario D., Patrick M., Florent L.N., Arash N., and Thierry Z., for their continuous support throughout my studies. Also, the volunteers at the 24 hours of innovation organization team, the members of DécliQ, and the researchers at the group Conception Innovante, especially Laurence and Marine.
Alejandro, my partner in adventures, also deserves great commendation. Thank you for being in my team, for your support, and your confidence in us.
Mom, dad, este reconocimiento va más allá de mis logros académicos, todo lo que soy es gracias a ustedes, me enseñaron a seguir mis sueños y por siempre se los voy a agradecer.
Antero and Gerardo, you inspire me by following your own paths; I admire your strengths and courage.
Laura and Edgar, thank you for the encouragement, the lively discussions, and most of all, your true friendship.
This doctorate was made possible by the financial support from the Mexican National Council for Science and Technology (CONACyT), and the 2014 Complementary scholarship from the Mexican Ministry of Public Education (DGRI-SEP).
EFFETS DE L'EXPLORATION DE DONNÉES ET DE L'UTILISATION D'OUTILS DE DATA MINING POUR EXTRAIRE DES CONNAISSANCES À PARTIR DE BASES DE DONNÉES (KDD) DANS LES PREMIÈRES ÉTAPES DU PROCESSUS
DE CONCEPTION D'INGÉNIERIE (EDP) Ma Lorena ESCANDON-QUINTANILLA
RÉSUMÉ
Cette thèse décrit des travaux de recherche originaux dont l'objectif était de fournir aux équipes l'accès aux données et d'observer l'effet de son utilisation aux premières étapes créatives du processus de conception d’ingénierie. À la suite d'une recherche théorique sur l'utilisation des technologies de l'information pour soutenir la génération d'idées et l'utilisation des données comme entrée créatif, une procédure a été conçue suite au processus de découverte de la connaissance des bases de données (KDD) et testée sur plusieurs itérations d'amélioration travaillant avec des équipes créatives dans différents contextes. Après deux études exploratoires, trois cas ont été réalisés où le chercheur a tenté de mieux appuyer les différentes étapes du EDP par l'application de données provenant de l'exploitation des brevets. Pour observer les différences, nous avons fourni trois niveaux d'accès pour explorer les données dans un outil de data mining: bas, intermédiaire et élevé.
• Cas 1 - Les participants à une séance de créativité ont été invités à identifier des besoins ou des problèmes (première étape du processus de conception d’ingénierie). Ils ont eu un accès intermédiaire pour explorer les données dans un outil de data
mining; ils pourraient explorer, mais pas faire de nouvelles recherches ou ajouter des
données. L'analyse des résultats indique que les participants gravitent vers des termes et des mots-clés liés à des idées précédemment générées, de sorte que l'augmentation de la nouveauté est faible. Afin de corriger la question de l'exploration intermédiaire, il a été décidé de former les participants à l'utilisation de l'outil de data mining pour les cas suivants; si les équipes ont plus de liberté pour explorer les données, elles peuvent générer des combinaisons plus nouvelles.
• Cas 2 - Les équipes chargées de relever les défis techniques d'un cours ont été formées à l'utilisation de l'outil d'exploration de données. Ils ont ensuite été invités à continuer à utiliser l'outil pour générer de nouvelles idées. Dans ce cas, les équipes avaient un accès élevé à l'outil d'exploration de données; ils ont pu ajouter des données et effectuer des recherches. Les équipes qui ont choisi d'explorer les données pour un soutien créatif ont trouvé des améliorations ou des composants à partir de
solutions existantes pour faire avancer leur propre conception, et ont reçu des évaluations plus positives par un jury d'experts. Cependant, l'objectif d'obtenir des solutions plus diverses ou nouvelles n'a pas été atteint. Une explication possible est que l'utilisation de l'outil peut surcharger les participants avec trop d'options à explorer, menant les équipes à revenir aux solutions connues. Une contre-réaction possible pour résoudre la question de trop d'options est d'avoir un acteur externe (comme un modérateur) extraire des mots-clés à partir des données, et de fournir aux participants ces termes pour combiner dans des idées nouvelles.
• Cas 3 - Les équipes participant à un concours d'innovation ont reçu des mots clés choisis par un expert sur l'outil. Les participants avaient un faible accès à explorer les données dans un outil de data mining. Le chercheur a effectué l'analyse des données pour deux défis dans la compétition, et a sélectionné des mots clés pertinents provenant de la base de connaissances du problème. Les résultats montrent que les équipes qui ont choisi les défis supporté par les mots-clés ont généré des idées plus diverses et nouvelles, par rapport aux équipes sans le soutien. En fournissant des mots-clés pertinents, il était possible d'obtenir les avantages du KDD sans les questions de formation des participants sur l'utilisation de l'outil, et les ressources qui les équipes devraient consacrer pour explorer les données.
En conclusion, les données et le KDD peuvent être utilisés comme une entrée créative pour un EDP à différentes étapes. Il est recommandé de déterminer si l'objectif d'inclure des données dans un effort EDP est de générer une idée nouvelle ou de résoudre un problème. Pour générer des idées nouvelles, il semble préférable de fournir des données sous la forme de mots-clés sélectionnés par un acteur externe, pour inciter les combinaisons originales. Si l'équipe recherche des améliorations ou des éléments de solutions existantes, il semble bénéfique d'avoir accès à une base de connaissances à explorer. Il est important de délimiter l'exploration afin de ne pas être étourdis en raison de la quantité d'information disponible. Pour les trois expériences, le logiciel IPMetrix a été utilisé pour effectuer l'exploration de données. Le processus de sélection, de chargement, de nettoyage et de transformation des données est décrit dans chaque chapitre, en fonction du travail effectué sur les données pour le cas spécifique.
Mots-clés: Processus de conception d'ingénierie, découverte de connaissances, extraction de brevets, exploration de données
EFFECTS OF DATA EXPLORATION AND USE OF DATA MINING TOOLS TO EXTRACT KNOWLEDGE FROM DATABASES (KDD) IN EARLY STAGES OF
THE ENGINEERING DESIGN PROCESS (EDP) Ma Lorena ESCANDON-QUINTANILLA
ABSTRACT
This thesis describes original research work where the objective was to provide teams with access to data, and observe the effect of its use at the early creative stages of the engineering design process. Following a theoretical research on the use of information technologies to support idea generation, and the use of data as creative input, a procedure was designed following the Knowledge Discovery from Databases process, and tried over several iterations of improvement working with creative teams in different contexts.
After two exploratory studies, three cases were performed where the researcher attempted to better support the different stages of the EDP through the application of data from patent mining. To observe the differences, we provided three levels of access to explore data in a data mining tool: low, intermediate and high.
• Case 1 - Participants in a creativity session were asked to identify needs or problems (first stage of the engineering design process). They were given intermediate access to explore data in a data mining tool, meaning they could explore, but not make new searches or add data. The analysis of the results indicates that participants gravitated towards terms and keywords related to previously generated ideas, thus the increase in novelty was low. In order to correct the issue of intermediate exploration, it was decided to train participants in the use of the data mining tool for subsequent cases; if teams have more freedom to explore data, they can potentially generate more novel combinations.
• Case 2 - Teams tasked with engineering challenges in a course were trained in the use of the data exploration tool. They were then invited to continue using the tool to generate new ideas. In this case, teams had high access to the data exploration tool; they were able to add data, and make searches. Teams who chose to explore data for creative support found improvements or components from existing solutions to advance their own design, and received more positive evaluations by a jury of experts. However, the objective of obtaining more diverse or novel solutions was not achieved. A possible explanation is that the use of the tool can overwhelm participants with too many options to explore, leading teams to return to known solutions. A possible counteraction to resolve the issue of too many options is to have
an external actor (such as a moderator) extract keywords from the data, and provide participants with these terms to combine into novel ideas.
• Case 3 - Teams participating in an innovation contest were given keywords selected by an expert on the tool. In other words, participants had low access to explore data in a data mining tool. The researcher performed the data analysis for two challenges in the competition, and selected keywords relevant to the knowledge base of the problem. The results show that teams who selected the keyword supported challenges generated more diverse and novel ideas, compared to teams without the support. By providing relevant keywords, it was possible to obtain the benefits of the KDD without the issues of training participants on the use of the tool, and the resources teams would have to dedicate to explore the data.
It was concluded that data and KDD can be used as a creative input for an EDP at different stages. It is recommended to determine whether the objective of including data in an EDP effort is to generate a novel idea or to solve a problem. To generate novel ideas, it seems preferable to provide data in the form of keywords selected by an external actor, to prompt original combinations. If the team is searching for incremental improvements or elements of existing solutions, then it appears to be beneficial to have access to a knowledge base to explore. It is important to delimit the exploration to avoid becoming stunned because of the amount of available information.
For the three experiences, the software IPMetrix was used to perform the data mining. The process of data selection, loading, cleaning and transformation is described in each chapter, according to the work performed on the data for the specific case.
TABLE OF CONTENTS
Page
INTRODUCTION ...1
CHAPTER 1 CONCEPTUAL FRAMEWORK & METHODOLOGY ...7
1.1 Theoretical background ...7
1.1.1 Engineering design process ... 7
1.1.2 Idea generation ... 9
1.1.3 Bisociation ... 10
1.1.4 Innovation contests ... 11
1.1.5 Data mining tools and techniques ... 14
1.1.6 Knowledge discovery from databases ... 14
1.1.7 Use of data mining for idea generation ... 19
1.2 Methodology ...22
1.2.1 Design Science Research framework ... 23
1.2.2 Evaluation ... 24
1.2.3 Expected results ... 26
1.2.4 Stages ... 26
1.3 Exploratory studies ...27
1.3.1 Outdoor lighting company ... 27
1.3.2 Summer school on innovation and technological design 2015 ... 28
1.4 Design cycle evaluation ...30
CHAPTER 2 BIG DATA ANALYTICS AS INPUT FOR PROBLEM DEFINITION AND IDEA GENERATION IN TECHNOLOGICAL DESIGN ...31
Abstract ...31
2.1 Introduction ...32
2.2 Idea generation sessions ...33
2.3 Big data analytics ...34
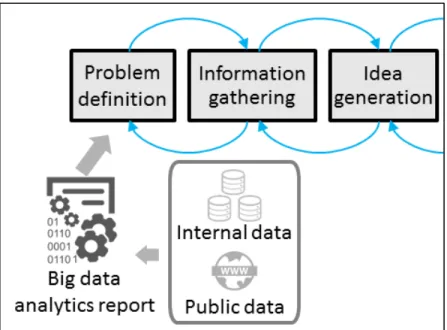
2.3.1 Problem definition / need identification ... 35
2.3.2 Idea generation ... 36
2.4 Application in a higher education setting ...38
2.4.1 Evaluation criteria ... 38
2.4.2 Problem definition / need identification ... 40
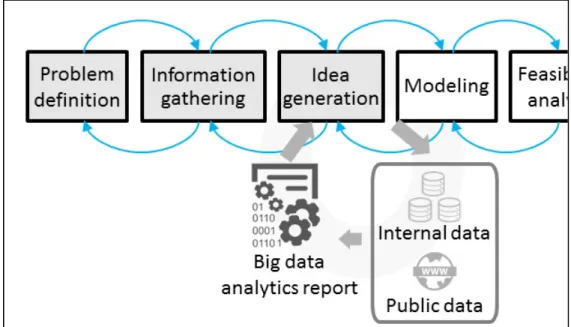
2.4.3 Information gathering ... 43
2.4.4 Idea generation ... 44
2.5 Discussion and conclusion ...45
Page
CHAPTER 3 IMPROVING CONCEPT DEVELOPMENT WITH DATA
EXPLORATION IN THE CONTEXT OF AN INNOVATION AND
TECHNOLOGICAL DESIGN COURSE ...47
Abstract ...47
3.1 Introduction ...48
3.2 Background ...50
3.2.1 Data mining for new concept development ... 51
3.2.2 Patent mining for creativity ... 52
3.3 Hypothesis...53
3.3.1 Evaluation of results ... 54
3.4 Case study ...55
3.4.1 ETS Summer School ... 56
3.4.2 The activity journal ... 57
3.4.3 Team composition ... 58
3.5 Big data for creativity ...61
3.6 Results ...64
3.7 Discussion and conclusion ...71
3.8 Future work ...72
3.9 Design cycle evaluation ...73
CHAPTER 4 PROMPTING INVENTIVE SOLUTION DESIGN WITH KEYWORD CUES FROM PATENT MINING IN AN INNOVATION COMPETITION ...75 Abstract ...75 4.1 Introduction ...76 4.2 Background ...77 4.3 Hypothesis...81 4.3.1 Procedure ... 82 4.3.2 Limitations ... 83 4.4 Case study ...83
4.4.1 The 24 hours of innovation ... 84
4.4.2 Challenge selection ... 88
4.4.3 Data preparation ... 89
4.4.4 Analysis of team solutions ... 94
4.5 Results ...102
4.6 Discussion and conclusion ...106
Page
CHAPTER 5 EFFECTS OF INFORMATION CUES FROM KNOWLEDGE DISCOVERY IN THE EARLY CREATIVE STAGES OF
ENGINEERING DESIGN ...109
Abstract ...109
5.1 Introduction ...110
5.2 Theoretical background ...111
5.2.1 The knowledge discovery from databases (KDD) process ... 112
5.2.2 The engineering design process ... 114
5.2.3 Measuring the creative process ... 115
5.3 Study cases ...117
5.3.1 Data selection ... 119
5.3.2 Data pre-processing, transformation and mining ... 120
5.3.3 Case 1 - Co-located teams, brief session for problem identification ... 120
5.3.4 Case 2 - Co-located teams, short project for concept development ... 122
5.3.5 Case 3 - Distributed teams, very short project for idea generation ... 125
5.4 Evaluation of results ...128
5.5 Discussion ...131
5.6 Design cycle evaluation ...133
CHAPTER 6 DISCUSSION AND CONCLUSION...135
6.1 Summary of cases ...135
6.2 Limitations of the research ...137
6.3 Results ...137
6.4 Discussion of results ...139
6.5 Implications for the industry ...140
6.6 Future work ...141
6.6.1 Engineering design process ... 141
6.6.2 Use of machine learning and artificial intelligence ... 141
6.7 Conclusion ...142
LIST OF TABLES
Page
Table 1.1 Engineering design process ...9
Table 1.2 Comparison between associative and bisociative thought ...11
Table 1.3 Innovation contests categorization ...12
Table 1.4 Sample of innovation contests found in the literature ...13
Table 1.5 Previous studies where data is used to support idea generation and creativity ...20
Table 1.6 Summary of metrics to evaluate the creative process ...24
Table 2.1 Activities followed during the problem definition session ...41
Table 2.2 Results of issues identified per group ...43
Table 3.1 Overview of the Summer School pedagogical program ...57
Table 3.2 Overview of teams ...60
Table 3.3 Problem statement defined by the teams ...61
Table 3.4 Queries performed for each challenge for the data pre-load ...63
Table 3.5 Initial vs. final concepts (before the data mining / big data for creativity lecture)...65
Table 3.6 Analysis of changes to team solutions ...68
Table 3.7 Summary of aspects for evaluation in ...69
Table 3.8 Panel of experts ...69
Table 3.9 Results from expert evaluations ...70
Page
Table 4.2 Evaluation grid used by local and international juries at the
24 hours of innovation competition ...88
Table 4.3 Summary of teams, participants for each challenge ...94
Table 4.4 Summary of types of solution for each challenge ...97
Table 4.5 Team solutions for Type A - Challenge 1 ...98
Table 4.6 Team solutions for Type A - Challenge 3 ...99
Table 4.7 Team solutions for Type B - Challenge 2 ...100
Table 4.8 Team solutions for Type B - Challenge 4 ...101
Table 5.1 Measures used to evaluate the results of a creativity session ...116
Table 5.2 Overview of the three cases: Objective, session duration, teams and participants ...117
Table 5.3 Innovation contest categorization of the three sessions ...118
Table 5.4 Timeline of course followed in case 2 ...123
Table 5.5 Metrics applied to assess the output of the sessions ...129
Table 5.6 Summary of cases and findings ...131
Table 6.1 Summary of the three cases presented in this thesis ...135
LIST OF FIGURES
Page
Figure 1.1 Knowledge discovery from databases ...15
Figure 1.2 Word cloud visualization in IPMetrix ...17
Figure 1.3 Semantic analysis from the Voronoi diagram visualization in IPMetrix ...18
Figure 1.4 Example of the Voronoi diagram in IPMetrix ...19
Figure 1.5 A Three Cycle View of Design Science Research ...23
Figure 1.6 Photograph of work sheets from teams ...28
Figure 2.1 Process for idea generation sessions...34
Figure 2.2 Flow of information to use big data analytics ...36
Figure 2.3 Flow of information to use big data analytics ...37
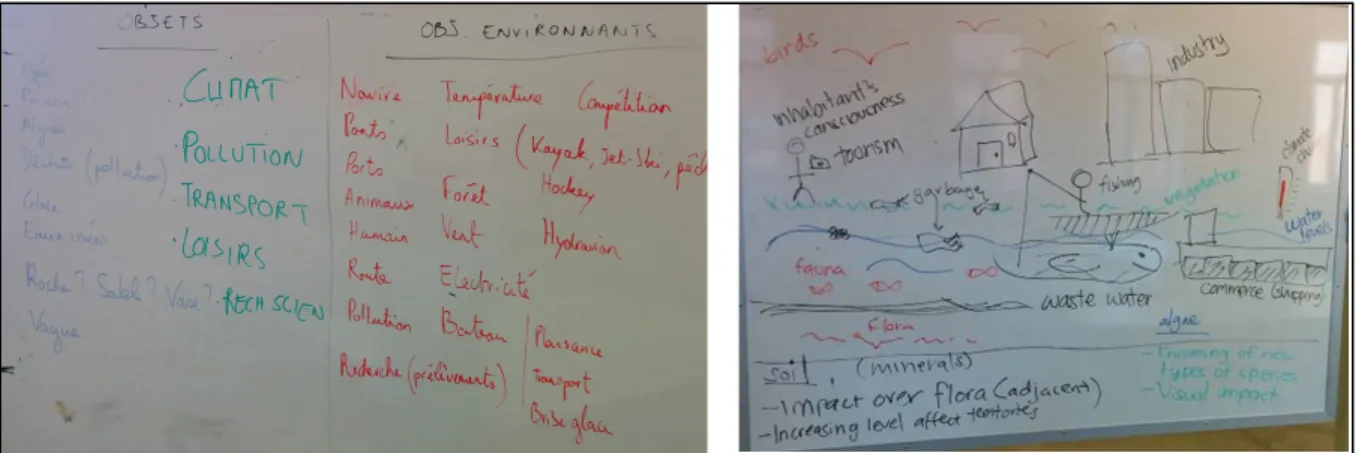
Figure 2.4 Teams list the elements of the issue ...42
Figure 2.5 Teams identify key issues ...42
Figure 3.1 Example of player cards used to form teams ...59
Figure 3.2 Results from teams using the data mining tool vs. teams not using the data mining tool ...70
Figure 4.1 Screenshot of IPMetrix patent search results ...91
Figure 4.2 IPMetrix semantic analysis ...92
Figure 4.3 Voronoi diagram for challenge 1 knowledge domain ...93
Figure 4.4 Screenshots for Challenge 1 (Type A) - Seven solution types ...95
Figure 4.5 Screenshots for Challenge 3 (Type A) - Four solution types ...96
Page
Figure 4.7 Screenshots for Challenge 4 (Type B) - Two solution types ...97
Figure 4.8 Tree comparison for solutions to Type A challenges (1 in blue, 3 in green) ...102
Figure 4.9 Tree comparison for solutions to Type B challenges (2 in blue, 4 in green) ...102
Figure 4.10 Type of solutions for Type A and Type B challenges ...103
Figure 4.11 Elements per comparable constraint in Type A challenges ...104
Figure 4.12 Elements per comparable constraint in Type B challenges ...105
Figure 5.1 Overview of the KDD process ...113
Figure 5.2 Engineering design process ...115
Figure 5.3 KDD steps executed by the researcher and by participants in the three cases ...128
LIST OF ABREVIATIONS
DM Data mining
ED Engineering design
EDP Engineering design process
ICT Information and communication technologies
IS Information system
KB Knowledge base
KD Knowledge discovery
KDD Knowledge discovery in databases
KM Knowledge management
NPD New product development SME Small and medium enterprises
INTRODUCTION Context
Creative teams in engineering are continuously challenged to design novel solutions to our everyday problems. Engineering teams work to solve technological challenges, relying on all the information they can possibly process and retain (Sim & Duffy, 2003). This brings us to the issue of information: a person can only process and retain so much information, but there is a constant stream of new data being generated. The speed with which a domain of technology advances surpasses human capacity to acquire, process, and retain this information.
Information technologies in data mining have advanced in the processing of large amounts of information, which allow for a quick overview of a domain, while also allowing the user (in this case, engineering teams) to dig deeper into the specifics when needed. Compared to other combinations of technology, for example, a web search and a spreadsheet or text document, data mining tools and techniques enable the inclusion of different data sources, the application of different algorithms to obtain a particular view or analysis, and the ability to relate data automatically (Nielsen, 2012).
Though companies are already using data mining to extract business intelligence, companies able to source and process data more efficiently are winning the market. But the applications and benefits are not restricted to business intelligence (forecasting, marketing, etc.); it can also be applied to the design and development of new products, devices and solutions.
The advancement of information technologies now enables a wealth of information to be digitally documented, exploited and reused for further knowledge creation. The information
can be mined using big data techniques to find the most common terms and correlations between ideas (Chen, Li & Hung, 2013).
It is possible to map the connections between concepts in a domain by using big data techniques to analyze the knowledge in patents and scientific articles. The resulting visualizations of information can be used as input to help bolster the creativity of participants generate ideas given that, as described by Hamman (2000), “creative thinking involves a process of iterative activation of ‘cues’”; furthermore, the likelihood of creating new knowledge from recombination is greater as we increment the number of external inspirations (Cohen & Levinthal, 1989, cited in Kabir & Carayannis 2013).
To create something new, it is necessary to combine what we already know (Gilfillan, 1935; Schumpeter, 1939; Nelson & Winder, 1982; Basalla, 1988, and Fleming & Sorenson, 2004 cited in Fleming & Szigety, 2006). Arthur Koestler (1964) coined the term bisociation, a creative act where a situation or idea is perceived in two incompatible frames of reference (can also be defined as associative contexts, types of logic, codes of behavior, universes of discourse, matrices of thought) and the subject is able to meld them together by “thinking aside”.
Research problem
As mentioned before, there is a difficulty to be solved between the large amounts of information available for creative teams, and the time and effort it requires to process. It is estimated that engineering designers can spend up to 30% of their time searching for information relevant to their problem (Sim & Duffy, 2003). Data mining tools can help condense the information and make exploration easier for teams. The problem addressed in this thesis is to determine the stages in the process where this creative support can generate greater benefits, particularly regarding the variety of ideas, and novelty of the final solution.
Objectives
This research aims to propose and observe the use of data mining tools and data as input for the early creative phases of engineering design. The specific objectives are:
1) Review the literature on the use of data as input for creative design
2) Determine the stages of the engineering design where data mining tools and data can be integrated to support the process
3) Propose the use of data mining tools and data to creative engineering teams at different stages of the process
4) Document the results of the use of data mining tools and data in the EDP
Research question
The following research question guided the work during this thesis:
How can the use of data mining tools and data support early creative stages of engineering design?
Scope
The work described in this thesis aims to propose the use of data mining tools, and the resulting information for analysis and insight, to support the early creative stages of engineering design. It does not, however, include the materialization of a concept into a functional product. It also covers the results at a team level, not individual, meaning it does not take into account the creative production of individual team members, but the result of the effort of the team as a whole. It is also worth noting that the application is limited to engineering design.
Structure of the thesis
As this is a thesis by articles, first a theoretical framework is presented, which guided the case studies. Then, chapters 2 to 5 present the case studies and results of the research work, and finally, a conclusion and discussion completes this work:
• Chapter 1 presents the conceptual framework for the work here documented. It discusses the theories enabling the development of the thesis, the methodology, Design Science Research, an introduction to idea generation and bisociation, Data mining, Knowledge discovery from databases (KDD) and Engineering design process (EDP).
• Chapter 2 presents article 1, “Big Data Analytics as Input for Problem Definition and Idea Generation in Technological Design”, in which teams have to identify new issues or problems in a domain. This article was presented in the PLM16 conference in Columbia, SC, USA on July, 2016, and later published as part of the proceedings of said conference. • Chapter 3 presents article 2, “Improving concept development with data exploration in
the context of an innovation and technological design course”, which documents the development of a prototype for the same challenges, where half the teams opted to use the data mining tool to explore data related to the problem domain. This article has been published in the International Journal on Interactive Design and Manufacturing
(IJIDeM) on February, 2017.
• Chapter 4 presents article 3, “Prompting inventive solution design with keyword cues from patent mining in an innovation competition”, where participants in an innovation competition propose novel solutions to the issues stemming from the session in Chapter 2. This article has been submitted to the Creativity and Innovation Management journal. • Chapter 5 presents article 4, “Effects of information cues from knowledge discovery in
the early creative stages of engineering design”; it describes the findings from the three cases in terms of the support that data exploration and the results from data mining
provided the creative teams at different stages of the engineering design process. This article has been submitted to the Journal of Engineering Design.
• Chapter 6 presents the discussion and conclusion. The chapter includes a summary of the cases, an overview of the articles presented, the limitations of the research, a discussion of the results, implications for the industry and future work, which is divided into future work on engineering design, and on the application of data mining tools for engineering design.
Abstracts and conference communications
Additional communications were presented at conferences during the development of this research. For clarity and length purposes, they are not included in this thesis. The works are described in the following paragraphs.
The first work presented at a conference was an abstract entitled “Opportunities to exploit Big data in idea generation sessions”, presented by co-author Mickaël Gardoni at the International Conference on Industrial Engineering and Operations Management IEOM15 in Dubai, UAE on March 3 - 5, 2015. The abstract was prepared by Ma-Lorena Escandon-Quintanilla and Patrick Cohendet as well. In this paper, the authors identified the stages of the idea generation process where big data tools and techniques could be used to support creative teams. They suggest creative teams can benefit from big data analytics throughout the idea generation process: to identify areas of opportunity (need identification), have information as input for inspiration (information gathering), identify unrelated ideas to promote bisociation (idea generation), and to obtain insight from a large amount of ideas from a crowdsourcing effort (evaluation).
The first conference article, "Strategies to employ social networks in early design phases (idea generation)", was written with Luz-Maria Jimenez-Narvaez, and Professor Mickael
Gardoni for the 20th International Conference on Engineering Design ICED15, which took place in Milan on July 27-30, 2015. It discusses the use of social media as input for creative teams trying to solve a problem, identifying the different issues when adding a new technology to an idea generation session. One key takeaway from this particular paper is the need to facilitate recombination in creativity sessions, a recurring theme in this work.
Two papers were presented by Ma-Lorena Escandon-Quintanilla at the 13th IFIP International Conference on Product Lifecycle Management PLM16, which took place July 11-13 in Columbia, SC, USA. The first paper, penned with Mickaël Gardoni and Patrick Cohendet, titled “Big data analytics as input for problem definition and idea generation in technological design” is presented in Chapter 2 as it is directly linked to the articles derived from the work presented in this thesis, in Chapters 3, 4 and 5.
The second paper presented at PLM16 was composed with colleague and first author Patrick Mbassegue and Professor Mickaël Gardoni. The work, “Knowledge Management and Big Data: opportunities and challenges for small and medium enterprises (SME)” presents a theoretical basis for the opportunities and challenges that can stem from the use of big data tools and techniques in the context of knowledge management for SMEs, considering their particular limitations regarding their financial, human and technological resources.
CHAPTER 1
CONCEPTUAL FRAMEWORK & METHODOLOGY
This chapter presents the conceptual framework and methodology that supported the development of the thesis. First, the theoretical background is described: the first section introduces the concepts of Engineering design process (EDP) and Knowledge discovery from databases (KDD), as well as an overview on the uses of data as an input for creativity. Then, the chapter continues to present the methodological framework applied to guide the definition of goals for each experience and the continuous improvement for future iterations.
1.1 Theoretical background
This first section of this chapter presents the theoretical background that helps frame the cases followed in this thesis. It presents the existing literature on engineering design process (EDP), knowledge discovery from databases (KDD), the use of data as creative input, data mining for creativity, and bisociation. A deeper understanding of creative teams and their process provided the basis for the design of the information support during the three cases.
1.1.1 Engineering design process
Though the concept originated much earlier, the Accreditation Board for Engineering and Technology (ABET), defined Engineering Design in 1996 as “the process of devising a system, component, or process to meet desired needs. It is a decision making process (often iterative), in which the basis sciences, mathematics, and engineering sciences are applied to convert resources optimally to meet a stated objective” (in Ertas & Jones, 1996, page 2).
Engineering design process is the series of steps, stages or activities an engineering team goes through when designing a new solution to an engineering problem (Sim & Duffy, 2003, Atman et al., 2007). The process is usually described as being non-linear and iterative, designers go back and forth between stages or activities when they are faced with an issue, or discover new information about the problem. Shneiderman et al. (2006) proposed the following phases for new product development cycles:
1) Problem definition (need identification) 2) Information gathering
3) Idea generation
4) Modeling (description of potential solutions) 5) Feasibility analysis
6) Evaluation 7) Selection 8) Communication 9) Implementation
Atman et al. (2007) later completed the above process with “Need identification” to adapt the process to the Engineering Design Process (EDP), shown in Table 1.1.
Table 1.1 Engineering design process, taken from Atman et al. (2007)
Design stages Design activities
Problem scoping Need identification Problem definition Information gathering Development of alternative solutions Idea generation Modeling Feasibility analysis Evaluation Project realization Selection Communication Implementation
The design process is usually performed in the form of work sessions, which set an environment and implement creativity techniques that help participants produce, combine and express ideas.
It has been found that more experienced engineers spend more time in the initial phases of the process (Atman et al., 2007), as they know through experience that more information in the first stages will ultimately save time and iterations later.
1.1.2 Idea generation
Idea generation “is central to engineering design” (Glier et al., 2011), and it is a fundamental
step of the innovation process. Ideas are not fully developed solutions that can be patented or launched to market, they are a notion in development, and will need further work. According to Cohendet, Parmentier and Simon (2016), a larger investment of resources is required for an idea to be developed into a concept with value that can be implemented.
Studies show that creativity techniques are useful, and they usually induce participants to explore ideas “outside their normal frame of reference” (Dove & Jones, 2014). Ideas of others sometimes promote the creation of related ideas or new ideas, working as a sort of “intelligent trigger” (Munemori, Yoshino & Yunokuchi 2001) where one piece of information triggers the generation of new ideas. However, more research is needed to find how to support idea generation using ICTs (Ardaiz-Villanueva et al., 2011).
1.1.3 Bisociation
In the middle of last century, Arthur Koestler found that innovative ideas are generated when two fields of knowledge previously considered incompatible are connected in a bisociation; the juxtaposition creates a spark of creativity that leads to something completely different from existing solutions to a problem (Koestler, 1964). This belief has been also postulated under different terms, such as conceptual blending or forced relationships.
Koestler suggests that really creative combinations “result from a blending of elements drawn from of two previously unrelated frames or matrices of thought into a new matrix of meaning by way of a process involving comparison, abstraction and categorization, analogies and metaphors” (1964). Nielsen echoes the feeling by stating that creative ideas stem from the combination of unrelated ideas (2012).
Bisociation is trying to blend together to domains of knowledge, disciplines or ways of thinking that are seemingly unrelated or incompatible, and coming up with something completely different. Thinking in one single matrix can perform tasks only of a kind already encountered in past experience, this is associative thought; it is not capable of original, creative achievement. Table 1.2 shows the contrast between associative and bisociative thought:
Table 1.2 Comparison between associative and bisociative thought, taken from Koestler (1964)
Associative thought (habit) Bisociative thought (originality) Association within the confines of a given
matrix
Bisociation of independent matrices
Guidance by pre-conscious or extra-conscious processes
Guidance by sub-conscious processes normally under restraint
Dynamic equilibrium Activation of regenerative potentials Rigid to flexible variations on a theme Super-flexibility
Repetitiveness Novelty
Conservative Destructive-Constructive
1.1.4 Innovation contests
Two cases presented in this thesis were performed during innovation contests. An innovation contest is defined by the participation of teams usually trying to solve a technological problem in a defined amount of time. Innovation contests can seem similar from afar, but they are all unique, as they have different purposes, durations, and target audience, among other things. Adamczyk, Bullinger and Möslein (2012) made a categorization of the different elements in innovation contests, shown in Table 1.3.
Table 1.3 Innovation contests categorization taken from Adamczyk, Bullinger & Möslein (2012)
Attraction
(marketing / activation) Online, offline, mixed Community functionality Given, not given
Contest period Very short term, short term, long term, very long term Contest phases One, two, more
Degree of elaboration Idea, sketch, concept, prototype, solution, evolving Evaluation Jury evaluation, peer review, self-assessment, mixed Facilitation Professional facilitation, peer facilitation, mixed
Media Online, offline, mixed
Organizer Company, public organization, non-profit, individual Participation as Individual, team, both
Replication Biannual, annual, less frequent, more frequent Reward / motivation Monetary, non-monetary, mixed
Sponsorship / partnership
Family, friends and colleagues, universities, national associations, specific industries, state and local agencies, mixed
Target group Specified, unspecified
Task / topic specificity Open task/low, specific task/high
Several cases have been documented where organizations and companies have used innovation contests to obtain ideas and develop new products with actors outside their boundaries. A sample of cases found in the literature can be seen in Table 1.4.
Table 1.4 Sample of innovation contests found in the literature
Initiative Description
IBM Innovation
Jam
IBM used an internal application to bring together employees around to world to generate ideas for new business units. Participants are encouraged to comment on the ideas of others and a jury selects the best ideas to be then implemented in the company. (Bjelland and Wood 2008)
IdeasProject by Nokia
IdeasProject was the “first external idea crowdsourcing” effort by Nokia to obtain ideas from clients, developers and just about anyone in the crowd. They used text-mining, clustering and regression analysis to study the data and made an internal report to use as creative input. (Vuori, 2012)
Innocentive Open innovation site where individuals or organizations publish challenges and offer a cash prize for the winning participant (Wagner & Jiang, 2012).
Lego Mindstorms
Lego deployed a “virtual product design space” (Majchrzak & Malhotra, 2013) for users to create their own design. Lego selects the winners, awards a prize but keeps all intellectual property.
My Starbucks
Idea
Starbucks set up a website as a way for consumers to propose new products, experiences and actions. Just as Lego, they keep the intellectual property, however no rewards are given (Rosen, 2011).
Netflix Prize
Netflix invited teams of programmers to come up with a better recommendation algorithm, the teams could see the leaderboard (but not the actual codes from other teams), and the winning team got $1 million USD (Rosen, 2011).
The cases documented in the literature have gaps in information use that we will attempt to resolve in this thesis through the exploration of data from a KDD process. First, in most cases the participants receive little or no information about the knowledge domain; they rely on participants’ own knowledge and experiences to generate ideas. In this respect, the ideas could fall short in the novelty spectrum, as participants tend to resort to known problems and solutions, and combine common ideas.
A second limitation is that participants are experts in the domain, for example in the Netflix and the Innocentive cases, and can therefore be fixated to domain or industry paradigms. By involving students with technical knowledge, and prompting them to combine it with data from the application domain, the novelty and diversity of ideas can potentially be increased.
1.1.5 Data mining tools and techniques
Data mining is the application of software algorithms to a set of data to find correlations, trends and other patterns in data, such as regressions. Data mining tools are the software applications that enable the processing of data and application of these algorithms. The extraction of these patterns and trends in the data allow us to see new connections, new perspectives, easily re-organize the ideas, assess and preserve them.
1.1.6 Knowledge discovery from databases
It has always been important for companies to extract information from data, be it from within the organization, or outside data (patents, scientific articles, social media posts and content). It is possible to distinguish three levels of information in organizations (Ackoff, 1989):
• The data which represent facts and is often quantitative
• The information as data aggregates. These are built according to rules and require human intermediation (or at least a consensus as to their meaning)
• The knowledge perceived as high-value information and requires human expertise
The purpose of analyzing the data is to have better information that leads to better informed decision making in all aspects of a business. Software tools can apply algorithms to large sets of data to find relevant trends and patterns (Fayyad, Piatetsky-Shapiro & Smyth, 1996).
Knowledge discovery is an interdisciplinary area that focuses on methods and techniques for extracting useful knowledge by analyzing large sets of data (Fayyad, Piatetsky-Shapiro & Smyth, 1996). Its purpose is the conversion of low-level data, which is normally too
voluminous to be explored and analyzed manually, into a more compact, abstract or useful format (Fayyad, Piatetsky-Shapiro & Smyth, 1996).
Figure 1.1 shows the steps involved in a KDD process, where it can be observed that data mining is one of the steps of KDD. In the context of a KDD process, data mining is bound to the application of data analysis and discovery algorithms to the data with the objective of extracting a pattern.
Figure 1.1 Knowledge discovery from databases
taken from Fayyad, Piatetsky-Shapiro & Smyth (1996), Baesens (2014)
Closely related to KDD is the concept of big data. Big data is defined by the availability of large quantities of data where traditional methods and algorithms are not applicable, and new approaches are required to process the data. Some authors refer to the three V’s, volume, velocity and variety (Gartner’s Laney, 2001, in Kabir & Carayannis 2013) as the criteria for big data.
On the other hand, Howkins (2002) explains that the criteria for big data is not only the size, but the variety in the data, the potential relationships between the data and the need for new
tools to be able to exploit the data (see also Maniyka et al., 2001 cited in Kabir & Carayannis 2013).
1.1.6.1 TKM’s IPMetrix (data mining tool)
For the three cases presented in this thesis, the author used the software IPMetrix by French company TKM to perform the KDD steps. TKM is a consulting and information services company; their expertise is the exploitation of scientific data sources such as patents, scientific publications and project reports to map collaborations, patent filings and patent evolutions. It is because of the automated analysis of scientific documents and visualizations that this software was chosen to be used for the cases presented here. The company was not involved in the preparation of the data, or the cases themselves.
For the semantic analysis visualization on the IPMetrix tool, TKM uses TF-IDF as a base to determine the most important terms in documents uploaded to the database (meeting with Florian Carichon-TKM, March 2017). TF-IDF stands for term frequency-inverse document frequency. TF is the number of occurrences of a term in a document (Manning et al., 2009), and IDF is a measure used to minimize the effects of the terms that occur frequently in a collection of documents, but do not add value in determining relevance (Manning et al., 2009). The combination of TF and IDF result in a total weight for each term in every document, the equation for the TF-IDF is shown below.
The formula for IDF is shown below, where N is the total number of documents in a collection, and document frequency (df) is the number of documents in the collection that contain a term t.
= (2.2)
According to Manning et al. (2009), TF-IDF has the following characteristics:
• A term obtains high value when it occurs multiple times in a small group of documents. • A term obtains lower value when it appears a lower amount of times in a document or it
appears in many documents.
• A term obtains the lowest value when it appears in all documents constantly.
Figure 1.2, Figure 1.3 and Figure 1.4 present different visualizations that can be extracted from the IPMetrix tool to have a general overview or explore data in detail in a particular domain of knowledge.
Figure 1.3 Semantic analysis from the Voronoi diagram visualization in IPMetrix
To generate a Voronoi diagram, which is a form of visualization where term clusters are arranged in partitions in a plane, the terms in the documents are mapped into vectors. The vectors are then clustered together according to similarity. IPMetrix follows these steps for semantic clustering:
1) Extraction of words and expressions from all the documents uploaded to the database. 2) Lemmatization and stemming of the different keywords and expressions to group words
into lexical families.
3) Assembly of a "stop words" list to filter common keywords and expressions. 4) Creation of vectors to represent the different documents.
5) Application of K-means method to create clusters.
6) Valuation of TF-IDF of clusters to determine the representative keywords/expressions. 7) Display the 20 keywords or expressions with the largest TF-IDF ratio.
Figure 1.4 Example of the Voronoi diagram in IPMetrix
1.1.7 Use of data mining for idea generation
Whenever a new technology is made available, it is worth finding possible uses in different domains. Howkins (2002) urges companies to use data in a more creative fashion because it is a resource that can be reused and analyzed in different ways to find new insights. While the task of mapping a domain of knowledge and visualize connections between concepts has been facilitated by technologies of data mining and visualization, we have yet to develop technologies that generate new and innovative ideas. Some authors have already attempted to
use data as an input for idea generation; Table 1.5 shows a sample of interesting previous studies where data is used to support idea generation and creativity:
Table 1.5 Previous studies where data is used to support idea generation and creativity
Authors Type of study
Creativity
support Objective Findings Maccrimmon & Wagner, 1991 IS design Data prompting Support the generation of alternative ideas using data
Free-form techniques help generate ideas, but users need more stimulating techniques to continue being productive.
Hamman, 2000 IS
design
Cues and suggestions
Propose the use of an IS to support the creativity of music composers
Algorithms can be used to propose combinations to inspire composers.
Software and visualizations can support creation.
Müller et al. 2012 IS design Data attributes and visualizations Create a software to support identification of unexplored biomedicine research areas
The software can help
researchers look at data in new ways to help generate
hypotheses. Chen, Li & Hung, 2013 Case study Data correlation report for interest analysis
Use of big data techniques to analyze the results of
crowdsourced idea generation
Organizers of large scale idea generation can benefit from DM to assess results.
Shan, Zhu & Zhao, 2013 IS design Idea network exploration Support brainstorming by recommending computer generated ideas using idea networks
Participants perceived that image suggestions were useful to generate ideas, but
encyclopedia entries were not as useful.
Dove & Jones, 2014
Case study
Data visualization
Explore the use of aggregated data to support idea generation in workshops
Use of data supported
collaboration and engagement, helped participants build upon their knowledge. Idea novelty not as expected.
Data mining technologies are about finding similarities, trends and correlations, and it is up to people to evaluate the results and gain insights. However, if we follow Koestler’s theory
that there is value in connecting what is separated or incompatible, we must then search for the disconnections.
Shan, Zhu and Zhao (2013) believe that using data in the idea generation process can help participants get “unstuck”, and that by using data and information exploration there is enormous potential for insight discovery. Dove and Jones (2014) propose that data can be useful to aid in the idea generation process, especially when there is no predefined outcome. From the process by Shneiderman et al. (2006) and Atman et al. (2007), we believe data can be used in four moments of the collaborative idea generation process for engineering design:
• Need identification / problem definition. Data mining permits the analysis of data in a way that was not possible before, by bringing together different sources of information and finding trends that are only visible with large amounts of data. This will make it easier to visualize the gaps in a domain (Müller et al., 2012).
• Information gathering. Data from different sources can be mined and used as input for information gathering, increasing the external stimuli for teams developing an engineering solution (Dove & Jones, 2014).
• Idea generation. Data mining tools and techniques can be used to identify which ideas are not being connected, but are already in the knowledge base of participants or in the domain. The purpose would be to enable bisociation, to connect two frames of reference previously considered to be incompatible (Koestler, 1964; Nielsen, 2012).
• Evaluation. A wealth of information is generated throughout the development of a concept or solution; unfortunately, only a few of the ideas are developed, and the rest are discarded. Data can help identify interesting concepts and keep the data for future developments (Chen, Li & Hung, 2013).
1.1.7.1 Bisociative networks
Some authors have already undertaken the task to automate bisociation in what they call “bisociative networks”. Proponents of bisociative networks have suggested three types of networks can support bisociation (Dubitzky et al., 2012):
• Bridging concepts (one concept links two graphs or clusters) • Bridging graphs (a graph links two other graphs or clusters) • Structural similarities (two graphs have the same shape)
However, in their proposition, the links they find in the networks are between already connected elements. To inspire participants in an idea generation session to combine elements that are distant or disconnected, we need to find them.
1.2 Methodology
The second section of this chapter is concerned with the methodological framework guiding this work. An iterative methodology was selected, as it facilitates increasing the understanding of the issues and a cyclical improvement of the use of data mining tools and data as a creative input.
Design Science Research was selected because of the practical approach of analyzing the current state of the application domain, the iterative process to improve the design of a device or process, and finally the grounding of the findings into new applicable knowledge.
1.2.1 Design Science Research framework
The researcher selected the Design Science Research (Hevner, 2007) approach because it enables a research based on the study of the current environment. This will provide an understanding of how the engineering design process functions today and where in the process the participants are able to benefit more from the input of information.
Once the process has been designed, it is implemented and evaluated, giving basis for further improvements, and serving as foundation to build a knowledge base for new theories and methods. The research methodology allows iterating solutions progressively, improving the process designed at each stage of the research (Figure 1.5).
Figure 1.5 A Three Cycle View of Design Science Research Taken from Hevner (2007)
Following the Design Science Research methodology, each chapter will present an evaluation of the results and the implications for the research, in the final section called “Design cycle evaluation”.
1.2.2 Evaluation
The creative process is measured by different metrics depending on the authors; they propose to evaluate idea generation by the process or by the outcome, using the criteria of quality, quantity, variety and novelty. Table 1.6 summarizes the metrics found in the literature along with a brief definition.
Table 1.6 Summary of metrics to evaluate the creative process
Metric Definition
Applicability
Measures how much the concept complies with the pre-defined needs, and includes the viability of the concept in the context. (Ardaiz-Villanueva et al., 2011)
Conclusion characters
The amount of characters in the developed concept. (Munemori & Nagasawa, 1996)
Chats Number of communications between participants in a session or project.
(Munemori & Nagasawa, 1996, Yuizono et al., 2005)
Comments Number of feedbacks received by an idea shared by a participant.
(Ardaiz-Villanueva et al., 2011)
Complexity Refers to the participants taking initiative and dividing the problem into
sub-systems for further development. (Ardaiz-Villanueva et al., 2011)
Ideas evaluated Number of ideas evaluated by other participants, indicates external interest
on the idea. (Ardaiz-Villanueva et al., 2011)
Ideas shared Number of ideas shared by the participants with others. (Graetz et al., 1997) Level of detail Level of detail for the concept provided by the participant. (Wodehouse &
Ion, 2012)
Novelty Degree inventiveness, measured by the principles used in the solution.
(Ardaiz-Villanueva et al., 2011, Glier et al., 2011, Wodehouse & Ion, 2012)
Number of ideas
Amount of ideas produced by the participants for a session or project. (Ardaiz-Villanueva et al., 2011, Glier et al., 2011, Graetz et al., 1997, Jung, Schneider & Valacich, 2010, Munemori & Nagasawa, 1996, Parjanen, Hennala & Konsti-Laakso, 2012, Wang & Ohsawa, 2013, Wodehouse & Ion, 2012)
Participants Number of participants involved in the creative process. (Yuizono et al.,
Table 1.6 Summary of metrics to evaluate the creative process (continued)
Metric Definition
Perceived team cohesiveness / effort
Indicates how much participants felt integrated as a team, and how much effort they perceived from their teammates. (Graetz et al., 1997)
Quality of concepts / ideas accepted
Degree to which the concept responds to the needs of the problem or established filters. (Glier et al., 2011, Jung, Schneider & Valacich, 2010, Wang & Ohsawa, 2013, Wodehouse & Ion, 2012) *Note: The author believes this is actually ‘Applicability’
Cards / Notes
Measure of the process by the amount of individual contributions. It is not the same as an “idea”, as one record can contain multiple ideas, one concept formed by several ideas, or just a principle with no grounded idea.
(Gumienny et al., 2013, Yuizono et al., 2005)
Time
Different authors measure time according to their particular focus, for example: time to reach a conclusion, time to generate ideas, time to develop ideas, time to make a decision. (Graetz et al., 1997, Gumienny et al., 2013, Munemori & Nagasawa, 1996, Yuizono et al., 2005)
Variety If the ideas produced are clustered by principle, variety measures the
different categories. (Glier et al., 2011, Wodehouse & Ion, 2012)
Whiteboard events Number of times the participants went into the system to collaborate or
provide ideas. (Gumienny et al., 2013)
To the knowledge of the author, there is currently no method to objectively measure the value of an idea, therefore the results cannot be evaluated based on the result of the EDP. It is also assumed that the concepts will be applicable to the problem at hand. Consequently, the focus will be on the four metrics in the present work:
• Number of ideas (productivity) • Complexity (sophistication) • Variety of ideas
1.2.3 Expected results
Harnessing data at different stages of the EDP, idea generation could see an improvement in the complexity and variety of the resulting concepts. Complexity refers to the level of subsystems considered in the study of the problem (Ardaiz-Villanueva et al., 2011), while the variety measures the number of categories in which the solutions could be divided (Glier et al. 2011, Wodehouse & Ion 2012).
An increase in both this metrics would suggest that the participants were able to look for different types of solutions and did not gravitate towards known solutions. It is expected that the number of ideas will not increase significantly, or will even decrease, given that the creativity exercise is not to diverge in a brainstorm but to try to find a new way to connect the disconnected elements. However, we expect that sessions where participants are given concepts to blend will result in a greater variety of technical solutions and with increased novelty compared to teams who do not have this support.
1.2.4 Stages
To be able to achieve the necessary knowledge to design the process and evaluation procedure to include the use of data from KDD in the context of an engineering design, the following stages are necessary:
1) Literature review
2) Develop protocol for data mining tool use in EDP 3) Design evaluation tool to specific conditions of EDP 4) Gather data for incumbent domains (KDD)
6) Analyze results
1.3 Exploratory studies
To determine the environment and current issues with the EDP followed by engineering teams, two exploratory cases were performed to observe areas of opportunity to support teams in the early stages, particularly for idea generation. The cases documented in this provided a base to theorize the proposed process to follow in subsequent cases.
1.3.1 Outdoor lighting company
The first experience using big data analytics as input for creativity was during a 6 hour ideation session with 2 teams of 6 participants in an outdoor lighting company on January 23, 2015. The purpose was to generate ideas for new research projects.
The data mined were concepts from global design contest. Teams were asked to make bisociations with concepts to refine the proposed ideas. The process for the session was the following:
• Preparation - Concepts mined from global design contest (before session) • Divergence
• Convergence
• Teams were asked to make bisociations with the concepts to refine the proposed ideas. • Participants selected the concepts to bisociate
The result observed was that participants selected concepts already in their ideas (for an example, see Figure 1.6).
Figure 1.6 Photograph of work sheets from teams
Following the Design Science Research approach, the researcher learned that for the following idea generation sessions, it is necessary to have a moderator or guide in each group to motivate participants to make unexpected combinations, and not select the concepts which only serve to reinforce their current propositions.
1.3.2 Summer school on innovation and technological design 2015
An opportunity to explore the capabilities of data mining and exploration in the context of idea generation was implemented during the 2015 ETS International Summer School on innovation and technological design. The challenges were initially presented in the innovation contest “Les 24 heures de l’innovation”, and were then retaken by the Summer school participants. The researcher used a data mining tool (not TKM’s IPMetrix) to provide students with access to data related to their projects.
In this preliminary case, 21 students worked on three challenges, one related to solving a parking issue, a second on the development of an automated garbage collection vehicle, and a third one on the automation of a warehouse with robots.
Two efforts were made in using data mining tools to support the engineering design process of teams, as they had the mandate to develop a prototype. For the first attempt, the researched utilized the software tool from a company based in Montreal, which required manual tagging of patents to identify relevant information. It also did not have automatic document import directly from patent database providers, thus the researcher had to download patents one by one, a time-consuming process.
The second attempt was the use of data from social media. Another local company from Montreal that specializes in the analysis of social media posts offered to make an extraction of publications related to the issues being tackled. Each team received a report to be analyzed by themselves.
The first tool proved too inefficient for the researcher to upload large amounts of documents and perform the manual tagging, and complicated for participants to explore the data. With the second tool, the data was only useful to support their arguments in presenting their solutions.
A second issue, unrelated to the data, was the ownership of the problems being solved. The students in this case had clients who dictated the expected outcome, and were bound by those constraints. For the subsequent cases, several desirable conditions were defined:
• Access to a data mining tool with more upload capabilities
• Access to a data mining tool with better ease of use for final users • Open problems with no external clients
1.4 Design cycle evaluation
The exploratory studies presented at the end of this chapter were a building stone for the subsequent cases. After the execution of these cases, the author was able to determine the characteristics needed for the cases to be able to better implement the utilization of the KDD in an ED process.
The opportunity for such cases was discovered with the AquaHacking competition, by the de
Gaspé Beaubien Foundation. This competition, open to everyone, aims for teams to propose
innovative solutions for the conservation of bodies of water, and awards the best initiatives to support the development of start-ups.
The following three chapters (Chapters 3, 4 and 5) each present a case where the EDP was supported by the use of KDD. Each case presents an increase in the scope of the EDP and the involvement of participants in the KDD.
CHAPTER 2
BIG DATA ANALYTICS AS INPUT FOR PROBLEM DEFINITION AND IDEA GENERATION IN TECHNOLOGICAL DESIGN
Ma-Lorena Escandón-Quintanilla1, Mickaël Gardoni1,2, and Patrick Cohendet3 1 École de Technologie Supérieure, Montréal, Canada
2 Institut National des Sciences Appliquées, Strasbourg, France 3 HEC Montreal, Montreal, Canada
Published in: PLM 2016, IFIP AICT 492 proceedings
This article documents the first case where a design session was held to identify problems related to the theme of a start-up competition. Participants were self-selected, as they responded to an open call published on the school weekly newsletter. To generate ideas, teams first worked by themselves, and after were provided with access to a data exploration tool to find hints for new areas of opportunity. The paper discusses the observed results and future work.
This paper was presented at the IFIP International Conference on Product Lifecycle Management PLM16 in Columbia, South Carolina, USA on July, 2016.
Abstract
Big data analytics enables organizations to process massive amounts of data in shorter amounts of time and with more understanding than ever before. Many uses have been found to take advantage of this tools and techniques, especially for decision making. However, little applications have been found in the first stages of innovation, namely problem definition and idea generation. This paper discusses how big data analytics can be utilized in those stages. It
includes an example of application in problem definition and proposes a case study implementation in a higher education setting for idea generation.
2.1 Introduction
The current economy’s fast-paced product development cycle has lead companies to decrease the time in all stages of new product development. Even before this change, companies spent proportionally little time in the idea generation process, compared to the time spent in technical development and testing. Little by little, companies are realizing the need for and the power of good ideas, thus requesting employees to dedicate more time and resources to the first stages of the new product development process, namely the identification of the opportunity or problem statement, information gathering, and the idea generation.
To create new ideas, the individual must form new combinations of knowledge he or she already possesses (Fleming & Szigety, 2006, Koestler, 1964). However, it has been found that that participants will gravitate towards known solutions (Howard, Culley & Dekoninck, 2006) and that popular ideas are constantly recombined (Fleming & Szigety, 2006). To produce a radical result, the ideator needs to make highly varying (“wild”) combinations (Fleming & Szigety, 2006). It is necessary to find ways to promote wild combinations.
In previous literature, authors have discussed options to manage ideas in a product development process, designing collaboration platforms and software to facilitate the documentation and exchange of ideas. But with new information technologies, it is possible to benefit from the wealth of data we are able to collect and process. Data can enable organizations to find insights related to their processes, clients and market.