Research-in-progress - altmetrics18
A climate of sharing:
Who are the users engaging with climate research on Twitter?
Rémi Toupin1,2,5 & Stefanie Haustein3,4,51 toupin.remi@uqam.ca
Laboratoire de communication médiatisée par ordinateur (LabCMO), Université du Québec à Montréal, Montréal (Canada)
2 Canada Research Chair on the Transformations of Scholarly Communication, Université de Montréal, Montréal
(Canada)
5ScholCommLab, University of Ottawa, Ottawa and Simon Fraser University, Vancouver (Canada) 3 stefanie.haustein@uottawa.ca
School for Information Studies, University of Ottawa, Ottawa (Canada)
4 Centre interuniversitaire de recherche sur la science et la technologie (CIRST),
Université du Québec à Montréal, Montréal (Canada)
5ScholCommLab, University of Ottawa, Ottawa and Simon Fraser University, Vancouver (Canada)
Introduction
As Twitter is used by a wide variety of users — many of whom outside the scientific community — it is presumed to broaden the spectrum of public engagement with research. Apart from serving as a platform for science communication, Twitter has been considered in the context of developing new metrics which aim to measure the societal impact of research, so called altmetrics. However, the conceptualization and application of altmetrics prove to be a challenge so far, mainly due to a lack of understanding of the heterogeneous acts and different levels of engagement as well as the diverse user base on social media (Haustein, Bowman, & Costas, 2016a).
The identification of users engaging with research on Twitter—particularly those that are considered non-academic—has been a key issue in defining scholarly Twitter metrics, as personal information is mostly limited to Twitter bios of 160 characters. Studies have applied codebooks to classify accounts maintained by institutions (e.g., universities, media, publishers, non-profits), individuals (e.g., researchers, students, professionals, science communicators) or automated profiles (i.e., bots) based on information provided in the Twitter bio (Haustein et al., 2016b; Holmberg et al., 2014; Tsou et al., 2015). However, it must be noted that the boundaries between categories are blurred as users may fall into more than one, making overlapping classification essential. The identification of non-academic (or lay) users has been particularly challenging, since their Twitter bios do not contain specific keywords identifying them as such, or they might not tweet links to scientific papers when communicating about science on Twitter (Bowman, 2015 ; Haustein & Costas, 2015).
This study focuses on climate change to identify who is engaging with research on Twitter. It aims to contribute to the discussion about who tweets about scientific research and the definition of user categories. More specifically, we aim to identify non-academic actors to understand the practices and context in which the public engages with scientific papers on social media. As climate change is a—or the—issue that involves a variety of stakeholders—researchers, governmental institutions, science communicators, NGOs— and is highly relevant to society as a whole, we assume a particularly high engagement by the public (IPCC, 2014). Climate change research therefore is a suitable topic to analyze non-academic users involved in the communication of research on Twitter.
Data and methods
Investigating how climate change research is communicated on Twitter, we built a dataset including 2015 and 2016 papers indexed in the Web of Science (WoS) that contained the keywords “climate change”, “global warming” or “IPCC” in the title or abstract. Though this basic query does not retrieve all publications related to climate change, it provides a significant corpus of papers that are directly related to climate research. Our aim was to increase precision by accepting lower recall. The publication years were chosen because they cover the period before and after the Paris Agreement1, a crucial moment for the
public understanding of climate change issues. A total of 19 546 publications were identified.
The title is the essential metadata to determine a paper’s relevance and since it also frequently appears in the tweet linking to it (Thelwall et al., 2013), it is highly visible to Twitter users. We therefore assume that articles, whose titles contain the above mentioned keywords, are both more relevant to climate change research and highly shared in tweets discussing climate change. The subset of articles containing “climate change”, “global warming” or “IPCC” in the title amounts to 4 719 documents.
Twitter activity and user metrics were compared for both the larger dataset - keywords in title or abstract - and the subset of articles containing them in titles only. Tweets were collected for each of the 19 546 articles by cross-referencing the information gathered from WoS with the Altmetric database via the digital object identifier (DOI). The Twitter dataset amounts to a total of 134 212 tweets and 71 166 retweets sent by and 54 229 unique users linking to 10 032 papers about climate research. Metadata about tweeted papers, tweets and user data including Twitter handle, user name, URL and Twitter bio, country information and number of followers were collected from Altmetric. Computed metrics include the number of papers tweeted, number of tweets, Twitter coverage, Twitter density (i.e., number of tweets per paper) and intensity (i.e., number of tweets per tweeted paper), number of users, user density (i.e., number of users per document) and intensity (i.e., number of users per tweeted document), number of papers retweeted, retweet coverage, share of retweets, retweet density (i.e., number of retweets per paper), retweet intensity (i.e number of retweets per tweeted document) as well as the timespan between first and last tweet, date of first and last tweet (Haustein, 2018).
Preliminary results
Slightly more than half of the 19 546 climate change articles were shared on Twitter (Table 1), which exceeds the Twitter coverage of all disciplines (36%; Haustein, 2018) as well as Biology (37%), Earth and Space Science (29%) and Social Sciences (39%), but is comparable for the percentage found in Health sciences (59%). Although Twitter coverage was only slightly higher for papers with climate change keywords in the title (Table 1), their Twitter and user density, and thus the average number of tweets and users, was higher than for all climate change publications. Twitter density and intensity were also considerably higher for climate change papers than all WoS articles published in 2015 (Haustein, 2018). This supports our hypothesis that climate change research is particularly relevant and receives larger attention on Twitter than other fields of research.
Table 1. Overview of metrics for papers, tweets and users for papers published in 2015 and 2016 for both datasets – Top : keywords in titles or abstracts ; Bottom : keywords only in titles.
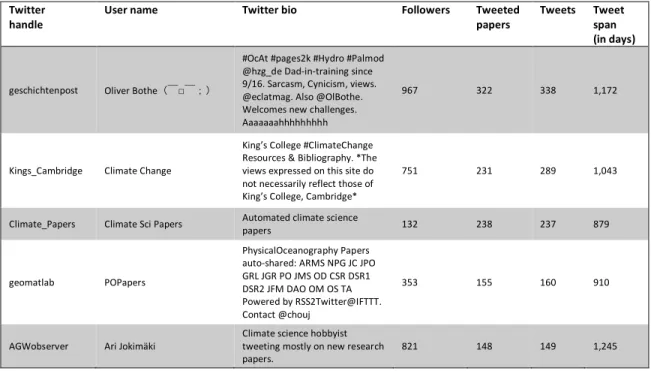
Table 2 lists user information for the five accounts sharing the largest number of climate change research articles on Twitter. These users have all been sharing at least 148 climate change articles in 149 tweets during a period of almost 2.5 years. The top 5 includes two users, who can be identified as individuals (@geschichtenpost, AGWobserver), two bots (@Climate_Papers, @geomatlab) and a university (@Kings_Cambridge). As captured by Altmetrics at the time of tweeting, users had between 132 and 967 followers. On average, each user seems to tweet each paper once, as indicated by a Twitter intensity close to 1.
All journals (titles and abstracts)
Papers Twitter
coverage Tweets Twitter density Twitter intensity Users User density User intensity
19 546 51.33% 134 212 6.87 13.38 54 923 2.81 5.47
Papers
tweeted Papers w RTs RT Coverage Number of RTs Share of RTs RT Density RT Intensity RT Users
10 032 5 851 58.32% 77 116 57.50% 3.95 7.69 39 882
All journals (titles) Papers Twitter
coverage Tweets Twitter density Twitter intensity Users User density User intensity
4 719 55.52% 41 019 8.69 15.66 21 963 4.65 8.38
Papers
tweeted Papers w RTs RT Coverage Number of RTs Share of RTs RT Density RT Intensity RT Users
Table 2. Examples of Twitter user data for the five users with the most tweets linking to a climate change paper.
handle User name Twitter bio Followers Tweeted papers Tweets Tweet span (in days)
geschichtenpost Oliver Bothe( ̄□ ̄;)
#OcAt #pages2k #Hydro #Palmod @hzg_de Dad-in-training since 9/16. Sarcasm, Cynicism, views. @eclatmag. Also @OlBothe. Welcomes new challenges. Aaaaaaahhhhhhhhh
967 322 338 1,172
Kings_Cambridge Climate Change
King’s College #ClimateChange Resources & Bibliography. *The views expressed on this site do not necessarily reflect those of King’s College, Cambridge*
751 231 289 1,043
Climate_Papers Climate Sci Papers Automated climate science papers 132 238 237 879
geomatlab POPapers
PhysicalOceanography Papers auto-shared: ARMS NPG JC JPO GRL JGR PO JMS OD CSR DSR1 DSR2 JFM DAO OM OS TA Powered by RSS2Twitter@IFTTT. Contact @chouj
353 155 160 910
AGWobserver Ari Jokimäki Climate science hobbyist tweeting mostly on new research
papers. 821 148 149 1,245
Outlook and future research
We propose to analyze the Twitter bios applying a codebook allowing for the identification of non-exclusive (i.e., overlapping) categories of users. Our challenge is to extract keywords (e.g., “Dad-in-training”, “hobbyist”) and create a codebook which helps to classify users outside the scientific community. Building on previous work by Haustein et al. (2016c) and Haustein (2018), the codebook will focus on the identification of accounts maintained by researchers, journals and publishers, universities, NGOs, bots and lay users by accounting for the fact that an account may fall into more than one of these categories.
We expect that this classification will help to distinguish academic tweets from those involving the general public. This will help to improve scholarly Twitter metrics by distinguishing between different types of users and levels of engagement.
References
Bowman, T. D. (2015). Investigating the use of affordances and framing techniques by scholars to manage
personal and professional impressions on Twitter (Dissertation). Indiana University, Bloomington, IN, USA.
Retrieved from http://www.tdbowman.com/pdf/2015_07_TDBowman_Dissertation.pdf
Haustein, S. (2018). Scholarly Twitter Metrics. In W. Glänzel, H.F. Moed, U. Schmoch, & M. Thelwall (Eds.),
Handbook of Quantitative Science and Technology Research, Springer. 40 pages. Retrieved from
https://arxiv.org/abs/1806.02201v2
Haustein, S., Bowman, T. D., & Costas, R. (2016a). Interpreting “altmetrics”: viewing acts on social media through the lens of citation and social theories. In C. R. Sugimoto (Ed.), Theories of Informetrics and Scholarly
Haustein, S., Bowman, T. D., Holmberg, K., Tsou, A., Sugimoto, C. R., & Larivière, V. (2016b). Tweets as impact indicators: Examining the implications of automated “bot” accounts on Twitter. Journal of the
Association for Information Science and Technology, 67(1), 232–238. https://doi.org/10.1002/asi.23456
Haustein, S., & Costas, R. (2015b). Identifying Twitter audiences: who is tweeting about scientific papers? Presented at the Metrics 2015 ASIS&T SIG/MET Workshop. Retrieved from
https://www.asist.org/SIG/SIGMET/wp-content/uploads/2015/10/sigmet2015_paper_11.pdf
Haustein, S., Tsou, A., Minik, V., Brinson, D., Hayes, E., Costas, R., & Sugimoto, C. R. (2016c). Identifying Twitter user communities in the context of altmetrics. Paper presented at the 3rd Altmetrics Conference
3:AM, 28-29 September 2015, Bucharest (Romania).
Holmberg, K., Bowman, T. D., Haustein, S., & Peters, I. (2014). Astrophysicists’ conversational connections on twitter. PloS One, 9(8), e106086–e106086. https://doi.org/10.1371/journal.pone.0106086
IPCC. (2014). Synthesis Report. Contribution of Working Groups I, II and III to the Fifth Assessment Report of the Intergovernmental Panel on Climate Change. Intergovernmental Panel on Climate Change. Geneva. 151
pages. Retrieved from https://www.ipcc.ch/report/ar5/syr/
Thelwall, M., Tsou, A., Weingart, S., Holmberg, K., & Haustein, S. (2013). Tweeting Links to Academic Articles. Cybermetrics: International Journal of Scientometrics, Informetrics and Bibliometrics, 17(1), 1–8 Tsou, A., Bowman, T. D., Ghazinejad, A., & Sugimoto, C. R. (2015). Who tweets about science? In
Proceedings of the 2015 International Society for Scientometrics and Informetrics (pp. 95–100). Istanbul,
Turkey. Retrieved from
https://pdfs.semanticscholar.org/81fe/8b63188cf25648a7c592bc6b5457fee3c101.pdf?_ga=1.184338726. 1264550827.1478885332