minerals
ArticleRare Earth Elements (La, Ce, Pr, Nd, and Sm) from a
Carbonatite Deposit: Mineralogical Characterization
and Geochemical Behavior
Mohamed Edahbi1ID, Benoît Plante1,*ID, Mostafa Benzaazoua1 ID, Lori Kormos2and Mia Pelletier3
1 Research Institute on Mines and Environment (RIME), Université du Québec en
Abitibi-Témiscamingue (UQAT), 445 boul. de l’Université, Rouyn-Noranda, QC J9X 5E4, Canada; mohamed.edahbi@uqat.ca (M.E.); mostafa.benzaazoua@uqat.ca (M.B.)
2 XPS Consulting & Testwork Services, 6 Edison Road, Falconbridge, ON P0M1S0, Canada; Lori.Kormos@xps.ca
3 Ressources Géoméga, Boucherville, QC J4B 6Y4, Canada; mpelletier@ressourcesgeomega.ca * Correspondence: benoit.plante@uqat.ca
Received: 5 December 2017; Accepted: 2 February 2018; Published: 8 February 2018
Abstract:Geochemical characterization including mineralogical measurements and kinetic testing was completed on samples from the Montviel carbonatite deposit, located in Quebec (Canada). Three main lithological units representing both waste and ore grades were sampled from drill core. A rare earth element (REE) concentrate was produced through a combination of gravity and magnetic separation. All samples were characterized using different mineralogical techniques (i.e., quantitative evaluation of minerals by scanning electron microscopy (QEMSCAN), X-ray diffraction (XRD), and scanning electron microscopy with X-ray microanalysis (SEM-EDS)) in order to quantify modal mineralogy, liberation, REE deportment and composition of REE-bearing phases. The REE concentrate was then submitted for kinetic testing (weathering cell) in order to investigate the REE leaching potential. The mineralogical results indicate that: (i) the main REE-bearing minerals in all samples are burbankite, kukharenkoite-Ce, monazite, and apatite; (ii) the samples are dominated by REE-free carbonates (i.e., calcite, ankerite, and siderite); and (iii) LREE is more abundant than HREE. Grades of REE minerals, sulfides and oxides are richer in the concentrate than in the host lithologies. The geochemical test results show that low concentrations of light REE are leached under kinetic testing conditions (8.8–139.6 µg/L total light REE). These results are explained by a low reactivity of the REE-bearing carbonates in the kinetic testing conditions, low amounts of REE in solids, and by precipitation of secondary REE minerals.
Keywords: carbonatite; rare earth elements; gravity concentration; QEMSCAN® mineralogy; geochemical behavior; kinetic tests
1. Introduction 1.1. REE Background
In recent decades, rare earth elements (REE), also called lanthanides (La to Lu, Sc, and Y), have been considered strategic metals, as they are a key component in the manufacturing of modern technologies. Their economic importance has grown as a result of their use in a wide range of industries including the manufacturing of products aimed at environmental conservation and sustainability. Applications include use in hybrid vehicles, radar systems, rechargeable batteries, mobile phones, flat screen display panels, compact fluorescent light bulbs, electronic products, etc.
Minerals 2018, 8, 55 2 of 19
These elements are often classified into two main categories: light (LREE, La to Gd) and heavy (HREE, Tb to Lu) rare earth elements. Currently, China produces 99% of HREE and 87% of LREE [1] and has a significant influence on REE prices. The global demand for REE can reach 160,000 tons in 2016 with the annual demand in China predicted to rise from 70,000 tons to 105,000 tonnes between 2011 and 2016 [2]. Because of their dominance in both production and research and development, China is well positioned in the industry compared to other countries. However, the global demand combined with REE importance to clean technology development has led countries, including USA, Japan, and the European Union to voice concerns regarding supply chain risk.
As a result, more REE exploration projects are being funded around the world, particularly in the Americas (e.g., Canada, Brazil, USA) [3]. Unfortunately, investment into REE exploration is still underfunded due to risks associated with relative scarcity and complexity of the deposits. Additional risk comes from price fluctuations created by changes in exports coming out of China. For example, in 2011 China reduced their REE exports which resulted in a significant increase of REE prices [4–7]. The REE exploration companies are present worldwide through close to 30 companies [4], several of which are in serious financial difficulty [5].
REE extraction from ores is challenging because of its complex mineralogy and complicated and costly processing. REE-bearing minerals have structural and chemical properties that do not facilitate their separation from gangue minerals (e.g., carbonates, phosphates, silicates, etc.). Each mineralogical suite requires a unique processing flowsheet thus a successful process for one deposit may not work for a different deposit. REE are typically processed using flotation, magnetic and electrostatic separation, gravity upgrading (Mozley Table, Falcon and Knelson concentrators, etc.) as well as hydrometallurgical treatment, followed by acid or alkaline leaching [8–10]. Most operations have complex flowsheets using combinations of the above techniques.
REE ores are often contaminated with actinides such as thorium, niobium and uranium, and other contaminants (e.g., Ba, Sr, Mn, Ta) [11,12]. Social responsibility of REE producers is an important issue for investors. Several publications found in the literature have reported significant environmental issues caused by REE mining and refining [13,14]. In China, the use of acids to recover REE leads to the deterioration in water quality in the surrounding environment. In Malaysia, radioactive wastes were stored in ambient surface conditions and consequently generated deleterious impacts on the environment [15].
The distribution and concentrations of REE vary depending on the geological context (e.g., alkaline and hyperalkaline magmatism, carbonatites, cationic clays, sedimentary rocks) [16,17]. Within magmatic deposits, REE are mainly concentrated by fractional crystallization [11,18–20].The main REE-bearing phases are silicates, carbonates, fluocarbonates, oxides, phosphates, and sulfates [16,21–24]. Because REE deposits are characteristically large-tonnage, low-grade operations, recycling of many electronic products could be presented an alternative REE source (e.g., phosphor lamps, batteries, permanent magnets) [25]. Worries over supply disruptions have fueled exploration for REE deposits in other parts of the world such as Australia (e.g., Mount Weld), USA (e.g., Mountain Pass), and Canada (e.g., Montviel, Kipawa). REE deposits can be found in different geological settings, especially associated with magmatism [19,26]. Carbonatites are known for their LREE potential due to the favorable geological context for LREE-bearing minerals crystallization and formation [12,27,28].
Carbonatites are igneous rocks containing more than 50% primary carbonates and classified according to their content of CaO, MgO, (FeO + Fe2O3+ MnO), and SiO2. The most common types of carbonatites are: calcio-carbonatite, magnesio-carbonatites, ferro-carbonatite, and silico-carbonatites [26]. Carbonatites are characterized by: (i) abundant carbonates minerals (i.e., calcite, ankerite, dolomite, and siderite); (ii) various accessory minerals as phosphates, fluocarbonates, iron oxides, and REE-bearing minerals (e.g., burbankite, xenotime, bastnasite, carbocernaite, kukharenkoite, monazite etc.) [11]. Carbonatite deposits are known to be associated with alkaline intrusions. They are more enriched in LREE compared to HREE. One way this enrichment can be explained is by fractional crystallization [29] and chemical substitution between REE and other cations of carbonate minerals. During magma
Minerals 2018, 8, 55 3 of 19
cooling, the LREE elements remain in the liquid phase while higher temperature minerals crystallize. REE crystallization with carbonate minerals occurs at the end of the fractionation process [19].
Several carbonatite deposits in Canada have emerged as a possible resource for REE, such as the Montviel deposit (100 km North of Lebel-sur-Quévillon, QC, Canada). The REE-bearing minerals within the Montviel deposit are contained mainly in ferro-carbonatites, breccia, and calcio/silico-carbonatites.
1.2. Geochemical Behavior of REE
Aqueous REE can be found in three forms: (i) associated with suspended particles; (ii) associated with colloidal microparticles; and (iii) free and/or dissolved ions. With the exception of Ce(IV) and Eu(II), REE are in trivalent state (Ln3+) [30,31]. They tend to be fractionated by the other metallic elements M3+. They can also be complexed with inorganic and/or organic ligands such as carbonates, halides, sulfates, phosphates, and organic matter.
REE mining operations, as in any mining operation, generate a lot of solid and liquid waste (i.e., waste rocks, tailings, and mining effluents). In addition, due to low-grades, only near surface, high-tonnage REE deposits can be economically exploited, usually by open pit mining. These wastes, with no commercial values, are often stored on surface. This disposal of REE mine wastes represent serious environmental concerns [13]. Indeed, several examples of environmental damage caused by REE extraction were reported in the literature such as in Malaysia, USA, and China [14]. REE mine wastes contain various contaminants such as metals, REE, and radioactive elements (e.g., thorium) [6,24]. For example, the Mountain Pass mine produced approximately 3000 L/min of wastewater containing thorium and uranium, while Bayan Obo mine after 40 years has produced an 11 km2of tailings [32,33].
There are significant knowledge gaps about REE-bearing mine wastes, particularly in terms of their reactivity, speciation, mobility, and toxicity [34]. Partial or total dissolution of the REE-bearing minerals may release REE into surface and underground aquifers [35].
Water-rock interactions with mine waste influences the water quality associated with mine drainage. The release of REE and other associated elements is controlled by the mineralogical composition of the rocks and by pH, temperature, degree of saturation, secondary precipitation, and the presence of impurities within the reactive minerals.
In order to anticipate potential environmental impacts of REE mining, the prediction of REE leaching from mine wastes is required, even if these elements occur at low grades. Investigation of the geochemical behavior of REE mine waste requires extensive mineralogical characterization and kinetic testing on different lithologies of a given deposit. In order to better characterize REE-bearing minerals and to enhance the geochemical responses, a REE concentrate sample was prepared using gravity and magnetic separation [9,36]. The basic premise is that the weathering pattern observed for the concentrate is an amplified version of the original waste’s behavior. This work aims to understand the geochemical behavior of the Montviel (carbonatite orebody) mine wastes including waste rocks and REE concentrate in order to predict the quality of the drainage water.
2. Materials and Methods
The first part of this section presents a summary description of the Montviel mine site and the different procedures used to prepare and characterize the studied materials. The second part describes the main physical, chemical and mineralogical characteristics of samples (waste rocks and concentrate). Finally, the main geochemical results obtained from kinetic testing on the concentrate are presented.
2.1. Location and Geological Setting of Montviel Deposit
The Montviel site is a future open-pit mine of rare earth elements. The Montviel deposit is located in the heart of the Canadian Shield, approximately 97 km north of Lebel-sur-Quévillon, Quebec, Canada. The REE mineralization within the deposit is hosted mainly in carbonatites, within the
Minerals 2018, 8, 55 4 of 19
Montviel alkaline proterozoic intrusion. The mining company GéoMéga Resources estimates the indicated resources to be approximately 183.9 Mt at 1.45% total rare earth oxides (TREO) and an additional 66.7 Mt at 1.46% TREO in the inferred resources category.
The mineralized zone is mainly composed of five lithologies: silicocarbonatites, calciocarbonatites, magnesiocarbonatites, ferrocarbonatites and polygenic breccia. The mineralogical composition of these lithologies is mainly represented by carbonates (i.e., calcite, ankerite, siderite, barytocalcite, and strontianite), REE carbonates and REE-Ba-Sr mixtures [12,37].
2.2. Sampling and Preparation
The materials used in this work were supplied by Geomega Resources Inc. Approximately 5 kg of each lithology were sampled from exploration drill core: low-grade and high-grade ferro-carbonatites (FeC-LG and FeC-HG, respectively), and calcio-carbonatite (CaC). Cores were crushed, then pulverized to mimic particle size distribution typical to the one targeted by ore processing.
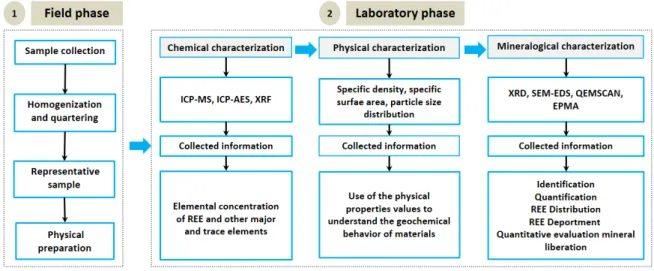
In order to satisfy the characterization requirements (i.e., detection limit) and to more easily investigate the REE mineralogy and geochemical behavior during kinetic tests, REE were concentrated to increase the geochemical responses (Figure1).
Minerals 2018, 8, x FOR PEER REVIEW 4 of 19
the Montviel alkaline proterozoic intrusion. The mining company GéoMéga Resources estimates the indicated resources to be approximately 183.9 Mt at 1.45% total rare earth oxides (TREO) and an additional 66.7 Mt at 1.46% TREO in the inferred resources category.
The mineralized zone is mainly composed of five lithologies: silicocarbonatites, calciocarbonatites, magnesiocarbonatites, ferrocarbonatites and polygenic breccia. The mineralogical composition of these lithologies is mainly represented by carbonates (i.e., calcite, ankerite, siderite, barytocalcite, and strontianite), REE carbonates and REE-Ba-Sr mixtures [12,37].
2.2. Sampling and Preparation
The materials used in this work were supplied by Geomega Resources Inc. Approximately 5 kg of each lithology were sampled from exploration drill core: low-grade and high-grade ferro-carbonatites (FeC-LG and FeC-HG, respectively), and calcio-carbonatite (CaC). Cores were crushed, then pulverized to mimic particle size distribution typical to the one targeted by ore processing.
In order to satisfy the characterization requirements (i.e., detection limit) and to more easily investigate the REE mineralogy and geochemical behavior during kinetic tests, REE were concentrated to increase the geochemical responses (Figure 1).
Figure 1. REE-bearing minerals characterization methodology.
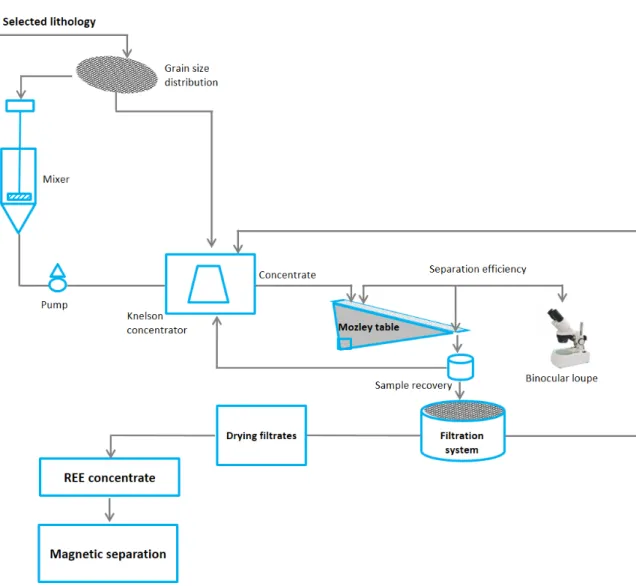
Due to their high density and magnetic properties, REE-bearing minerals were enriched using gravity and magnetic separation. Ferro-carbonatite high grade (FeC-HG) was used as feed for the enrichment process. The material was dried and sieved into four different fractions (−106 µm, −315/+106 µm, −630/+315 µm, and −2 mm/+630 µm) to determine the REE distribution. The fractions were selected on the basis of the grain size distribution curve of the whole material to provide equivalent weight fractions. The heavier minerals appeared to be concentrated within the finest fraction, i.e., below 106 µm with 46,275 ppm LREE (La, 16,767 ppm; Ce, 27,504 ppm; Pr, 2009 ppm). Slurry composed of water and solids (around 40% solids) corresponding to each size fraction was prepared in the mixing tank before feeding the concentration process steps. Several stages of concentration using a Knelson concentrator and Mozley table were necessary to improve the grade of the concentrate (Figure 2). The final concentrate was created by mixing concentrates with the same initial proportions (raw sample FeC-HG). The separation efficiency was first verified through binocular loupe and then submitted to physical, chemical, and mineralogical characterization.
Figure 1.REE-bearing minerals characterization methodology.
Due to their high density and magnetic properties, REE-bearing minerals were enriched using gravity and magnetic separation. Ferro-carbonatite high grade (FeC-HG) was used as feed for the enrichment process. The material was dried and sieved into four different fractions (−106 µm, −315/+106 µm, −630/+315 µm, and −2 mm/+630 µm) to determine the REE distribution. The fractions were selected on the basis of the grain size distribution curve of the whole material to provide equivalent weight fractions. The heavier minerals appeared to be concentrated within the finest fraction, i.e., below 106 µm with 46,275 ppm LREE (La, 16,767 ppm; Ce, 27,504 ppm; Pr, 2009 ppm). Slurry composed of water and solids (around 40% solids) corresponding to each size fraction was prepared in the mixing tank before feeding the concentration process steps. Several stages of concentration using a Knelson concentrator and Mozley table were necessary to improve the grade of the concentrate (Figure2). The final concentrate was created by mixing concentrates with the same initial proportions (raw sample FeC-HG). The separation efficiency was first verified through binocular loupe and then submitted to physical, chemical, and mineralogical characterization.
Minerals 2018, 8, 55 5 of 19
Minerals 2018, 8, x FOR PEER REVIEW 5 of 19
Figure 2. Experimental set-up for the Mozley table and Knelson concentrator tests.
2.3. Physical and Chemical Analysis
The specific gravity (SG) was determined with a AccuPyc 1330 Helium Pycnometer (Micromeritics, Norcross, GA, USA). The particle size distributions were analyzed using a Mastersizer S laser analyzer (Malvern Instruments, Malvern, UK). The specific surface area (SSA) was determined by using a Gemini Surface Area Analyser (Micromeritics, Norcross, GA, USA) using the BET method [38].
The whole-rock analyses were performed using an X-ray Fluorescence (Bruker, Tiger Model, Billerica, MA, USA), analyzer on a powdered aliquot of each sample to determine the major and minor elements. Chemical analyses were carried out by Inductively Coupled Plasma (ICP-AES/MS, Perkin Elmer Optima 3100-RL, Waltham, MA, USA). Over 20 elements, to a 0.001 wt % precision were analyzed after a multi-acid digestion (HCl, HNO3, and HF). The total sulfur and carbon grades were
measured using an induction furnace analyzer (ELTRA CS-2000, Mettmann, Germany) with the detection limits are 0.05% of carbon and 0.009% of sulfur, respectively
The physicochemical parameters of the weathering cell leachates (pH, conductivity, Eh) were determined using a pH/Eh/electrical conductivity meter. The ICP-MS was used to analyze the REE concentrations in the weathering cell leachates, while the other elements were measured using the ICP-AES on an acidified (2% HNO3) and filtered (<0.45 µm) aliquot. The acid-base accounting (AP:
acid-generating potential; NP: neutralization potential; NNP = NP − AP: net neutralization potential) was determined using the percentage of sulfur (AP = 31.25 × %S) and carbon (NP = 83.3 × %C).
Figure 2.Experimental set-up for the Mozley table and Knelson concentrator tests. 2.3. Physical and Chemical Analysis
The specific gravity (SG) was determined with a AccuPyc 1330 Helium Pycnometer (Micromeritics, Norcross, GA, USA). The particle size distributions were analyzed using a Mastersizer S laser analyzer (Malvern Instruments, Malvern, UK). The specific surface area (SSA) was determined by using a Gemini Surface Area Analyser (Micromeritics, Norcross, GA, USA) using the BET method [38].
The whole-rock analyses were performed using an X-ray Fluorescence (Bruker, Tiger Model, Billerica, MA, USA), analyzer on a powdered aliquot of each sample to determine the major and minor elements. Chemical analyses were carried out by Inductively Coupled Plasma (ICP-AES/MS, Perkin Elmer Optima 3100-RL, Waltham, MA, USA). Over 20 elements, to a 0.001 wt % precision were analyzed after a multi-acid digestion (HCl, HNO3, and HF). The total sulfur and carbon grades were measured using an induction furnace analyzer (ELTRA CS-2000, Mettmann, Germany) with the detection limits are 0.05% of carbon and 0.009% of sulfur, respectively
The physicochemical parameters of the weathering cell leachates (pH, conductivity, Eh) were determined using a pH/Eh/electrical conductivity meter. The ICP-MS was used to analyze the REE concentrations in the weathering cell leachates, while the other elements were measured using the ICP-AES on an acidified (2% HNO3) and filtered (<0.45 µm) aliquot. The acid-base accounting (AP: acid-generating potential; NP: neutralization potential; NNP = NP−AP: net neutralization potential) was determined using the percentage of sulfur (AP = 31.25×%S) and carbon (NP = 83.3×%C).
Minerals 2018, 8, 55 6 of 19
2.4. Mineralogical Characterization
The mineralogical composition was identified by X-ray diffraction (XRD; Bruker D8 Advance, with a detection limit and precision of approximately 1 to 5%, operating with a copper cathode, Kα radiation) (Bruker, Billerica, MA, USA) using the DIFFRACT.EVA program, and quantified with Rietveld refinement using the Bruker’s TOPAS 4.2 software [39]. In order to reconcile the final mineralogical results, chemical and mineralogical results are collected, compared, and adjusted to determine the percentages of mineral phases present within samples.
Mineralogical investigation and local X-ray microanalysis were completed on a Hitachi S-3500N scanning electron microscope (SEM, Hitachi High-Technologies Canada, Toronto, ON, Canada), equipped with an Energy-Dispersive X-ray Spectroscopy (EDS) probe (Oxford Instruments, Abingdon, UK, Oxfordshire 20 mm2X-Max Silicon Drift Detector (SDD)). All analyses where carried out using an accelerating voltage of 20 kV, current of 150 µA, pressure in the chamber fixed at 25 Pa and a working distance of 15 mm. The polished section observations were determined using Backscattered electrons imaging mode (BSE). Electron probe microanalysis (EPMA), which has lower detection limits than the EDS-SEM system, were also used to analyze the trace metal composition of certain accessory minerals known for their affinity to REE, such as apatite. Electron microprobe mineralogical analyses (Cameca SX 100) were performed using an accelerating voltage of 20 kV and a beam current of 20 nA.
In order to further understand the effect of mineralogy, mineral size distributions, and effect of liberation on the geochemical behavior of REE-bearing minerals, a QEMSCAN (Quantitative Evaluation of Materials by Scanning Electron Microscopy) analysis was performed [24,40]. QEMSCAN is an automated system that produces particle maps (color coded by mineral) through the collection of rapidly acquired X-rays. The distribution and corresponding data files quantify the modal mineralogy, texture (mineral association), grain size, elemental deportment and liberation of samples analyzed. The polished sections were analyzed by PMA (particle mineralogy analysis) and TMS (trace mineral search) modes. Measurement resolution was set to 0.8 m or 1 µm to capture the fine particle sizes [8,40]. The mineralogical observations were performed on polished sections prepared carefully to avoid density segregation and ensure a homogenous dispersion of particles. The mineralogical observations were mainly focused on REE carbonates.
2.5. Weathering Cells
A weathering cell test was used to evaluate the geochemistry of the REE concentrate following the procedures of Bouzahzah [41]. The weathering cells consist of bi-weekly flushes by 50 mL of deionized water on a sample weighing 67 g. The sample (particle size distribution <400 µm) is left to dry under ambient air between flushes. The bi-weekly (Mondays and Thursdays) leachates are combined and analyzed for their pH, Eh, electrical conductivity, and dissolved constituents.
3. Results
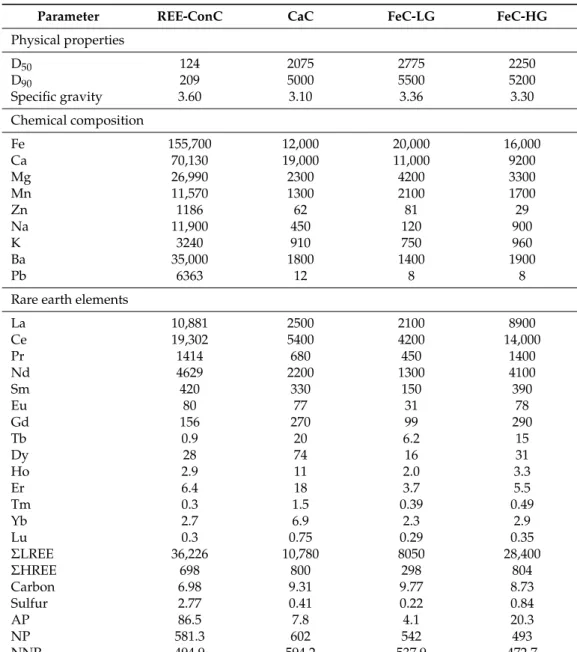
3.1. Physical and Chemical Characteristics of the Three Montviel Lithologies and the REE Concentrate The physical and chemical properties of the studied samples are summarized in Table1. The SG of the samples ranges from 3 to 3.60. The specific gravity of the REE concentrate (3.60) is greater than that of all the lithological units (3.00–3.36) due to the increased content of sulfide and REE-bearing minerals. Fine grinding of the FeC-HG was required to ensure a high recovery of REE-bearing minerals to the REE concentrate.
Minerals 2018, 8, 55 7 of 19
Table 1.Chemical and ABA characterization of the samples studied (elements in mg/kg; carbon and sulfur in %; AP, NP and NNP in kg CaCO3/t).
Parameter REE-ConC CaC FeC-LG FeC-HG
Physical properties D50 124 2075 2775 2250 D90 209 5000 5500 5200 Specific gravity 3.60 3.10 3.36 3.30 Chemical composition Fe 155,700 12,000 20,000 16,000 Ca 70,130 19,000 11,000 9200 Mg 26,990 2300 4200 3300 Mn 11,570 1300 2100 1700 Zn 1186 62 81 29 Na 11,900 450 120 900 K 3240 910 750 960 Ba 35,000 1800 1400 1900 Pb 6363 12 8 8
Rare earth elements
La 10,881 2500 2100 8900 Ce 19,302 5400 4200 14,000 Pr 1414 680 450 1400 Nd 4629 2200 1300 4100 Sm 420 330 150 390 Eu 80 77 31 78 Gd 156 270 99 290 Tb 0.9 20 6.2 15 Dy 28 74 16 31 Ho 2.9 11 2.0 3.3 Er 6.4 18 3.7 5.5 Tm 0.3 1.5 0.39 0.49 Yb 2.7 6.9 2.3 2.9 Lu 0.3 0.75 0.29 0.35 ΣLREE 36,226 10,780 8050 28,400 ΣHREE 698 800 298 804 Carbon 6.98 9.31 9.77 8.73 Sulfur 2.77 0.41 0.22 0.84 AP 86.5 7.8 4.1 20.3 NP 581.3 602 542 493 NNP 494.9 594.2 537.9 472.7
The D50 and D90 values (the particle size passing 50% and 90% on the cumulative grain size distribution curve, respectively) also highlight the particle size differences between the waste rocks samples and REE concentrate sample. The D50and D90values of the REE concentrate are significantly lower (124–209 µm) than for the waste rock samples (D50: 2075–2775 µm and D90: 5000–5500 µm).
The chemical characterization results show that the REE concentrate sample contains higher concentrations of REE, Fe, Ca, Mg, Mn, Zn, Na, K, Ba, and Pb compared to the other samples. Indeed, the highest sum of LREE is recorded in the REE concentrate (36,226 mg/kg), while the lowest sum is found in the BreC (LG) (4400 mg/kg). The samples are rich in LREE compared to HREE. Lanthanum (La), cerium (Ce), and neodymium (Nd) are the most abundant elements in all samples, with a maximum content in the REE concentrate and a minimum content in the breccia sample.
The acid-base accounting results show that the AP values are all lower (4.1 < AP < 86.5 kg CaCO3/t) than the NP values (44 < NP < 602 kg CaCO3/t), leading to NNP values undoubtedly within the non-acid generating zone (>20 kg CaCO3/t).
Minerals 2018, 8, 55 8 of 19
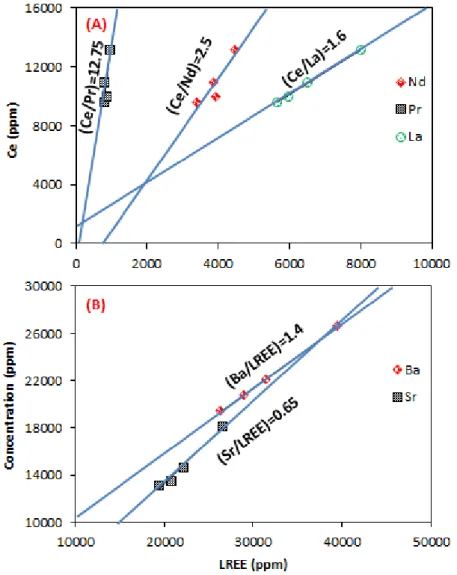
The relationship between LREE, Ba, and Sr shows a strong correlation with LREE (R2> 0.90), LREE vs. Ba (R2= 0.99) and LREE vs. Sr (R2= 0.98) (Figure3). This is confirmed by the experimental constant relative proportions of (Ce/Nd) = 2.5, (Ce/Pr) = 12.75, and (Ce/La) = 1.6 in all samples. These relationships between LREE, Sr, and Ba, verified for all samples, suggest that these elements are associated in the same mineral phases. These geochemical anomalies are confirmed in the QEMSCAN analyses section.
Minerals 2018, 8, x FOR PEER REVIEW 8 of 19
The relationship between LREE, Ba, and Sr shows a strong correlation with LREE (R2 > 0.90),
LREE vs. Ba (R2 = 0.99) and LREE vs. Sr (R2 = 0.98) (Figure 3). This is confirmed by the experimental
constant relative proportions of (Ce/Nd) = 2.5, (Ce/Pr) = 12.75, and (Ce/La) = 1.6 in all samples. These relationships between LREE, Sr, and Ba, verified for all samples, suggest that these elements are associated in the same mineral phases. These geochemical anomalies are confirmed in the QEMSCAN analyses section.
Figure 3. Correlation between LREE (Ce vs. La, R2 = 0.99; Ce vs. Nd, R2 = 0.93; Ce vs. Pr, R2 = 0.91), LREE vs. Ba (R2 = 0.99) and LREE vs. Sr (R2 = 0.98).
3.2. Mineralogical Characterization
The mineralogy of REE concentrate, determined by XRD analysis, is dominated by carbonates (i.e., ankerite, 34–43 wt %; siderite, 12–16 wt. %; calcite, 8–11 wt %), bassanite (3–5 wt %), ilmenite (1 wt %), biotite (7–16 wt %), sulfides, and hematite (0–10 wt %). Two types of REE-bearing minerals are detected: burbankite, kukharenkoite, synchysite (carbonates) and monazite as main phosphate. However, the concentration of the possible Nb/Th-bearing minerals is too low to be detected by XRD. The mineralogical composition of the REE concentrate is shown in Table 2.
Figure 3.Correlation between LREE (Ce vs. La, R2= 0.99; Ce vs. Nd, R2= 0.93; Ce vs. Pr, R2= 0.91) (A), LREE vs. Ba (R2= 0.99) and LREE vs. Sr (R2= 0.98) (B).
3.2. Mineralogical Characterization
The mineralogy of REE concentrate, determined by XRD analysis, is dominated by carbonates (i.e., ankerite, 34–43 wt %; siderite, 12–16 wt %; calcite, 8–11 wt %), bassanite (3–5 wt %), ilmenite (1 wt %), biotite (7–16 wt %), sulfides, and hematite (0–10 wt %). Two types of REE-bearing minerals are detected: burbankite, kukharenkoite, synchysite (carbonates) and monazite as main phosphate. However, the concentration of the possible Nb/Th-bearing minerals is too low to be detected by XRD. The mineralogical composition of the REE concentrate is shown in Table2.
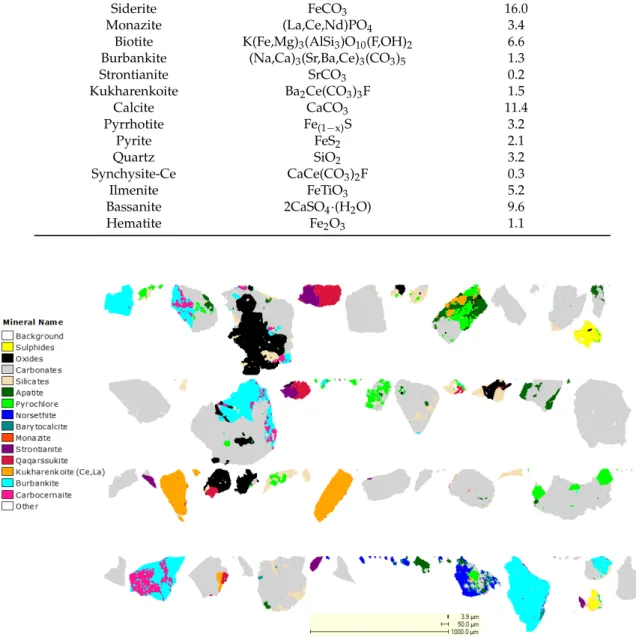
These XRD results are confirmed by the other mineralogical techniques. SEM-EDS and QEMSCAN investigation show that: (i) REE are partially or totally liberated as free particles (kukharenkoite, burbankite, qaqarssukite, monazite) and/or associated with pyrochlore, baytocalcite, apatite, and Mg-Fe carbonates (Figure4); (ii) all analyzed REE-bearing minerals contain LREE (La, Ce, Pr, Nd, Sm);
Minerals 2018, 8, 55 9 of 19
(iii) two groups of REE-bearing minerals (carbonates and phosphates) were detected with variable REE grades; and (iv) pyrite and pyrrhotite were the most abundant sulfide minerals identified in the sample.
In order to better investigate the REE mineralogy, all samples were submitted to mineralogical assessment using QEMSCAN. The main objective of the QEMSCAN work was to define the modal abundances, grain size, REE deportments and mineral liberation. The results of modal mineralogy show that REE minerals include kukharenkoite Ba2(La,Ce)(CO3)3F, burbankite (Na,Ca)3(Sr,Ba,Ce)3(CO3)4, ancylite Sr(La,Ce)(CO3)2(OH)·(H2O), carbocernaite (Ca,Na)(Sr,Ce,Ba)(CO3)2, qaqarssukite Ba(Ce,REE)(CO3)2F, and apatite Ca5(PO4)3F (Figure5). The QEMSCAN mineralogical data shows that carbonernaite, ancylite, barytocalcite, and apatite minerals were undetectable by XRD.
Table 2.XRD mineralogical composition of REE concentrates.
Mineral Chemical Formula Phase (wt %)
Ankerite Ca(Fe,Mg,Mn)(CO3)2 34.5
Siderite FeCO3 16.0
Monazite (La,Ce,Nd)PO4 3.4
Biotite K(Fe,Mg)3(AlSi3)O10(F,OH)2 6.6
Burbankite (Na,Ca)3(Sr,Ba,Ce)3(CO3)5 1.3
Strontianite SrCO3 0.2 Kukharenkoite Ba2Ce(CO3)3F 1.5 Calcite CaCO3 11.4 Pyrrhotite Fe(1−x)S 3.2 Pyrite FeS2 2.1 Quartz SiO2 3.2 Synchysite-Ce CaCe(CO3)2F 0.3 Ilmenite FeTiO3 5.2 Bassanite 2CaSO4·(H2O) 9.6 Hematite Fe2O3 1.1
Minerals 2018, 8, x FOR PEER REVIEW 9 of 19
Table 2. XRD mineralogical composition of REE concentrates.
Mineral Chemical Formula Phase (wt %)
Ankerite Ca(Fe,Mg,Mn)(CO3)2 34.5
Siderite FeCO3 16.0
Monazite (La,Ce,Nd)PO4 3.4
Biotite K(Fe,Mg)3(AlSi3)O10(F,OH)2 6.6
Burbankite (Na,Ca)3(Sr,Ba,Ce)3(CO3)5 1.3
Strontianite SrCO3 0.2 Kukharenkoite Ba2Ce(CO3)3F 1.5 Calcite CaCO3 11.4 Pyrrhotite Fe(1−x)S 3.2 Pyrite FeS2 2.1 Quartz SiO2 3.2 Synchysite-Ce CaCe(CO3)2F 0.3 Ilmenite FeTiO3 5.2 Bassanite 2CaSO4·(H2O) 9.6 Hematite Fe2O3 1.1
These XRD results are confirmed by the other mineralogical techniques. SEM-EDS and QEMSCAN investigation show that: (i) REE are partially or totally liberated as free particles (kukharenkoite, burbankite, qaqarssukite, monazite) and/or associated with pyrochlore, baytocalcite, apatite, and Mg-Fe carbonates (Figure 4); (ii) all analyzed REE-bearing minerals contain LREE (La, Ce, Pr, Nd, Sm); (iii) two groups of REE-bearing minerals (carbonates and phosphates) were detected with variable REE grades; and (iv) pyrite and pyrrhotite were the most abundant sulfide minerals identified in the sample.
Figure 4. QEMSCAN schematics of mineralogical associations in the REE concentrate.
In order to better investigate the REE mineralogy, all samples were submitted to mineralogical assessment using QEMSCAN. The main objective of the QEMSCAN work was to define the modal abundances, grain size, REE deportments and mineral liberation. The results of modal mineralogy show that REE minerals include kukharenkoite Ba2(La,Ce)(CO3)3F, burbankite (Na,Ca)3(Sr,Ba,Ce)3(CO3)4,
ancylite Sr(La,Ce)(CO3)2(OH)·(H2O), carbocernaite (Ca,Na)(Sr,Ce,Ba)(CO3)2, qaqarssukite
Minerals 2018, 8, 55 10 of 19
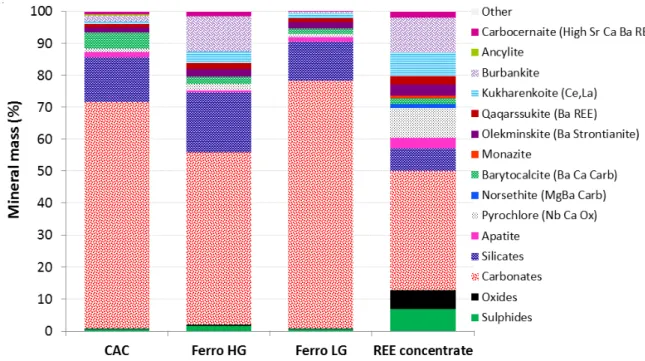
Gangue minerals are dominated by carbonates that include calcite (most common in CAC), as well as ankerite, siderite, Mn siderite, and a Ca Mg Fe carbonates. Composites with higher levels of Fe have more ankerite, siderite, Ca Mg Fe carbonate compared to CAC. Silicates are dominated by biotite, chlorite with trace levels of amphiboles, pyroxene, feldspar, quartz, titanite and zircon. The QEMSCAN findings show that sulfides (mainly pyrite) and Fe-oxides are more abundant in the REE concentrate in comparison with the studied lithologies (Figure5).
Minerals 2018, 8, x FOR PEER REVIEW 10 of 19
Ba(Ce,REE)(CO3)2F, and apatite Ca5(PO4)3F (Figure 5). The QEMSCAN mineralogical data shows that
carbonernaite, ancylite, barytocalcite, and apatite minerals were undetectable by XRD.
Gangue minerals are dominated by carbonates that include calcite (most common in CAC), as well as ankerite, siderite, Mn siderite, and a Ca Mg Fe carbonates. Composites with higher levels of Fe have more ankerite, siderite, Ca Mg Fe carbonate compared to CAC. Silicates are dominated by biotite, chlorite with trace levels of amphiboles, pyroxene, feldspar, quartz, titanite and zircon. The QEMSCAN findings show that sulfides (mainly pyrite) and Fe-oxides are more abundant in the REE concentrate in comparison with the studied lithologies (Figure 5).
Figure 5. QEMSCAN assessment of Montviel lithologies and REE concentrate.
The difference between XRD and QEMSCAN analyses is perhaps due to two reasons: (i) XRD is a semi-quantitative method that has a detection limit in the 1–5% range, and/or (ii) a representativeness problem of the tested sample. Given the sample preparation procedure, the latter is unlikely.
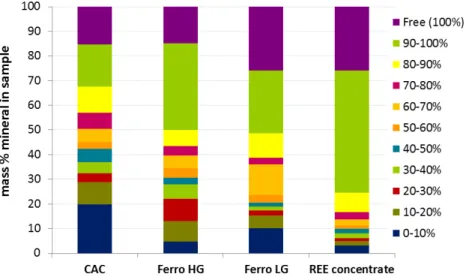
The QEMSCAN results shown in Figure 5 demonstrate that the concentration process successfully increased the grades of all bearing phases, and decreased those of the non REE-bearing gangue minerals (carbonates and silicates). The degree of liberation of REE-REE-bearing minerals is very important because it allows evaluation of mineral absolute reactivity. Liberation (based on area %) data is shown for combined REE minerals. At least, 50% of the REE-bearing minerals are liberated (more than 15% as free particles) within the samples, while the remaining particles are either included or locked within gangue minerals (e.g., silicates and carbonates) (Figure 6).
REE deportments for Ce, La, Nd, Pr and Sm have been calculated using the EPMA and QEMSCAN data. It is important to note that no deportment data is available for the REE that were not included in the EPMA analysis. Ce, La, Nd, Pr and Sm deportments are summarized in Figure 7. Ancylite, burbankite, carbonernaite, kukharenkoite, qaqarssukite, monazite, strontianite and apatite mainly contain Ce and Nd, whereas Sm and La deport mainly to monazite, ancylite, burbankite, carbonernaite, kukharenkoite, qaqarssukite. The gangue minerals are mainly represented by carbonates and silicates.
Figure 5.QEMSCAN assessment of Montviel lithologies and REE concentrate.
The difference between XRD and QEMSCAN analyses is perhaps due to two reasons: (i) XRD is a semi-quantitative method that has a detection limit in the 1–5% range, and/or (ii) a representativeness problem of the tested sample. Given the sample preparation procedure, the latter is unlikely.
The QEMSCAN results shown in Figure5demonstrate that the concentration process successfully increased the grades of all REE-bearing phases, and decreased those of the non REE-bearing gangue minerals (carbonates and silicates). The degree of liberation of REE-bearing minerals is very important because it allows evaluation of mineral absolute reactivity. Liberation (based on area %) data is shown for combined REE minerals. At least, 50% of the REE-bearing minerals are liberated (more than 15% as free particles) within the samples, while the remaining particles are either included or locked within gangue minerals (e.g., silicates and carbonates) (Figure6).
REE deportments for Ce, La, Nd, Pr and Sm have been calculated using the EPMA and QEMSCAN data. It is important to note that no deportment data is available for the REE that were not included in the EPMA analysis. Ce, La, Nd, Pr and Sm deportments are summarized in Figure7. Ancylite, burbankite, carbonernaite, kukharenkoite, qaqarssukite, monazite, strontianite and apatite mainly contain Ce and Nd, whereas Sm and La deport mainly to monazite, ancylite, burbankite, carbonernaite, kukharenkoite, qaqarssukite. The gangue minerals are mainly represented by carbonates and silicates. As shown in Table2, carbonate minerals are the most abundant mineral group in the REE concentrate. As a result, the materials were proven as being non-acid generating based on quantitative evaluation of mineralogy using QEMSCAN results and the calculation of degree of liberation.
Minerals 2018, 8, 55 11 of 19
Minerals 2018, 8, x FOR PEER REVIEW 11 of 19
Figure 6. The degree of liberation of REE-bearing minerals in Montviel lithologies and REE concentrate.
Figure 7. Ce (A), La (B), Pr (C), Nd (D), and Sm (E) deportment in REE-bearing minerals. Figure 6.The degree of liberation of REE-bearing minerals in Montviel lithologies and REE concentrate.
Minerals 2018, 8, x FOR PEER REVIEW 11 of 19
Figure 6. The degree of liberation of REE-bearing minerals in Montviel lithologies and REE concentrate.
Figure 7. Ce (A), La (B), Pr (C), Nd (D), and Sm (E) deportment in REE-bearing minerals. Figure 7.Ce (A), La (B), Pr (C), Nd (D), and Sm (E) deportment in REE-bearing minerals.
Minerals 2018, 8, 55 12 of 19
3.3. Geochemical Behavior
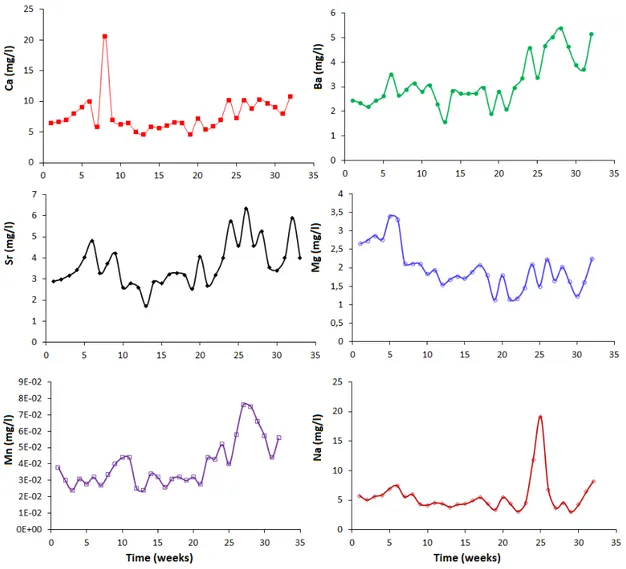
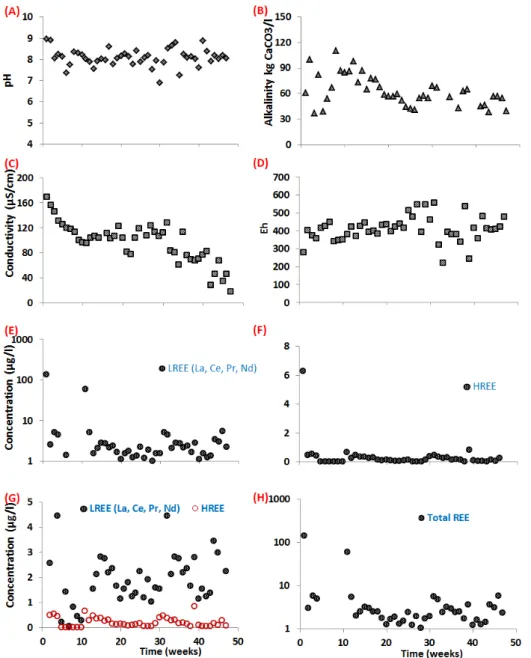
The weathering cell test results are shown in Figures8and9. The pH of all the cell leachates remains alkaline (7.27–8.95) during the test. The electric conductivities of the leachates stabilize rapidly between 117 and 169 µS/cm. The redox potential (Eh) varied from 228 to 553 mV. The alkalinity values stabilize between 37 and 110 mg CaCO3/L, while the acidity is always below 5 mg CaCO3/L. All these parameters stabilize after the approximately the first 60 days. The leaching concentrations of Th, Nb, Ni, Pb and Cu are not presented due to their low concentrations in the leachates from the REE concentrate. It is worth mentioning that these elemental concentrations were below the values fixed by Directive 019 (provincial legislations in Quebec). Leachate Ca concentrations vary between 0.003 and 20.6 mg/L after approximately 287 days. The Ba concentrations increase from the beginning of the test until approximately 231 days, after which they decrease until the end of the test and remain below the analytical detection limit (0.001 mg/L). The Sr (1.71–8.24 mg/L) and Mn (0.009–0.076 mg/L) concentrations generated from the concentrate sample show similar trends. The REE concentrate cell also generates detectable Mg and Si concentrations in the leachates (Mg: 0.05–3.4 mg/L and Na: 0.004–19.1 mg/L). The As, Cd, Bi, Co, Cr, Fe, Th, Ti and Zn values are typically under their respective detection limits and are therefore not shown.
Minerals 2018, 8, x FOR PEER REVIEW 12 of 19
As shown in Table 2, carbonate minerals are the most abundant mineral group in the REE concentrate. As a result, the materials were proven as being non-acid generating based on quantitative evaluation of mineralogy using QEMSCAN results and the calculation of degree of liberation.
3.3. Geochemical Behavior
The weathering cell test results are shown in Figures 8 and 9. The pH of all the cell leachates remains alkaline (7.27–8.95) during the test. The electric conductivities of the leachates stabilize rapidly between 117 and 169 µS/cm. The redox potential (Eh) varied from 228 to 553 mV. The alkalinity values stabilize between 37 and 110 mg CaCO3/L, while the acidity is always below
5 mg CaCO3/L. All these parameters stabilize after the approximately the first 60 days. The leaching
concentrations of Th, Nb, Ni, Pb and Cu are not presented due to their low concentrations in the leachates from the REE concentrate. It is worth mentioning that these elemental concentrations were below the values fixed by Directive 019 (provincial legislations in Quebec). Leachate Ca concentrations vary between 0.003 and 20.6 mg/L after approximately 287 days. The Ba concentrations increase from the beginning of the test until approximately 231 days, after which they decrease until the end of the test and remain below the analytical detection limit (0.001 mg/L). The Sr (1.71–8.24 mg/L) and Mn (0.009–0.076 mg/L) concentrations generated from the concentrate sample show similar trends. The REE concentrate cell also generates detectable Mg and Si concentrations in the leachates (Mg: 0.05–3.4 mg/L and Na: 0.004–19.1 mg/L). The As, Cd, Bi, Co., Cr, Fe, Th, Ti and Zn values are typically under their respective detection limits and are therefore not shown.
Minerals 2018, 8, 55 13 of 19
Minerals 2018, 8, x FOR PEER REVIEW 13 of 19
Figure 9. Weathering cell results corresponding to REE concentrate.
The evolution of the elemental concentration of S (presumably as sulfate) Ca, Na, Ba, Mg, Fe, Sr, and REE suggests the dissolution of carbonates is a result of water-rock interaction and/or acid generated by sulfide oxidation. The LREE concentrations are higher in the leachates from the REE concentrate (1–133 µg/L) compared to those of HREE (0.03–61 µg/L). These results are consistent with those found by Edahbi et al. [24] on the Kipawa alkaline intrusion REE deposit. In this geological context the leached REE is below 15 µg/L [24]. Moreover, Purdy [42] demonstrated that the REE concentrations in the leachate using shake flask tests on REE tailings of the Nechalacho Deposit, Northwest Territories, vary between 1 µg/L and 12 µg/L, with a maximum concentration in the tests using distilled deionized water and the minimum concentration in the tests using pilot plant water. The authors also demonstrated that more than 90% of the leached REE were presented in the colloidal phase [42]. In addition, other authors showed that REE fractionation is promoted by an increase in pH [24,43,44]. Edahbi et al. showed, using thermodynamic equilibrium calculations on the humidity cell leachate data, that REE concentrations decreased significantly (from 10−8 to 10–16 mg/L) when pH values increase from 2.6 to 10 [45]
Figure 9.Weathering cell results corresponding to REE concentrate.
The evolution of the elemental concentration of S (presumably as sulfate) Ca, Na, Ba, Mg, Fe, Sr, and REE suggests the dissolution of carbonates is a result of water-rock interaction and/or acid generated by sulfide oxidation. The LREE concentrations are higher in the leachates from the REE concentrate (1–133 µg/L) compared to those of HREE (0.03–61 µg/L). These results are consistent with those found by Edahbi et al. [24] on the Kipawa alkaline intrusion REE deposit. In this geological context the leached REE is below 15 µg/L [24]. Moreover, Purdy [42] demonstrated that the REE concentrations in the leachate using shake flask tests on REE tailings of the Nechalacho Deposit, Northwest Territories, vary between 1 µg/L and 12 µg/L, with a maximum concentration in the tests using distilled deionized water and the minimum concentration in the tests using pilot plant water. The authors also demonstrated that more than 90% of the leached REE were presented in the colloidal phase [42]. In addition, other authors showed that REE fractionation is promoted by an increase in pH [24,43,44]. Edahbi et al. showed, using thermodynamic equilibrium calculations on the humidity cell leachate data, that REE concentrations decreased significantly (from 10−8to 10−16mg/L) when pH values increase from 2.6 to 10 [45].
Minerals 2018, 8, 55 14 of 19
The HREE (1387 mg/kg) are in lower concentrations in the solid samples relative to the LREE (51,220 mg/kg). However, the ratio of LREE to HREE (2,5) leached during the weathering cell tests are lower than their corresponding relative ratio in the solids (37). This suggests that the LREE have a lower mobility than HREE. This could be explained by the fact that the LREE have larger ionic radii than the HREE, which favors their precipitation as secondary minerals in weathering cell conditions.
4. Discussion
The mineralogy of REE and the geochemical behavior of the REE-bearing phases within the Montviel carbonatites were evaluated using QEMSCAN analyses and kinetic tests (weathering cells), and observations are discussed below.
4.1. Separation Efficiency and Environmental Challenges
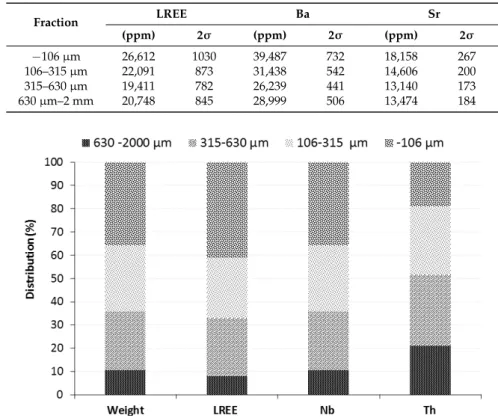
The chemical composition of the concentrate analyzed by XRF are shown in Table3. In general, LREE concentrations increase with decreasing particle size. Sulfide minerals and iron oxides are also concentrated in the finest size fraction of the concentrate sample. The Nb, and Th display a similar trend (Figure10). The majority of these elements are present in the−106 µm fraction (41% of LREE, 36% of Nb, and 19% of Th). The concentration of LREE in the finer fractions is explained by preferential grinding of REE-bearing minerals compared to the gangue minerals (i.e., silicates, iron oxides, etc.).
Table 3.Chemical analyses of the REE concentrate from the ten tests of gravity concentration; 2σ is the error of the XRF analyses.
Fraction LREE Ba Sr (ppm) 2σ (ppm) 2σ (ppm) 2σ −106 µm 26,612 1030 39,487 732 18,158 267 106–315 µm 22,091 873 31,438 542 14,606 200 315–630 µm 19,411 782 26,239 441 13,140 173 630 µm–2 mm 20,748 845 28,999 506 13,474 184
Minerals 2018, 8, x FOR PEER REVIEW 14 of 19
The HREE (1387 mg/kg) are in lower concentrations in the solid samples relative to the LREE (51,220 mg/kg). However, the ratio of LREE to HREE (2,5) leached during the weathering cell tests are lower than their corresponding relative ratio in the solids (37). This suggests that the LREE have a lower mobility than HREE. This could be explained by the fact that the LREE have larger ionic radii than the HREE, which favors their precipitation as secondary minerals in weathering cell conditions. 4. Discussion
The mineralogy of REE and the geochemical behavior of the REE-bearing phases within the Montviel carbonatites were evaluated using QEMSCAN analyses and kinetic tests (weathering cells), and observations are discussed below.
4.1. Separation Efficiency and Environmental Challenges
The chemical composition of the concentrate analyzed by XRF are shown in Table 3. In general, LREE concentrations increase with decreasing particle size. Sulfide minerals and iron oxides are also concentrated in the finest size fraction of the concentrate sample. The Nb, and Th display a similar trend (Figure 10). The majority of these elements are present in the −106 µm fraction (41% of LREE, 36% of Nb, and 19% of Th). The concentration of LREE in the finer fractions is explained by preferential grinding of REE-bearing minerals compared to the gangue minerals (i.e., silicates, iron oxides, etc.).
Table 3. Chemical analyses of the REE concentrate from the ten tests of gravity concentration; 2σ is
the error of the XRF analyses.
Fraction (ppm) LREE 2σ (ppm) Ba 2σ (ppm) Sr 2σ
−106 µm 26,612 1030 39,487 732 18,158 267
106–315 µm 22,091 873 31,438 542 14,606 200 315–630 µm 19,411 782 26,239 441 13,140 173 630 µm–2 mm 20,748 845 28,999 506 13,474 184
Figure 10. LREE enrichment as a function of the particle size.
In the light of these findings, and in the framework of sustainable development, social acceptability, and environmental regulations of REE mine wastes, the finer fraction will be the most
Figure 10.LREE enrichment as a function of the particle size.
In the light of these findings, and in the framework of sustainable development, social acceptability, and environmental regulations of REE mine wastes, the finer fraction will be the most problematic fraction and will potentially require a focused strategy to mitigate the risk. Fine particles are the most reactive to water-rock interactions due to its higher specific surface area and degree of liberation. Therefore, they may release metals, REE, and other contaminants in the drainage waters, which might
Minerals 2018, 8, 55 15 of 19
exceed regulatory limits. As a circumvention strategy, and in the context of sound REE production, this fraction could be separated by a screening operation and reprocessed with the ore (Figure11). The least problematic coarse fraction could be sent to waste rock piles with suitable and specific environmental management and waste disposal strategies.
REE ores are often contaminated with actinides such as thorium, uranium, and other contaminants (e.g., Ba, Sr, Mn, Ta) [11,12]. Social acceptability of REE production is an important issue for REE investors. Several publications found in the literature have reported significant environmental issues caused by REE mining and refining [13,14]. In China, the use of acids to recover REE leads to the deterioration of the water quality in the surrounding environment. In Malaysia, radioactive wastes were stored in ambient surface conditions and consequently generated deleterious impacts on the environment [15]. REE ores are generally the deposits characterized by large-tonnage, low-grade operations which could generate significant quantities of liquid and solid wastes (e.g., waste rocks, tailings, and effluents). For example, the production of one tonne of REE could be generated approximately 2000 tonnes of tailings [13]. In the case of Montviel project (Lebel-sur-Quévillon, QC, Canada) 250 million tonnes (Mt) of REE-Nb carbonatites with a REE content estimated at 1.47% of rare earth oxides (REO) will be extracted. The costs of processing, tailings, and environment of one metric tonne of is estimated to Canadian dollar 74.60 [46]. In order to implement an integrated management strategy for the REE waste rocks, the base of the waste rocks pile should be compacted and tilted to promote lateral water flow, and it should be composed of materials from the least problematic lithology. The liquid effluents, collected around the pile, should be passed through a limestone drain for passive treatment.
Minerals 2018, 8, x FOR PEER REVIEW 15 of 19
problematic fraction and will potentially require a focused strategy to mitigate the risk. Fine particles are the most reactive to water-rock interactions due to its higher specific surface area and degree of liberation. Therefore, they may release metals, REE, and other contaminants in the drainage waters, which might exceed regulatory limits. As a circumvention strategy, and in the context of sound REE production, this fraction could be separated by a screening operation and reprocessed with the ore (Figure 11). The least problematic coarse fraction could be sent to waste rock piles with suitable and specific environmental management and waste disposal strategies.
REE ores are often contaminated with actinides such as thorium, uranium, and other contaminants (e.g., Ba, Sr, Mn, Ta) [11,12]. Social acceptability of REE production is an important issue for REE investors. Several publications found in the literature have reported significant environmental issues caused by REE mining and refining [13,14]. In China, the use of acids to recover REE leads to the deterioration of the water quality in the surrounding environment. In Malaysia, radioactive wastes were stored in ambient surface conditions and consequently generated deleterious impacts on the environment [15]. REE ores are generally the deposits characterized by large-tonnage, low-grade operations which could generate significant quantities of liquid and solid wastes (e.g., waste rocks, tailings, and effluents). For example, the production of one tonne of REE could be generated approximately 2000 tonnes of tailings [13]. In the case of Montviel project (Lebel-sur-Quévillon, QC, Canada) 250 million tonnes (Mt) of REE-Nb carbonatites with a REE content estimated at 1.47% of rare earth oxides (REO) will be extracted. The costs of processing, tailings, and environment of one metric tonne of is estimated to Canadian dollar 74.60 [46]. In order to implement an integrated management strategy for the REE waste rocks, the base of the waste rocks pile should be compacted and tilted to promote lateral water flow, and it should be composed of materials from the least problematic lithology. The liquid effluents, collected around the pile, should be passed through a limestone drain for passive treatment.
Figure 11. Example of integrated management of REE mine wastes.
4.2. Geochemical Behavior of REE
The weathering of the different lithologies within the Montviel deposit was studied in a previous study [45], where it was demonstrated that the REE-bearing carbonates from the Montviel deposit generates various elements (e.g., Ba, Sr, F, Th, and REE) in mine drainage waters. It is known that the carbonates dissolution is incomplete in near neutral conditions [47–49], and that the carbonate dissolution rates are lowest in alkaline and neutral conditions and increase in acid conditions [50,51]. The presence of impurities within REE-bearing minerals weaken their crystal lattice and consequently increase their dissolution rate. In the case of the Montviel materials, REE-carbonates
Figure 11.Example of integrated management of REE mine wastes. 4.2. Geochemical Behavior of REE
The weathering of the different lithologies within the Montviel deposit was studied in a previous study [45], where it was demonstrated that the REE-bearing carbonates from the Montviel deposit generates various elements (e.g., Ba, Sr, F, Th, and REE) in mine drainage waters. It is known that the carbonates dissolution is incomplete in near neutral conditions [47–49], and that the carbonate dissolution rates are lowest in alkaline and neutral conditions and increase in acid conditions [50,51]. The presence of impurities within REE-bearing minerals weaken their crystal lattice and consequently increase their dissolution rate. In the case of the Montviel materials, REE-carbonates and non REE-carbonates neutralize the acidity produced by the sulfide oxidation or carried within acid rain, releasing REE and other associated elements in the leachates. However, it was demonstrated that
Minerals 2018, 8, 55 16 of 19
the REE concentrations (and other associated elements) in the Montviel leachates are controlled by secondary precipitations and sorption phenomena. The behavior of the concentrate sample studied here is similar to that of the REE-bearing lithologies, although the residual REE concentrations in the leachates are higher (136 µg/L in the concentrate leachates compared to the lithologies, 9 µg/L). The use of a concentrate to mimic the behavior of REE in waste material is done in order to amplify the geochemical responses that could be obtained from mine wastes, and make measurement and interpretation more robust. This methodology was successfully applied in another context [52]. Consequently, the interpretation of the weathering cell data will not be investigated further; the interested readers are invited to consult [45].
4.3. Implications to the Prediction of the Geochemical Behavior and Water Quality of REE Mine Wastes Predicting the geochemical behavior of REE-bearing mine wastes and, ultimately, the mine drainage quality of those wastes, is not significantly different than for other metals. However, prediction of contaminated neutral drainage issued from REE mine wastes is particularly challenging because of the low reactivity and complex compositions of REE-bearing minerals. Therefore, in order to better understand the geochemical behavior of REE waste rocks and tailings and predict the quality of the drainage waters, the use of detailed chemical/mineralogical characterizations such as QEMSCAN, MLA, SEM and EPMA are necessary. Figure12illustrates a mine water quality prediction strategy that could be applied to REE-bearing mine wastes. The purpose of this approach is to meet the following challenges (Figure12): (i) identify and quantify the different REE-bearing minerals (and associated potential contaminants) on representative samples of the different lithologies; (ii) evaluate the reactivity of the REE-bearing lithologies; (iii) propose an integrated management approach of the future REE-bearing waste rocks. In such an approach, representative samples of the different lithologies are submitted to percolation and leaching tests along with physical, chemical and mineralogical testing. The combination of these results helps to identify risks associated with weathering of mine waste and to move towards prediction of mine water quality.
Minerals 2018, 8, x FOR PEER REVIEW 16 of 19
and non REE-carbonates neutralize the acidity produced by the sulfide oxidation or carried within acid rain, releasing REE and other associated elements in the leachates. However, it was demonstrated that the REE concentrations (and other associated elements) in the Montviel leachates are controlled by secondary precipitations and sorption phenomena. The behavior of the concentrate sample studied here is similar to that of the REE-bearing lithologies, although the residual REE concentrations in the leachates are higher (136 µg/L in the concentrate leachates compared to the lithologies, 9 µg/L). The use of a concentrate to mimic the behavior of REE in waste material is done in order to amplify the geochemical responses that could be obtained from mine wastes, and make measurement and interpretation more robust. This methodology was successfully applied in another context [52]. Consequently, the interpretation of the weathering cell data will not be investigated further; the interested readers are invited to consult [45].
4.3. Implications to the Prediction of the Geochemical Behavior and Water Quality of REE Mine Wastes
Predicting the geochemical behavior of REE-bearing mine wastes and, ultimately, the mine drainage quality of those wastes, is not significantly different than for other metals. However, prediction of contaminated neutral drainage issued from REE mine wastes is particularly challenging because of the low reactivity and complex compositions of REE-bearing minerals. Therefore, in order to better understand the geochemical behavior of REE waste rocks and tailings and predict the quality of the drainage waters, the use of detailed chemical/mineralogical characterizations such as QEMSCAN, MLA, SEM and EPMA are necessary. Figure 12 illustrates a mine water quality prediction strategy that could be applied to REE-bearing mine wastes. The purpose of this approach is to meet the following challenges (Figure 12): (i) identify and quantify the different REE-bearing minerals (and associated potential contaminants) on representative samples of the different lithologies; (ii) evaluate the reactivity of the REE-bearing lithologies; (iii) propose an integrated management approach of the future REE-bearing waste rocks. In such an approach, representative samples of the different lithologies are submitted to percolation and leaching tests along with physical, chemical and mineralogical testing. The combination of these results helps to identify risks associated with weathering of mine waste and to move towards prediction of mine water quality.
Figure 12. Approach to predict geochemical behavior of REE mine wastes. Figure 12.Approach to predict geochemical behavior of REE mine wastes.
Minerals 2018, 8, 55 17 of 19
5. Conclusions
The main objectives of this study were: (1) to characterize REE-bearing minerals and to improve the counting statistics, analytical precision, and the geochemical interpretations using a REE concentrate sample prepared by gravity and magnetic processes; and (2) to evaluate the geochemical behavior of the REE-bearing materials using kinetic tests. Three lithological units chosen from exploration dill core to represent the heterogeneity of the GéoMéga waste rocks and a REE concentrate were tested. The lithologies were chosen to represent typical residue of REE mining and refining.
The main mineralogical conclusions drawn from this study indicate that the main REE-bearing minerals in Montviel deposit are ancylite, burbankite, carbonernaite, kukharenkoite, qaqarssukite, monazite, strontianite and apatite. In addition, several accessory minerals contain REE, such as apatite and pyrochlore. At least 50% of the REE-bearing minerals are liberated within the samples, while the remaining portion is either included or locked in gangue minerals (i.e., silicates and carbonates).
Geochemical results from both kinetic tests show a stable pH around 8 and alkalinity values between 37 and 110 mg CaCO3/L. The main geochemical results from the kinetic tests are: (i) REE are good geochemical tracers of carbonate dissolution; and (ii) the leachability of REE from the studied carbonatite deposit is low and controlled by sorption processes in weathering cell conditions.
Acknowledgments: The authors thank the URSTM, staff for their support with laboratory work and NSERC/Geomega Resources for funding of this study. They also thank gratefully Agnico-Eagle mines and particularly Raphaël Mermillod-Blondin for technical support.
Author Contributions:Mohamed Edahbi performed all the tests and acquired all the results shown within this manuscript. Results interpretation was realized by Mohamed Edahbi under the supervision of his supervisors, Benoît Plante and Mostafa Benzaazoua. QEMSCAN measurements and interpretation were realized with the help of Lori Kormos. Mia Pelletier provided the samples and contributed to the manuscript’s revisions.
Conflicts of Interest:The authors declare no conflict of interest. Abbreviations
REE rare earth elements
QEMSCAN quantitative evaluation of minerals by scanning electron microscopy
XRD X-ray diffraction
EPMA electron probe micro-analyzer
SEM-EDS scanning electron microscopy with X-ray microanalysis References
1. Catinat, M. Critical Raw Materials for the EU—Report of the Ad-Hoc Working Group on Defining Critical Raw Materials; European Commission, Enterprise and Industry: Brussels, Belgium, 2010.
2. Humphries, M. Rare Earth Elements: The Global Supply Chain. Congressional Research Service, 7-5700. 2013. Available online:http://www.fas.org/sgp/crs/natsec/R41347.pdf(accessed on 6 February 2018). 3. Mariano, A.N.; Mariano, A. Rare Earth Mining and Exploration in North America. Elements 2012, 8, 369–376.
[CrossRef]
4. Cox, C.; Kynicky, J. The rapid evolution of speculative investment in the REE market before, during, and after the rare earth crisis of 2010–2012. Extr. Ind. Soc. 2017, in press. [CrossRef]
5. Chakhmouradian, A.R.; Smith, M.P.; Kynicky, J. From “strategic” tungsten to “green” neodymium: A century of critical metals at a glance. Ore Geol. Rev. 2015, 64, 455–458. [CrossRef]
6. Massari, S.; Ruberti, M. Rare earth elements as critical raw materials: Focus on international markets and future strategies. Resour. Policy 2013, 38, 36–43. [CrossRef]
7. Schlinkert, D.; van den Boogaart, K.G. The development of the market for rare earth elements: Insights from economic theory. Resour. Policy 2015, 46, 272–280. [CrossRef]
8. Jordens, A.; Marion, C.; Grammatikopoulos, T.; Waters, K.E. Understanding the effect of mineralogy on muscovite flotation using QEMSCAN. Int. J. Miner. Process. 2016, 155, 6–12. [CrossRef]
Minerals 2018, 8, 55 18 of 19
9. Dehaine, Q.; Filippov, L.O. Rare earth (La, Ce, Nd) and rare metals (Sn, Nb, W) as by-product of kaolin production, Cornwall: Part 1: Selection and characterisation of the valuable stream. Miner. Eng. 2015, 76, 141–153. [CrossRef]
10. Filippov, L.O.; Dehaine, Q.; Filippova, I.V. Rare earths (La, Ce, Nd) and rare metals (Sn, Nb, W) as by-products of kaolin production—Part 3: Processing of fines using gravity and flotation. Miner. Eng. 2016, 95, 96–106. [CrossRef]
11. Chakhmouradian, A.R.; Reguir, E.P.; Zaitsev, A.N.; Couëslan, C.; Xu, C.; Kynický, J.; Mumin, A.H.; Yang, P. Apatite in carbonatitic rocks: Compositional variation, zoning, element partitioning and petrogenetic significance. Lithos 2017, 274, 188–213. [CrossRef]
12. Nadeau, O.; Cayer, A.; Pelletier, M.; Stevenson, R.; Jébrak, M. The Paleoproterozoic Montviel carbonatite-hosted REE–Nb deposit, Abitibi, Canada: Geology, mineralogy, geochemistry and genesis. Ore Geol. Rev. 2015, 67, 314–335. [CrossRef]
13. Hurst, C. China’s Rare Earth Elements Industry: What Can the West Learn? Institute for the Analysis of Global Security: Washington, DC, USA, 2010.
14. Weber, R.J.; Reisman, D.J. Rare Earth Elements: A Review of Production, Processing, Recycling, and Associated Environmental Issues; US EPA Region: Cincinnati, OH, USA, 2012.
15. Pecht, M.; Kaczmarek, R.; Song, X.; Hazelwood, D.; Kavetsky, R.; Anand, D. Rare Earth Material: Insights and Concerns; CALCE EPSC Press, University of Maryland: College Park, MD, USA, 2011.
16. Chakhmouradian, A.R.; Zaitsev, A.N. Rare Earth Mineralization in Igneous Rocks: Sources and Processes. Elements 2012, 8, 347–353. [CrossRef]
17. Kynicky, J.; Smith, M.P.; Xu, C. Diversity of rare earth deposits: The key example of China. Elements 2012, 8, 361–367. [CrossRef]
18. Orris, G.J.; Grauch, R.I. Rare Earth Element Mine, Deposits, and Occurences; USGC (Science for a Changing World): Reston, VA, USA, 2002.
19. Chakhmouradian, A.R.; Wall, F. Rare Earth Elements: Minerals, Mines, Magnets (and More). Elements 2012, 8, 333–340. [CrossRef]
20. Williams-Jones, A.E.; Migdisov, A.A.; Samson, I.M. Hydrothermal mobilisation of the rare earth elements a Tale of “Ceria” and “Yttria”. Elements 2012, 8, 355–360. [CrossRef]
21. Zaitsev, A.N.; Terry Williams, C.; Jeffries, T.E.; Strekopytov, S.; Moutte, J.; Ivashchenkova, O.V.; Spratt, J.; Petrov, S.V.; Wall, F.; Seltmann, R.; et al. Rare earth elements in phoscorites and carbonatites of the Devonian Kola Alkaline Province, Russia: Examples from Kovdor, Khibina, Vuoriyarvi and Turiy Mys complexes. Ore Geol. Rev. 2014, 61, 204–225. [CrossRef]
22. Verplanck, P.L.; Gosen, B.S.V. Carbonatite and Alkaline Intrusion-Related Rare Earth Element Deposits—A Deposit Model; USGS: Reston, VA, USA, 2011.
23. Kanazawa, Y.; Kamitani, M. Rare earth minerals and resources in the world. J. Alloys Compd. 2006, 408–412, 1339–1343. [CrossRef]
24. Edahbi, M.; Benzaazoua, M.; Plante, B.; Doire, S.; Kormos, L. Mineralogical characterization using QEMSCAN®and leaching potential study of REE within silicate ores: A case study of the Matamec project, Québec, Canada. J. Geochem. Explor. 2017, 185, 64–73. [CrossRef]
25. Binnemans, K.; Jones, P.T.; Blanpain, B.; Van Gerven, T.; Yang, Y.; Walton, A.; Buchert, M. Recycling of rare earths: A critical review. J. Clean. Prod. 2013, 51, 1–22. [CrossRef]
26. Schmid, R. Descriptive nomenclature and classification of pyroclastic deposits and fragments: Recommendations of the IUGS Subcommission on the Systematics of Igneous Rocks. Geology 1981, 9, 41–43. [CrossRef]
27. Andrade, F.R.D.; Möller, P.; Lüders, V.; Dulski, P.; Gilg, H.A. Hydrothermal rare earth elements mineralization in the Barra do Itapirapuã carbonatite, southern Brazil: Behaviour of selected trace elements and stable isotopes (C, O). Chem. Geol. 1999, 155, 91–113. [CrossRef]
28. Zaitsev, A.N.; Wall, F.; Bas, M.J.L. REE-Sr-Ba minerals from the Khibina carbonatites, Kola Peninsula, Russia: Their mineralogy, paragenesis and evolution. Mineral. Mag. 1998, 62, 225–250.
29. Nadeau, O.; Stevenson, R.; Jébrak, M. Evolution of Montviel alkaline-carbonatite complex by coupled fractional crystallization, fluid mixing and metasomatism—Part II: Trace element and Sm–Nd isotope geochemistry of metasomatic rocks: Implications for REE-Nb mineralization. Ore Geol. Rev. 2016, 72, 1163–1173. [CrossRef]
Minerals 2018, 8, 55 19 of 19
30. Bau, M. Scavenging of dissolved yttrium and rare earths by precipitating iron oxyhydroxide: Experimental evidence for Ce oxidation, Y-Ho fractionation, and lanthanide tetrad effect. Geochim. Cosmochim. Acta 1999, 63, 67–77. [CrossRef]
31. Censi, P.; Saiano, F.; Pisciotta, A.; Tuzzolino, N. Geochemical behaviour of rare earths in Vitis vinifera grafted onto different rootstocks and growing on several soils. Sci. Total Environ. 2014, 473–474, 597–608. [CrossRef] [PubMed]
32. Leal Filho, W. Chapter 17—An Analysis of the Environmental Impacts of the Exploitation of Rare Earth Metals. In Rare Earths Industry; Elsevier: Boston, MA, USA, 2016; pp. 269–277.
33. Schüler, D.; Buchert, M.; Liu, R.; Dittrich, S.; Merz, C. Study on Rare Earths and Their Recycling; Öko-Institut e.V.: Darmstadt, Germany, 2011.
34. Sapsford, D.J.; Bowell, R.J.; Geroni, J.N.; Penman, K.M.; Dey, M. Factors influencing the release rate of uranium, thorium, yttrium and rare earth elements from a low grade ore. Miner. Eng. 2012, 39, 165–172. [CrossRef] 35. Zhu, Z.; Liu, C.-Q.; Wang, Z.L.; Liu, X.; Li, J. Rare earth elements concentrations and speciation in rainwater
from Guiyang, an acid rain impacted zone of Southwest China. Chem. Geol. 2016, 442, 23–34. [CrossRef] 36. Jordens, A.; Sheridan, R.S.; Rowson, N.A.; Waters, K.E. Processing a rare earth mineral deposit using gravity
and magnetic separation. Miner. Eng. 2014, 62, 9–18. [CrossRef]
37. Goutier, J. Géologie de la Région du lac au Goéland (32F/15); Ressources Naturelles et Faune, Québec: Rouyn-Noranda, QC, Canada, 2006.
38. Brunauer, S.; Emmett, P.H.; Teller, E. Adsorption of gases in multimolecular layers. J. Am. Chem. Soc. 1938, 60, 309–319. [CrossRef]
39. Young, R.A. The rietveld method. Int. Union Crystallogr. 1993, 5, 252–254.
40. Smythe, D.M.; Lombard, A.; Coetzee, L.L. Rare Earth Element deportment studies utilising QEMSCAN technology. Miner. Eng. 2013, 52, 52–61. [CrossRef]
41. Bouzahzah, H.; Benzaazoua, M.; Bussiere, B.; Plante, B. Prediction of acid mine drainage: Importance of mineralogy and the test protocols for static and kinetic tests. Mine Water Environ. 2014, 33, 54–65. [CrossRef] 42. Purdy, C. The Geochemical and Mineralogical Controls on the Environmental Mobility of Rare Earth Elements from Tailings, Nechalacho Deposit, Northwest Territories. Master’s Thesis, Queen’s University, Kingston, ON, Canada, 2014.
43. Janssen, R.P.T.; Verweij, W. Geochemistry of some rare earth elements in groundwater, Vierlingsbeek, The Netherlands. Water Res. 2003, 37, 1320–1350. [CrossRef]
44. Leybourne, M.I.; Goodfellow, W.D.; Boyle, D.R.; Hall, G.M. Rapid development of negative Ce anomalies in surface waters and contrasting REE patterns in groundwaters associated with Zn–Pb massive sulphide deposits. Appl. Geochem. 2000, 15, 695–723. [CrossRef]
45. Edahbi, M.; Plante, B.; Benzaazoua, M.; Pelletier, M. Geochemistry of rare earth elements within waste rocks from the Montviel carbonatite deposit, Québec, Canada. Environ. Sci. Pollut. Res. 2018. [CrossRef]
46. Belzile Solutions Inc. NI 43-101 Technical Report Montviel Rare Earth Project Québec, Canada; Belzile Solutions Inc.: Rouyn-Noranda, QC, Canada, 2015.
47. Chou, L.; Garrels, R.M.; Wollast, R. Comparative study of the kinetics and mechanisms of dissolution of carbonate minerals. Chem. Geol. 1989, 78, 269–282. [CrossRef]
48. Morse, J.W.; Arvidson, R.S. The dissolution kinetics of major sedimentary carbonate minerals. Earth Sci. Rev. 2002, 58, 51–84. [CrossRef]
49. Morse, J.W.; Arvidson, R.S.; Lüttge, A. Calcium carbonate formation and dissolution. Chem. Rev. 2007, 107, 342–381. [CrossRef] [PubMed]
50. Sherlock, E.; Lawrence, R.; Poulin, R. On the neutralization of acid rock drainage by carbonate and silicate minerals. Environ. Geol. 1995, 25, 43–54. [CrossRef]
51. Benzaazoua, M.; Bussiere, B.; Dagenais, A.M.; Archambault, M. Kinetic tests comparison and interpretation for prediction of the Joutel tailings acid generation potential. Environ. Geol. 2004, 46, 1086–1101. [CrossRef] 52. Plante, B.; Benzaazoua, M.; Bussière, B. Predicting geochemical behaviour of waste rock with low acid
generating potential using laboratory kinetic tests. Mine Water Environ. 2011, 30, 2–21. [CrossRef]
© 2018 by the authors. Licensee MDPI, Basel, Switzerland. This article is an open access article distributed under the terms and conditions of the Creative Commons Attribution (CC BY) license (http://creativecommons.org/licenses/by/4.0/).