HAL Id: hal-02196155
https://hal.archives-ouvertes.fr/hal-02196155v2
Submitted on 26 Jul 2019
HAL is a multi-disciplinary open access
archive for the deposit and dissemination of
sci-entific research documents, whether they are
pub-lished or not. The documents may come from
teaching and research institutions in France or
abroad, or from public or private research centers.
L’archive ouverte pluridisciplinaire HAL, est
destinée au dépôt et à la diffusion de documents
scientifiques de niveau recherche, publiés ou non,
émanant des établissements d’enseignement et de
recherche français ou étrangers, des laboratoires
publics ou privés.
Adaptive range-based anomaly detection in
drone-assisted cellular networks
Chérifa Boucetta, Boubakr Nour, Seif Eddine Hammami, Hassine Moungla,
Hossam Afifi
To cite this version:
Chérifa Boucetta, Boubakr Nour, Seif Eddine Hammami, Hassine Moungla, Hossam Afifi. Adaptive
range-based anomaly detection in drone-assisted cellular networks. IWCMC 2019: 15th International
Wireless Communications & Mobile Computing Conference, Jun 2019, Tanger, Morocco.
pp.1239-1244, �10.1109/IWCMC.2019.8766446�. �hal-02196155v2�
Adaptive Range-based Anomaly Detection
in Drone-assisted Cellular Networks
Cherifa Boucetta
∗, Boubakr Nour
§, Seif Eddine Hammami
‡, Hassine Moungla
∗‡, and Hossam Afifi
‡∗LIPADE, University of Paris Descartes, Sorbonne Paris Cite, Paris, France §School of Computer Science, Beijing Institute of Technology, Beijing, China
‡UMR 5157, CNRS, Institute Mines Telecom, Telecom SudParis, Nano-Innov CEA Saclay, France
Email: {cherifa.boucetta, hassine.moungla}@parisdescartes.fr, [email protected], seif [email protected], [email protected]
Abstract—Stimulated by the emerging Internet of Things (IoT) applications and their massive generated data, the cellular providers are introducing various IoT functionalities into their networks architecture. They should integrate intelligent and autonomous mechanisms that are able to detect sudden and anomalous behavior issues. In this paper, we present an adaptive anomaly detection approach in cellular networks consisting of two parts: the detection of overloaded base-stations using machine learning algorithm (LSTM – Long Short-Term Memory) and the deployment of drones as mobile base-stations that support and back up the overloaded cells. The proposed approach is validated using real dataset extracted from the CDR of Milan combined with semi-synthetic eHealth data. Initially, The LSTM algorithm analyzes the impact of eHealth applications on cellular networks and identifies cells with peak demands. Then, drones are deployed to collect the requested data from these cells. The obtained results show that the use of drones improves the quality of service and provides a better network performance.
Index Terms—Drone-assisted Cellular Networks, Anomaly De-tection, Machine Learning.
I. INTRODUCTION
A large number of Internet of Things (IoT) applications are emerging and making a significant change in human life. eHealth [1]–[4], a promising IoT use case, aims at connect-ing sensor devices to sense patients and surroundconnect-ing data, provide continuous patients’ monitoring, and improve health outcomes. However, the massive number of wearable devices and portable monitors generate an immense amount of data that may be gathered and managed by cellular networks. The additional eHealth data may overload the network and cause some anomalies that require autonomic and pro-active tools. Indeed, intelligent mechanisms must be integrated into the architecture and may be based on machine learning techniques that have the advantage of exploiting the plethora of data generated by cellular networks.
Cellular connectivity is an important access methodology for IoT because of the increased pervasiveness of mobile broadband. The cellular operators are facing a major challenge due to the big number of IoT applications and how to ensure ubiquitous connectivity for various devices and users in a flexible, reliable, and secure manner while increasing load on network resources. This is one of the important specifications for the next-generation 5G cellular networks. One of the proposed solutions is the use of Unmanned Aerial Vehicles
(UAVs), popularly known as drones, as flying base stations [5]. In particular, they are characterized by mobility, flexibility, and adaptive altitude. Although drone-cell technology is an emerging solution for network resource allocation and used to support and back up the cellular network, it needs an optimized method to deploy drones.
The literature has focused on anomaly detection and op-timized drone-cell deployment. [6] proposes an unsupervised clustering technique for fault detection and diagnostics in a cellular network based on key performance indicators (KPIs). [7] introduces CELLPAD, an anomaly detection framework for KPI time-series data. CELLPAD detected anomalies using machine-learning regression analysis and was tested on two types of anomalies: sudden drops and correlation changes. [8] proposes an online anomaly detection tool based on Support Vector Regression machine learning method, while work in [9] compared the Support Vector Machines prediction algorithm with two other algorithms named Multi-Layer Perceptron and Multi-Layer Perceptron with Weight Decay. [10] presents a spatiotemporal mathematical model for IoT devices and modeled the uplink channel stochastically.
Smart deployment of drone-cells has been studied in the literature. For instance, [11] presents a dynamic reinforce-ment learning solution for drone-cells networks based on an enhanced joint action selection. [12] defines a clustering approach for collecting data from IoT devices using UAVs. The proposed scheme exploits the framework of optimal transport theory in order to calculate the optimal trajectories and locations of drone-cells. [13] introduces an optimal 3D backhaul-aware placement approach of a drone-base-station.
In most of the existing schemes of drone-cells deployment, energy consumption and the capacity of drones are ignored. On the other hand, most of the proposed anomaly detection solutions have been evaluated using simulated data to detect the anomalies, which may affect the real performance and require time especially when the networks become denser. In this context, we propose a self-organized anomaly detection scheme based on Long Short-Term Memory (LSTM) machine learning algorithm followed with an optimized drone-cell deployment. Indeed, we present a mathematical formulation of maximizing the amount of gathered data to increase the cov-erage of all network cells and taking into account constraints
of drones such as energy consumption and data collection capacity. The objective of this scheme is to provide network operators with an adaptive, complete and automatic solution that detects outliers in the overloaded base-stations and deploy drones in order to collect data from these cells. The proposed solution is executed on a pre-analyzed semi-synthetic dataset of eHealth cellular data in the context of a marathon event.
II. ADAPTIVERANGE-BASEDANOMALYDETECTION
A. Data Set
In this study, we test our solution with data of the city of Milan extracted from Call Detail Records (CDRs) datasets published as part of the Big Data Challenge launched by Telecom Italia in 2014 [14]. The surface of the city is of size 235m x 235m and is tessellated in 10.000 squares. The dataset reports the subscribers’ communications activity including the geographical location (cell ID), the time when it occurred, the country code, incoming and outgoing calls, received and sent text messages and data usage (Internet). From this dataset, we extract the measurements aggregated in time slots of ten minutes of the data usage of 6 cells during a marathon organized in the SanSiro stadium. These cells are covering the stadium, the parking area, and some metro stations. During the marathon, we study the impact of additional eHealth data on the network load. The gathered eHealth data is related to Electrocardiography, Blood Saturation, Glucose Monitor, Heartbeat, Temperature, etc. The additional eHealth data can be transferred in real time mode or in store-and-forward mode. B. Architecture & Goals
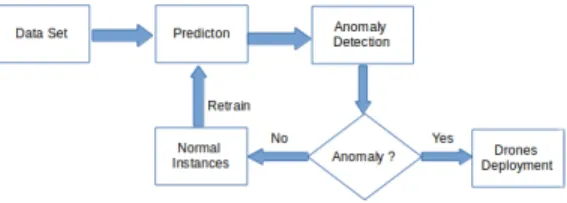
The anomaly detection solution is based on the LSTM algorithm [15] (Section IV/B), which is a deep learning approach that aims at making predictions using historical data as a training set in order to estimate optimal values. Figure 1 depicts a global view of the proposed framework architecture. The system takes the time-series data as input and then predicts the normal values for cellular network load, while the outputs are the predicted values for a periodical interval (every 10 minutes in our model).
Fig. 1: The Proposed Framework Architecture. The proposed approach detects the outliers by checking the deviations between the online data generated by user demands and the predicted values. Then, it decides for each cell if it contains normal instances or encloses anomalies. When cells’ overload is detected, the system deploys – in a dynamic and proactive manner– drones as flying base-stations that assist and back up the network.
C. Network Load Prediction
LSTM-based Prediction Model: Long Short-Term Memory is a recurrent neural network composed of three layers: Input Layer, Hidden Layer, and Output Layer [15]. It incorporates memory blocks used to store the temporal state of the network. Each memory block contains multiple cells that have a recurrent connection among them and multiplicative units, called gates involved to control the flow of information. The cells learn over arbitrary time intervals depending on the flow of information regulated by the gates. LSTM defines a set of weights associated with cells used to filter information when it is transferred through these cells and utilizes back-propagation through time algorithm to train the network.
To apply LSTM in the proposed scheme, we first predict the normal daily load on each cell by training the LSTM model with the history and measured network load dataset. Indeed, we consider a time-series data of length Z denoted χ = {x(1), x(2), . . ., x(Z)}. Each point x(t) represents the history of a cell load at time t which generates the vector of matrices S = Z−by−Ts where an entry sit represents the
volume of traffic in cell i at time t and Tsis the total number of
time-slots. The traffic matrix prediction calculates the predictor of X via the following formula: at
h = wiχ + bs, where ah is
the activation function, bs is the learning vector, and wi is
the weight matrix. In this model, we stack 3 LSTM layers: the first layer considers one input, the second layer is hidden and contains 4 LSTM blocks, and finally the third layer is the output layer and generates a single prediction value.
Network Anomaly Detection: The amount of data generated by IoT devices in the marathon event may cause sudden congestion to the cellular network and then decrease its quality of service. Hence, the prediction system is applied to calculate the normal load of each base station as a function of the time, denoted by ψ(t). We define, based on this prediction model, the minimum and the maximum acceptable threshold values for the base stations load. Let ξ be the real-time collected data generated by users’ demand within the cell. This data is compared to the predicted values calculated by the LSTM model. The comparison is performed by measuring the variance between each point of both time-series datasets. Anomalous time-interval is detected if ξ(t) is lower or higher than the appropriate tolerance thresholds ψ(t) − Ξ or ψ(t)+ Ξ respectively. Formally: ∀ t: if ((ξ(t) < ψ(t) − Ξ) or (ξ(t) > ψ(t) + Ξ)) then
• Generate an Anomaly Alert.
• Deploy drone(s) to backup the cellular network.
end
where: ξ(t) is the on-line IoT collected data, ψ(t) is the pre-dicted network load at time t, and Ξ is the tolerance threshold. The proposed model picks up the anomalies and then gives feedback about the remaining normal instances to retrain the prediction model (see Figure 1). Due to the additional eHealth data generated by the participants in the marathon event, the terrestrial base stations may fail to handle all connected users because of the congestion within the cell or malfunction in
Fig. 2: Drone-assisted Network Model.
the infrastructure. For this reason, the proposed technique allows network operators to detect anomalous network cells and launches the deployment of drones with a mission of data collecting in overloaded cells and consequently improve the quality of service (QoS) of the network.
III. DRONE-ASSISTEDCELLULARNETWORKS
After detecting the overloaded cells, the framework per-forms an optimized deployment of UAVs based on the eval-uation of a multi-objective function. The main objective is to maximize the amount of collected data considering the battery level of drones.
A. System Model and Notations
We propose a centralized drone-assisted network model, as shown in Figure 2, composed of a coordinator base station and a set of drones. The coordinator collects the needed information from the UAVs and manages its deployment by calculating the global objective function. It identifies the set of cells that should be assisted and the required amount of data to be collected based on the prediction model. Initially, all drones are located at the charging station(s) and ready to fly based on the coordinator’s decision.
Let Cc = {1, 2, . . ., C} denotes the set of congested cells
which are identified by the LSTM model. The horizontal location of the cell j ∈ Cc with peak data demands is denoted
as Wj ∈ R2x1. The set of charging stations is presented by
S = {1, 2, . . ., N}. The location of the charging station i ∈ S is denoted PiS= (XSi, YSi).
We differentiate three status of drones: serving, idle, or charging. In the serving status: the drone moves to the de-signed cell or returns back to the charging location (in case of end of mission or battery runs out or all cells are assisted). Hence, the state-of-charge (SoC) should be maintained within the feasible range denoted [B, B] where B is the maximum energy level and B is the lower bound that presents sufficient residual energy for the drone to return to the charging station.
Let K denotes the number of drones, Bd,tis the battery level
of a drone d at time t. Tt is the required time for each drone
to fly and collect the requested data and ˜Qis the total space of the drone to store its data. We assume that each drone moves at a constant altitude H and we denote τ(t) ∈ R2x1 the drone’s trajectory projected onto the horizontal plane and bounded by 0 ≤ t ≤ Tt. At any time t ∈ [0, Tt], the distance dj(t) between
drones and the Cellj is given in Eq. 1.
dj(t)=
q
H2+ ||τ(t) − W
j||2; j ∈ Cell (1)
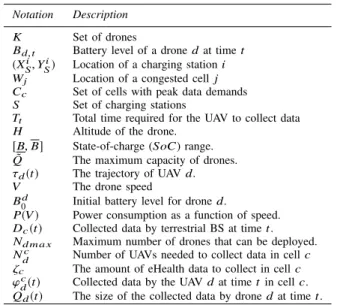
A comprehensive introduction to the most used notations in the paper is listed in Table I.
B. Problem Formulation
The deployment of drones is formulated as a multi-objective optimization problem aiming to maximize the amount of collected data in congested cells while minimizing the energy consumption of drones.
OBJECTIVE1: The minimum energy consumption:
The drone energy consumption includes the energy dissipated in data collection (the communication energy) and in-flying (the propulsion energy) [16]. The communication energy de-pends on the size of data to be gathered while the propulsion energy depends on the drone flying speed as well as the acceleration. Let Bk(Q(t)) be the energy consumption for
collecting data Q at time t by drone k. Therefore, Bk(Q(t)) is
given in Eq. 2. Bk(Q(t))= Tt Õ t=0 Ek(Q(t)); ∀k ∈ K (2)
where Ek(Q(t)) is the energy consumed by the drone k to
receive data with size Q at time t.
TABLE I: List of notations.
Notation Description
K Set of drones
Bd, t Battery level of a drone d at time t
(Xi
S, Y i
S) Location of a charging station i
Wj Location of a congested cell j
Cc Set of cells with peak data demands
S Set of charging stations
Tt Total time required for the UAV to collect data
H Altitude of the drone.
[B, B] State-of-charge (SoC) range.
˜
Q The maximum capacity of drones.
τd(t) The trajectory of UAV d.
V The drone speed
B0d Initial battery level for drone d.
P(V ) Power consumption as a function of speed.
Dc(t) Collected data by terrestrial BS at time t.
Nd m a x Maximum number of drones that can be deployed.
Nc
d Number of UAVs needed to collect data in cell c
ζc The amount of eHealth data to collect in cell c
ϕc
d(t) Collected data by the UAV d at time t in cell c.
Given the drone’s trajectory τ(t), the total required energy consumption for traveling with a constant speed, V , is ex-pressed in Eq. 3: Bk(Tt, τ(t)) = ∫ Tt 0 P(V )dt= P(V ) V τ(t); ∀k ∈ K (3) where P(V ) is the propulsion power consumption for flying with the constant speed V (energy consumption as a function of speed). Taking into account the propulsion energy and the communication energy, the total energy consumption can be formulated as shown in Eq. 4:
Bk(Tt, τ(t), Q(t)) = Bk(Q, t) + Bk(Tt, τ(t)) = Tt Õ t=0 (Ek(Q, t)) + ∫ Tt 0 P(V )dt; ∀k ∈ K (4)
Hence, the the battery level of a drone k at time t is given as: βk,t = B0k− Bk(Tt, τ(t), Q(t)) (5)
where B0k is the initial battery level of drone k.
Minimizing the total energy consumption while satisfying the target communication throughput requirements can be ensured by solving the following problem:
P(1) : Minimize Tt,τ(t),Q(t) Bk(Tt, τ(t), Q(t)) (6) Subject to: B ≤ Bk(Tt, τ(t), Q(t)); ∀t ∈ [0, Tt] (7) Qk(t) ≤ ˜Q; ∀t ∈ [0, Tt] (8) τk(t)= t Õ z=0 qk(z) (9) Q(t)= Õ c ∈ {C } ϕc k(t) (10) where ϕc
k is the gathered data by drone k in cell c at time t.
We use (10) when a drone collects data from several cells to calculate the total amount of data. Similarly, (9) is also used to calculate the whole trajectory if drone serves several cells. It is the sum of displacements of drone which is denoted by qm,n
if the said flies between two positions m and n. Furthermore, the distance between drone and the cell cjor the drone and the
charging station is calculated by Eq. 1, should be minimized. Hence, the coordinator chooses the nearest charging station to the cell to be served. Finally, (7) ensures that the designated drone has sufficient energy to return to the charging station while (8) determines that the collected data is lower than the total capacity of the drone.
OBJECTIVE2: The maximum cell coverage:
Maximiz-ing the network coverage involves maximizMaximiz-ing the amount of collected data by the terrestrial base-station and the deployed drones in each overloaded cells. Consequently, this objective is formulated for one cell c as shown in Eq. 11.
P(2) : Maximize Nc d,Tt,c ∈C Õ d ∈ {K } Dc(t)+ Ndc×ϕ c k(t) (11) Subject to: Ndc = ζc ˜ Q (12) Ndc ≤ Ndmax (13) Ndc×ϕck(t) ≤ ζc; ∀t ∈ [0, Tt] (14)
where Ndmax is the maximum number of drones that can be
used, Dc(t) is the capacity of the base-station of cell c at time
t, and ζc presents the amount of data that should be collected
in cell c. This parameter is calculated based on the output of the LSTM model.
Constraint (12) imposes the number of drones needed for data gathering for a given cell c that depends on the capacity of the drone and the amount of requested data to collect in this cell. Moreover, constraints (13) and (14) ensure that the totality of gathered data and the required number of drones depend on the quantity of data and the available number of drones.
The Global Multi-Objective Function: The global opti-mization problem is formulated as shown in Eq. 15:
Maximize Tt, Ndc Õ c ∈ {C } Õ k ∈ {K } Dc(t)+ Ndc×ϕ c k(t) (15)
Subject to: (7), (8), (9), (10), (12), (13), and (14).
Due to the limited energy of drones, reducing the power consumption in flying and in receiving data calculated by Eqs. 2 and 3 respectively, increases the activity time (Tt) of
each drone which can effectively affect the amount of collected data over all cells in the network.
C. Drone-cell Management Algorithm
In the following, we detail the proposed algorithm for drone-cell optimization deployment and management. Since the approach is centralized, we need a coordinator that plays the role of network orchestrator. In essence, the coordinator determines the set of congested cells and calculates the amount of data that drones should gather based on the prediction model. Then, it executes the deployment algorithm and assigns drones to cells. Finally, it collects the current status of drones in terms of capacity and residual energy. In our work, this coordinator is presented by the network operator (which can be also a centralized entity in the network architecture). We choose the coordinator to be a central network node such as a macro-cell that is able to communicate with all drones and base-stations and then calculates the trajectories of each drone. Algorithm 1 provides a pseudo-code of the optimized drone’s deployment. Initially, the coordinator executes the prediction algorithm and locates the overloaded cells and their additional
Algorithm 1: Drone-cell deployment Algorithm. Input: Position of UAVs and charging stations, Set of
drones K.
Output: UAV assignment, Amount of collected data. STEP0: SETUP
1 Cc := ∅; // Set of congested cells. 2 Pc := ∅; // Position of congested cells.
STEP1: INITIALIZATION
3 Collect on-line data;
4 Compare collected data with predicted data; 5 Identify overloaded cells;
6 Cc = {Congestedcells};
7 Pc = {Positionso f Congestedcells};
STEP2: DEPLOYMENT- NEARESTCELL
8 for (ci ∈ Cc)do
9 Compute the number of required drones Nc
d (Eq. 12); 10 for (d ∈ K) do
11 Calculate the trajectory τ: Minimize the distance
using (1) and (9);
12 Assign d to ci;
13 Update the energy level and the capacity of d;
14 end 15 end
load. Then, it calculates the number of required drones to collect the requested data based on previous equations and constraints and then chooses the nearest cells to the charging station in order to minimize the displacement distance. Hence, maximizing the amount of collected data depends strongly on the energy consumption of drones. Indeed, reducing the energy consumption of drones involves maximizing the flying time of drones and then maximizing the amount of data to collect.
Corresponding to the optimized assignment defined by the coordinator, drones move from their initial positions to start compensating users of the overloaded base-stations. Then, they return back to the charging stations. The selection method avoids assigning many drones to the cells with higher demand and tries to share drones all over the network in order to maximize the total quality of service.
IV. PERFORMANCE& EVALUATION
A. Performance Metrics
We consider real time-series datasets extracted from the CDRs of Milan combined with semi-synthetic eHealth data generated by demands of users during the marathon event. We examine the data usage of 6 cells around the SanSiro, and we deal with two types of eHealth application: Non-Real Rime (NRT) and Non-Real-Time (RT). The NRT data is used in store-and-forward transmission mode and depends on the storage capacity. It presents the stocked data in the smartphone before sending it on the network. We apply the prediction algorithm in order to detect cells with peak users’ demand. Then, the coordinator manages the deployment in an optimized way. The position of charging stations is defined based on
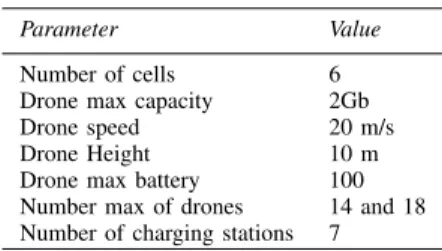
the tessellation of Milan city. Table II summarizes simulation parameters.
TABLE II: Simulation parameters.
Parameter Value
Number of cells 6
Drone max capacity 2Gb
Drone speed 20 m/s
Drone Height 10 m
Drone max battery 100
Number max of drones 14 and 18
Number of charging stations 7
B. Simulation Results
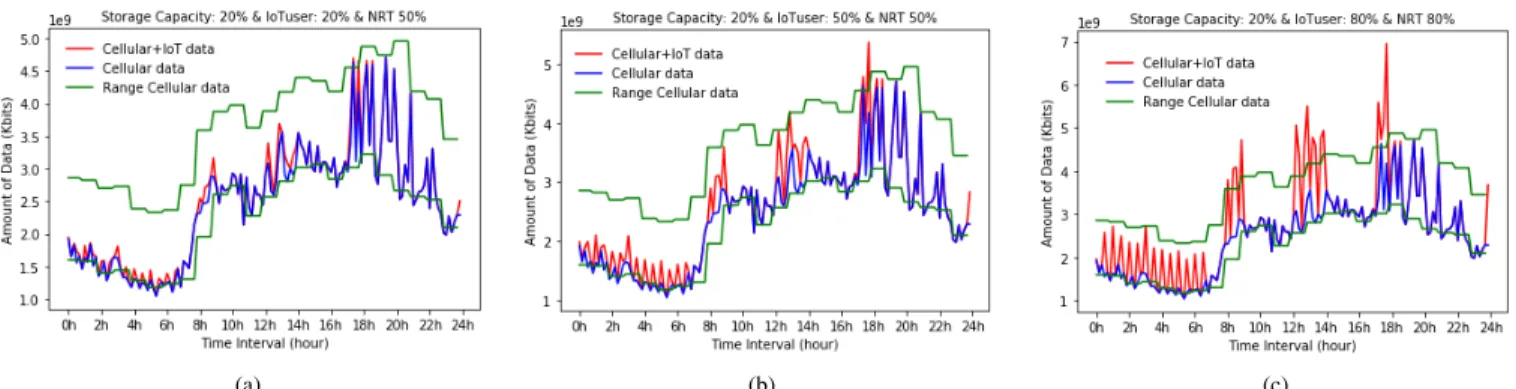
In Figure 3, we fix the storage capacity for eHealth data to 20% out of the total capacity storage of the smartphone and we vary the percentage of eHealth users demand. We can notice from Figure 3a that eHealth data does not have a significant effect on the cellular network with 20% of IoT users’ demand. This is because of the non-real time applications, which presents 50% of the consumed data, is not sent at the same time and does not correspond to the usual peak hour. Figure 3b shows that when the users’ demand increases to 50% and NRT data to 50%, an overrated peak of data is obtained without affecting seriously the network (around 6 PM). The anomaly is detected when the real-time network load is upper than the maximum value of predicted data. Finally, we notice from Figure 3c that online data with 80% eHealth applications where 80% are NRT data are impacting the cellular network. In essence, these additional users’ demand causes three network peaks (around 9 AM, 1 PM, and 6 PM), but the most important load peak is at 6 PM where the global data traffic is nearly double compared to the ordinary network measurements. Consequently, eHealth data could have an important negative effect on the quality of service and resource allocation in the network. For this reason, the solution deploys drones in order to collect data from detected overloaded cells.
To validate the drone-cell management approach, we con-sider the previous results and make a zoom on the peak of 6 PM which corresponds to the marathon time. We consider cells with the highest peaks of users’ demand. This scenario may correspond to the marathon time, the arrival time of supporters and their departure time after the marathon. For each detected anomaly, the model calculates the quantity of requested data and then assigns drones to cover congested cells. Figure 4 presents the preliminary results for the optimization problem with 14 and 18 drones. Figure 4a illustrates the amount of collected data as a function of the time. We notice that for the first hour, all cells are fully covered and drones alternate to serve the requested data according to their battery level. However, with the high peak of demands, 14 drones are not sufficient to cover all cells where more than 50% of requested data is collected and 18 drones give a better quality of service (more than 90% of requested data is gathered). This result is demonstrated in Figure 4b that illustrates the number of
(a) (b) (c)
Fig. 3: Simulation results for storage capacity = 20%.
requested and available drones as a function of the time. It is clear that the congested cells are not covered because of the number of available drones is insufficient and is lower than the requested number essentially in the case of 14 drones. For example, in the second hour, the number of requested drones is 7, however, the number of available drones is 4 in the case of 14 drones (blue and red curves). Then, the number increases when the first drones are charging which ameliorates the amount of collected data and covers different cells.
2*109 4*109 6*109 8*109 10*109 12*109 14*109 16*109 18*109 20*109 30 60 90 120 150 180 210 Collected Data Time (mn)
collected data for 14 drones Requested data collected data for 18 drones
(a) Collected Data (14 & 18 drones).
0 5 10 15 20 30 60 90 120 150 180 210 240 Number of drones Time (mn)
Required number of drones Number of available drones (14) Number of available drones (18)
(b) Variation of the number of available and requested drones.
Fig. 4: Amount of collected data and drones deployment.
V. CONCLUSION
This paper studied the impact of the eHealth data on cellular networks based on LSTM algorithm. We proposed an adaptive
range-based network anomaly detection that has been validated with real network traces. The results showed that the proposed model predicts and detects anomalies with high precision and then data could seriously degrade the network performances. Hence, we theoretically analyzed in the second part of this work the drone-cell deployment in order to support macro-cells when data rate demand is exploded. We presented a multi-objective function to maximize the amount of collected data taking battery life and the capacity of drones into con-sideration. The proposed solution helps network operators to efficiently manage their infrastructure.
REFERENCES
[1] R. Zhang et al., “A reliable and energy-efficient leader election algorithm for wireless body area networks,” in IEEE ICC, 2015.
[2] H. Moungla et al., “A power harvesting, dynamic and reliable wireless body area networks model deployment for health care applications,” in HPCS, 2012.
[3] M. J. Ali et al., “Interference avoidance algorithm (iaa) for multi-hop wireless body area network communication,” in IEEE HealthCom, 2015. [4] M. Ali et al., “Distributed scheme for interference mitigation of WBANs
using predictable channel hopping,” in IEEE Healthcom, 2016. [5] I. Bor-Yaliniz et al., “The new frontier in ran heterogeneity: Multi-tier
drone-cells,” IEEE Commun. Mag., 216.
[6] S. Rezaei et al., “Automatic fault detection and diagnosis in cellular networks using operations support systems data,” in IEEE/IFIP NOMS, 2016.
[7] W. Jun et al., “CellPAD: Detecting Performance Anomalies in Cellular Networks via Regression Analysis,” in IFIP Networking, 2018. [8] S. E. Hammami et al., “Proactive Anomaly Detection Model for
eHealth-Enabled Data in Next Generation Cellular Networks,” in IEEE ICC, 2018.
[9] A. Y. Nikravesh et al., “Mobile network traffic prediction using mlp, mlpwd, and svm,” in IEEE BigData Congress, 2016.
[10] M. Gharbieh et al., “Spatiotemporal stochastic modeling of iot enabled cellular networks: Scalability and stability analysis,” IEEE Trans. Com-mun., 2017.
[11] S. E. Hammami et al., “Drone-assisted cellular networks: A Multi-Agent Reinforcement Learning Approach,” in IEEE ICC, 2019.
[12] M. Mozaffari et al., “Mobile internet of things: Can UAVs provide an energy-efficient mobile architecture?” in IEEE GLOBECOM, 2016. [13] E. Kalantari et al., “Backhaul-aware robust 3d drone placement in 5G+
wireless networks,” arXiv preprint arXiv:1702.08395, 2017.
[14] T. Italia, “Telecom italia big data challenge,”
http://www.telecomitalia.com/tit/en/bigdatachallenge.html, 2015. [15] Z. Zhao et al., “LSTM network: a deep learning approach for short-term
traffic forecast,” IET Intelligent Transport Systems, 2017.
[16] Y. Zeng et al., “Energy minimization for wireless communication with rotary-wing UAV,” arXiv preprint arXiv:1804.02238, 2018.