HAL Id: hal-02915937
https://hal.telecom-paris.fr/hal-02915937
Submitted on 19 Aug 2020
HAL is a multi-disciplinary open access
archive for the deposit and dissemination of
sci-entific research documents, whether they are
pub-lished or not. The documents may come from
teaching and research institutions in France or
abroad, or from public or private research centers.
L’archive ouverte pluridisciplinaire HAL, est
destinée au dépôt et à la diffusion de documents
scientifiques de niveau recherche, publiés ou non,
émanant des établissements d’enseignement et de
recherche français ou étrangers, des laboratoires
publics ou privés.
SysML Models: Studying Safety and Security Measures
Impact on Performance Using Graph Tainting
Maysam Zoor, Ludovic Apvrille, Renaud Pacalet
To cite this version:
Maysam Zoor, Ludovic Apvrille, Renaud Pacalet.
SysML Models:
Studying Safety and
Se-curity Measures Impact on Performance Using Graph Tainting.
17th Workshop on Model
Driven Engineering, Verification and Validation (MoDeVVa 2020), Oct 2020, Montreal, Canada.
�10.1145/1122445.1122456�. �hal-02915937�
SysML Models: Studying Safety and Security Measures Impact
on Performance Using Graph Tainting
Maysam Zoor
maysam.zoor@telecom-paris.frLTCI, Télécom Paris, Institut polytechnique de Paris
France
Ludovic Apvrille
ludovic.apvrille@telecom-paris.frLTCI, Télécom Paris, Institut polytechnique de Paris
France
Renaud Pacalet
renaud.pacalet@telecom-paris.frLTCI, Télécom Paris, Institut polytechnique de Paris
France
ABSTRACT
Designing safe, secure and efficient embedded systems implies understanding interdependencies between safety, security and per-formance requirements and mechanisms. In this paper, we intro-duce a new technique for analyzing the performance impact of safety/security implemented as hardware and software mechanisms and described in SysML models. Our analysis approach extracts a dependency graph from a SysML model. The SysML model is then simulated to obtain a list of simulation transactions. Then, to study the latency between two events of interest, we progressively taint the dependency graph according to simulation transactions and to dependencies between all software and hardware components. The simulation transactions are finally classified according to which vertex taint they correspond, and are displayed according to their timing and related hardware device. Thus a designer can easily spot which components need to be re-modeled in order to meet the performance requirement. A Rail Carriage use case studied in the scope of the H2020 AQUAS project illustrates our approach, in particular how tainting can handle the multiple occurrences of the same event.
CCS CONCEPTS
• Computer systems organization → Embedded software.
KEYWORDS
Embedded Systems, Safety, Security, Performance, MBSE, Simula-tion, verificaSimula-tion,Tainting
ACM Reference Format:
Maysam Zoor, Ludovic Apvrille, and Renaud Pacalet. 2018. SysML Models: Studying Safety and Security Measures Impact on Performance Using Graph Tainting. In MoDeVVa ’20: 17th Workshop on Model-Driven Engineering Ver-ification & Validation, October 18–23, 2020,Montreal, Canada. ACM, New York, NY, USA, 10 pages. https://doi.org/10.1145/1122445.1122456
1
INTRODUCTION
One of the challenges when designing embedded systems is to satisfy altogether its safety, security and performance requirements.
Permission to make digital or hard copies of all or part of this work for personal or classroom use is granted without fee provided that copies are not made or distributed for profit or commercial advantage and that copies bear this notice and the full citation on the first page. Copyrights for components of this work owned by others than ACM must be honored. Abstracting with credit is permitted. To copy otherwise, or republish, to post on servers or to redistribute to lists, requires prior specific permission and/or a fee. Request permissions from permissions@acm.org.
MoDeVVa ’20, October 18–23, 2020, Montreal, Canada © 2018 Association for Computing Machinery. ACM ISBN 978-1-4503-XXXX-X/18/06. . . $15.00 https://doi.org/10.1145/1122445.1122456
The advantages of designing embedded systems while taking the interactions of safety, security and performance requirements into consideration early in the design cycle is highlighted in several approaches [18][16][27]. To study the requirements dependencies, simulation and verification shall be used as early as possible in the design process. Estimating performance at this stage of the design process is considered as “very valuable approach in the area of SoC design” [31] as it results in updating the model in a cost efficient manner [29].
Thus, the paper introduces a new technique for analyzing the impact on performance when changing a SysML model. A model change consists in adding or removing safety and security mech-anisms. Mechanisms are based on a set of software or hardware components. For example, adding encryption may result in addi-tional computation and communication time due to encryption —and decryption— functions. Also, longer messages to transfer may create additional contentions on shared resources [32]. This new analysis approach can assist the designer in tuning and adapting the model by indicating which hardware components or software functions provoke an extra latency between selected events. It can also report how much a new function is involved in this latency.
This paper is organized as follows. Section 2 discusses different model verification approaches with a focus on performance verifica-tion and on approaches with security and performance dependency. Then, Section 3 presents the SysML—Sec modeling and verification approach upon which our new contribution is based. In Section 4, our performance analysis algorithm is detailed. A Rail Carriage use case studied in the scope of the H2020 AQUAS project illustrates our contribution in Section 5. Finally, Section 6 concludes the paper.
2
RELATED WORK
Several tools exists to analyze and verify the timing properties of real-time systems. These tools are based on static or dynamic anal-ysis and verification methods [19]. Static methods don’t require model execution [19]. Static methods are used in hard real-time systems to guarantee that deadlines are met and calculate worst-case execution time [25]. Dynamic methods require the execution of the model, they are applied on soft real-time systems and are further divided into formal and simulation methods. Tools like Metropolis from Berkeley [10] implements simulation and formal verification methods while TimeSquare [12] simulate a design based on MARTE model where clock constraints are specified based on Clock Constraint Specification Language (CCSL) [9]. Some tools like Time4Sys [7] connect system modeling editors and real-time analysis tools. Tideal [30] uses Time4Sys to analyze and simulate models. In [26], high level modeling and simulation methods and
tools for system level performance evaluation of embedded systems are introduced. The approach is based on Kahn process networks (KPN). Another tool proposed in [23] for performance evaluation based on SystemC and traces analysis has a limited support for flex-ible task mapping and scheduling policies. Ptolemy framework [13] is used to model, design and simulate the interactions of concurrent real-time components in embedded systems. In [17] a modeling and simulation methodology for complex embedded systems based on NS-2/SystemC integration is presented. Inspired by [17], Sys-temC and OMNeT++ are combined in [24] to form a cosimulation framework for a distributed system of systems.
Several contributions specifically address the impact of security on performance. In [32], a cross-layer design framework combines control-theoretic methods and cybersecurity techniques. The result of this framework is a Pareto front between two normalized metrics representing control performance and security level. The provided region denotes all feasible solutions for the requirements under study, an important output for making decision choices. Another ap-proach presented in [21] addresses automotive security and timing constraints for message exchange. This approach takes a task graph as input and computes a task allocation and scheduling by taking security and schedulability into account. To evaluate the impact of security on performance in modern systems, Fujdiak et al. [16] rely on experimental measurements. Their results demonstrate a linear relation between security levels and performance. The authors of [15] propose the interaction of two tools to study the link between security requirements and their impact on performance, and help deciding high-level metrics to better capture the performance of security mechanisms. The authors are thus able to compare the performance of system models for different security levels.
To deal with requirements of different kind (safety, security, performance), industrial and academic partners collaborated on several projects including MERgE [2], Sesamo [3], CRYSTAL [6]. While most of these projects considered the relation between safety and security, some also added performance to the scope like, for example, SAFURE [8], AMASS [28], EVITA [1] and AQUAS [4].
Nevertheless, to the best of our knowledge, the aforementioned works do not address a tool in which safety and security require-ments can be verified along with their detailed impact on perfor-mance. The detailed impact on performance can be achieved by identifying which components lead to extra processing time or hardware contention, and providing designers with advices on how to improve the model while satisfying safety/security and perfor-mance requirements.
3
SYSML-SEC
3.1
Method
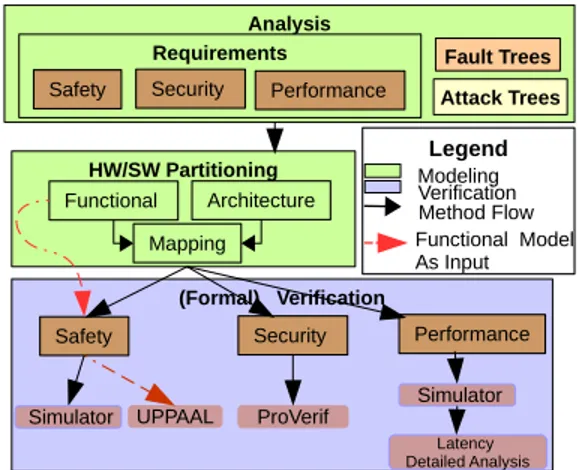
TTool [5] is a free and open source framework for the design and verification of embedded systems. SysML-Sec is one of the mod-eling profiles supported by TTool. SysML-Sec is used to design safe and secure embedded systems while taking performance into account. In the first stage of SysML-Sec (Figure 1), requirements are identified and explicitly tagged as safety, security or performance. Also, in this step, attacks that could target the system and faults that could occur in the system are modeled in attack and fault trees
Legend Modeling Verification Method Flow Functional Model As Input Analysis Attack Trees Fault Trees HW/SW Partitioning Functional Architecture Mapping Requirements
Safety Security Performance
(Formal) Verification Performance ProVerif UPPAAL Safety Security Simulator Latency Detailed Analysis Simulator
Figure 1: SysML-Sec modeling profile used in TTool
respectively. Next, in the HW/SW partitioning step, the architec-ture and high-level functional behavior are modeled before being linked in the mapping phase: this step helps deciding how functions should be split between hardware and software mechanisms, and how communications between functions are realized using physi-cal elements. Second, the design of the software elements can be performed in the software design stage: functions mapped to proces-sors are expected to be refined as software components. Verification can be performed with a press-button approach from most views so as to check that all requirements are satisfied. TTool can perform verifications using formal techniques (e.g., model-checking) and simulations. Safety verification relies on the TTool model checker or on UPPAAL. Security verification relies on the ProVerif [11] external toolkit. Performance verification relies on a System-C like simulator provided by TTool. Once a model has been verified, C code generation can be performed from partitioning models or from software design.
3.2
HW/SW partitioning
A HW/SW partitioning is formally defined as the composition of a Functional view, an Architecture Model and a Mapping Model [20]. In the functional view, composite components (colored in yel-low) serve as containers for primitive components. Primitive com-ponents (green), also referred to as tasks, have attributes and be-haviors assigned to them. The behavior is described by an activity diagram built upon a set of operators. Operators can be divided into 3 categories.
(1) Control operators: handle the execution flow of a task e.g. loops.
(2) Complexity operators: intend to facilitate the modeling of algorithms’ complexity in terms of, e.g., integer operations (ExecI).
(3) Communication operators: Channels, Events or Requests. •Channels: model data exchange. As we are considering
a high level of abstraction, only the amount of data is considered not the data values. There are 3 possible types of channels [14]:
SysML Models: Studying Safety and Security Measures Impact on Performance Using Graph Tainting MoDeVVa ’20, October 18–23, 2020, Montreal, Canada
(a) Blocking Read — Non Blocking Write (BR-NBW): this is equivalent to an infinite FIFO buffer between the sender and receiver task. The sender can write infinite times while the receiver task blocks when attempting to read from an empty channel.
(b) Non Blocking Read — Non Blocking Write (NBR-NBW): this is equivalent to a shared memory of infinite size between the sender and receiver task. The sender can infinitely write and the receiver never blocks when at-tempting to read.
(c) Blocking Read — Blocking Write (BR-BW): this is equiv-alent to a finite FIFO buffer between the sender and receiver. The sender blocks when attempting to write to a full channel and the receiver task blocks when at-tempting to read from an empty one.
• Events: used for synchronization between two tasks. Events arriving at a given task can be managed in 3 ways: (a) Infinite FIFO: events are never lost.
(b) Non Blocking finite FIFO: when the FIFO is full, the first (oldest) element is removed from the FIFO and the new one is added.
(c) Blocking finite FIFO: when the FIFO is full, no event is added until the FIFO is not full. The event sender is blocked until the event is added to the FIFO.
• Requests: used to model task spawning. Requests arriving at a given task are stored in an infinite FIFO; they are never lost. Requests are never blocking for the sender task. An Architecture Model is built upon a set of parametrized hard-ware nodes and physical links between nodes. Hardhard-ware nodes are split into three categories:
(1) Execution nodes: Hardware Accelerators, CPUs, FPGAs. . . (2) Communication nodes: Buses, Bridges. . .
(3) Storage nodes: Memories
A mapping model allocates tasks and communications to hard-ware components. Tasks mapped to processors are softhard-ware imple-mented while tasks mapped to Hardware Accelerators or FPGAs are hardware implemented. The semantics of hardware nodes can be customized with parameters. The high level semantics of these nodes makes it possible to perform formal verifications or fast transaction-based simulations.
3.3
Performance Evaluation
Performance evaluation mostly consists in generating simulation traces from a given SysML mapping, and then analyzing these traces. Trace analysis helps figuring out performance parameters of the hardware nodes (e.g. processor and bus load) but also how the application behaves. There, one important application metrics is the latency between two events executing within the application, as shown in [20]. While in some simple cases having the min/max latency can be beneficial for the designer, in other complex cases, especially when new safety and security measures are added to the model, having only the min/max delay between operators doesn’t help much the designer on the precise cause of the latencies or on how to enhance the model to further improve performance. For this, the performance evaluation technique of TTool has been updated in [33]. Transaction 1 Transaction n Latency Directed Graph
Simulation Trace Analysis (STA) Mapping 1 M ap pin g 1 CPU_S Bus CPU_R θA θB Simulation D et ai le d L at en cy A n aly sis chl S2R_CHANNEL(4) evt S2R_EVENT()
Loop for ever
chl
R2C_CHANNEL(4)
Figure 2: Detailed Latency Analysis Technique added to SysML-Sec
The enhanced performance analysis technique analyzes the sim-ulation traces of a SysML mapping model to show which elements of the platform contributed to the latency value. The main algorithm named Simulation Trace Analysis (STA) takes as input (Figure 2): (1) the simulation trace (2) a generated latency graph corresponding to the mapping model and (3) two operators — named θAand θB
— selected by the user to study the latency across them. Operators are defined in Section 3.2. The output of STA is two arrays of trans-actions: mandatory transactions and non-mandatory transactions. The mandatory transactions are the transactions that should be executed after the first operator and are mandatory for the second operator to execute. Non-mandatory transactions are those related to the same hardware as either one of the two operators, they are not mandatory to execute and might contribute to an additional latency that can be eliminated between the two operators. More details on mandatory and non-mandatory transactions is given in Section 4.1.
4
DETAILED LATENCY ANALYSIS
TECHNIQUE (DLAT)
4.1
Simulation Trace
A mapping model p is simulated for a time interval using TTool simulator. TTool simulator [19] is transaction-based. A transaction represents a computation or communication operation in the task activity diagram. Control flow operators do not have a correspond-ing transaction since we assume that they are executed in zero time. After simulating the model, the executed transactions can be saved in a simulation trace spaccording to their start times. Thus a simulation trace is defined as a set of simulation transactions where each simulation transaction contains the following attributes:
•device, task and operator: defines to which task/operator the transaction belongs and on which hardware node it was executed.
•runnableTime (in clock cycles): defines the absolute time at which the transaction is ready to be executed. This attribute is independent of shared resource contention.
•length: number of clock cycles needed to execute the trans-action.
•startTime and endTime (in clock cycles): define the time at which the hardware node started and ended the transaction execution. In case of hardware congestion, a transaction may be postponed, thus delaying its start time. endTime is calculated as: startTime+ length+ Penalties. Penalties represent the time taken by the OS and the CPU hardware to go idle and the time taken by the OS for a context switch (Task switching time).
Simulating the mapping of Figure 2 for 402 cycles results in 90 trans-actions. An excerpt of the simulation trace showing six transactions is shown in Figure 6(a).
4.2
Latency Analysis Using Graph Tainting
The Detailed Latency Analysis Technique (Figure 2) already imple-mented in TTool [33] helps the designer to investigate the model performance and the cause of delay between two operators θAand θB. However, it is based on the assumption that the two opera-tors have a one-to-one relation. In other words, it assumes that the ithoccurrence of the second operator θBcorresponds to the ith occurrence of the first operator θA. While this assumption holds for some use cases as shown in [33], removing this assumption opens new avenues. To overcome the one-to-one limitation, a new analysis technique is defined in this section. This analysis is now based on graph tainting. In addition, our new contribution takes into account contentions on communication and storage nodes and identifies in its output the transactions that caused extra delays due to contentions on communication and storage nodes.
Similar to Figure 2, the Detailed Latency Analysis based on graph tainting has a main algorithm named Simulation Trace Analysis-Graph Tainting (STA-GT). STA-GT (detailed in Section 4.4) takes as inputs:
(1) A Latency Graph: To analyze the dependencies and rela-tion between the transacrela-tions in a simularela-tion trace, a SysML mapping model is translated into a directed graph. Vertices of this graph are tainted with the STA-GT algorithm (Sec-tion 4.3).
(2) A Simulation Trace: TTool simulator generates a simula-tion trace of the considered mapping model (Secsimula-tion 4.1). (3) 2 operators: The designer selects two operators (θAand θB)
between which he wishes to study the latency. These opera-tors must be part of the activity diagram of the considered tasks (Section 3.2).
4.3
Latency Graph
The first step in DLAT is generating a directed graph from the mapping model.
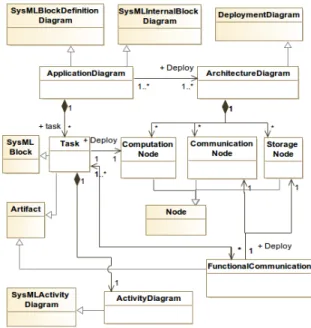
As shown in figure 3, the architecture model is a UML Deploy-ment Diagram built upon a set of connected nodes that represent
Figure 3: Section of the Metamodel Diagram of SysML-Sec Methodology
resources. These nodes are divided into 3 categories: computation, communication and storage nodes. The functional view is built on a set of tasks interconnected by data and control ports and chan-nels. It is defined by SysML Block Definition and Internal Block Diagrams. Each task is defined by a SysMLBlock and its internal behavior is a sequence of actions (activity diagram) defined in a SysML Activity diagram. In the mapping model, tasks along with their communication channels are allocated on the Nodes of the architecture model.
Throughout this section, the mapping displayed at the top of Figure 2 is considered. The functional view corresponding to this mapping is shown in Figure 4, with block instances at the top and related activity diagrams below blocks. This toy example illustrates sending an event then data from one task (ST ASK) to another task (RT ASK). In RT ASK, the data is received, a computation is done and data is send to a third task (CT ASK). T I MER is a "toy competing task" that runs a delay of 1ns added to create contentions on its host CPU. The latter task was omitted from Figure 4 to keep it readable.
A Latency Graph (G) is a directed graph consisting of a set of vertices ν and a set of directed edges ϵ: G= (ν, ϵ). G is built from a mapping model. For instance, the directed graph of the toy example is shown in Figure 5 (T I MER task omitted). A vertex is added to G for each hardware node i.e. for computation, communication or storage node (Bus0, CPU _R, CPU _S, Memory0). Then for every task mapped to a node, a vertex is added. Moreover, a directed edge is added from the corresponding node vertex to the added task vertex to represent the mapping. The same is applied for mapped communication channels. For example, considering the mapping in Figure 2 : CT ASK vertex is added and CPU _R vertex connected to it, S2R_CHAN N EL vertex is added and Bus0 vertex connected to it in Figure 5. This approach is applied to all model elements including activity diagrams.
SysML Models: Studying Safety and Security Measures Impact on Performance Using Graph Tainting MoDeVVa ’20, October 18–23, 2020, Montreal, Canada
STASK S2R_CHANNEL RTASK
+ x = 0 : Natural;R2C_CHANNEL CTASK S2R_EVENT chl S2R_CHANNEL(4) evt
S2R_EVENT() Loop for ever
chl R2C_CHANNEL(4) evt S2R_EVENT() S2R_CHANNEL(4) Loop 5 times inside loop exit loop [x<2] [else] x=x+1 10 20 chl R2C_CHANNEL(4)
Figure 4: Functional view and Activity Diagrams of figure 2 Mapping
Figure 5: Directed Graph
For every action in the activity diagram, a vertex is added along with the required edges to preserve the sequence on the control flow. In addition, directed edges are added to represent the logical connections between tasks (i.e. events and requests. For exam-ple: Send Event "ST ASK .send (S2R_EV ENT )" is directly connected to Receive Event "RT ASK .wait (S2R_EV ENT )". For the channels, directed edges are added between the read/write channel action and the vertex that correspond to the communication channel. In figure 5, ST ASK .write (S2R_CHAN N EL, 4) vertex is connected to S2R_CHAN N EL vertex.
In the mapping model a unique ID is given to each element. This ID combined with the name of the element serve as the key value of each vertex in G. To implement the tainting within G, in addition to
{
{
{
(a)
(b)
Figure 6: (a) Six Simulation Transactions (b) Tainting Part of Directed Graph
the vertex ID, basic attributes are added to vertices. These attributes are:
(1) type: identifies to which kind of element of a mapping model each vertex corresponds: Node, task, for ever loop, for loop, control, channel, start, end, choice, sequence, unordered se-quence or transaction operator. . .
(2) taintValues: stores the taint values of a vertex. Every taint value is unique within a DLAT. An 8-byte unique taintValue is generated whenever a transaction related to the first oper-ator (θA) is encountered in the simulation trace. The gener-ated taintValue is added to the taintValues attribute of the vertex corresponding the first operator. The taintValue is propagated to other vertices as discussed in section 4.4. (3) taintFixedNumber (fixedNbr): is the default number of
times this vertex is considered in calculating the delay be-tween two operators per taintValue. The fixedNbr is 1 for all vertex types except for “for loops” where it is equal to the number of iterations and for “for ever loop” where it is equal to integer maximum value. For example in figure 5, the vertex “RT ASK . f or Loop (5)” fixedNbr is 5. The fixedNbr is used to determine the maxNbr introduced next. (4) taintMaxNumber (maxNbr): stores the maximum number
of times this vertex is considered in calculating the delay between two operators per taintValue (i.e in the presence of loops). The maxNbr differs from the fixedNbr when the vertex is inside a loop. For example in figure 5, if the vertex “RT ASK . f or Loop (5)” is tainted, its fixedNbr is 5, the maxNbr for “RT ASK .action(x= x+1)” is f ixedNbr(RT ASK .f or Loop (5))
∗f ixedNbr(RT ASK .action(x=x+1))= 5 ∗ 1 = 5.
(5) taintConsideredNumber (conNbr): identifies the number of times this vertex is already considered in calculating the delay between two operators per taintValue.
The STA-GT algorithm detailed in the following section shows the use of these different attributes. Note that the type and fixedNbr attributes are set during graph generation when a vertex is added. In the scope of this paper, the communication semantics of finite
FIFO buffer where read/write channels, send/receive events or re-quest can be overwritten in the buffer are not (yet) handled in the graph vertices. We intend to address this limitation in future work.
4.4
Simulation Trace Analysis-Graph Tainting
(STA-GT)
Let’s consider a simulation trace sp. To study in sp the latency between two operators θAand θBdefined in the mapping model p, the simulation transactions in spare ordered according to their start time. In case several transactions have the same start time, the transactions are further ordered according to their end time. The order of considering transactions that have the same start and end time is indifferent as in the simulator only transactions with earlier end time may alter later transactions due to the cause and effect policy [19].
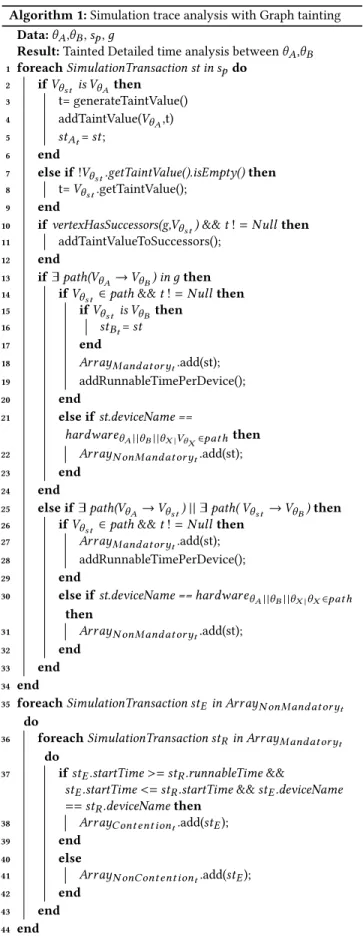
Algorithm 1 performs the simulation trace analysis using graph tainting to calculate the latency between two operators θAand θB. The delay between the occurrence of θAand θBis calculated based on the propagation of a taint value along the generated directed graph. In addition, algorithm 1 highlights for the designer which hardware component or software function contributed in increas-ing the delay between θAand θB. In this algorithm, the transactions in sp are considered sequentially. For each transaction its corre-sponding operator, startTime, endTime, device and runnableTime are used to determine if the transaction contributed to extra delay between θAand θBexecution and whether its corresponding vertex should be tainted with a taintValue.
For every taintValue (t ) added to the vertex corresponding to θA
(VθA) we should have:
•a simulation transaction (stAt) where st .operator= θA: this situation leads to adding (t ) to VθA
•a simulation transaction (stBt) where st .operator = θB: this simulation transaction is encountered after (t ) is propagated to VθB
•an array of simulation transactions that were executed af-ter the occurrence of the stAt, and are mandatory for stBt occurrence (ArrayMandatory).
•an array of simulation transactions that don’t belong to arrayMandatory, but that are in the simulation trace sp and occurred between stAt, and stBt. This array (ArrayN onMandatory) is further split into two sub arrays: – ArrayContention: contains transactions that have delayed
the execution of transactions from ArrayMandatory be-cause of a contention on a shared and common execution node.
– ArrayN onContention: contains transactions from ArrayN onMandatory that don’t belong to ArrayContention, i.e. transactions that have used hardware execution nodes without impacting the delay between the operators under study.
Using the output of algorithm 1, the latency λtbetween θAand θBfor a taint value t is computed as:
λt= endTimestBt −startT imestAt (1) To show how a taint value propagates along a generated graph, lets consider the example given previously. let θAbe the writing
channel S2R_CHAN N EL operator in ST ASK task and θBbe the reading channel R2C_CHAN N EL operator in CT ASK task. VθA and VθB are colored green in Figure 5. In this example, the one-to-one relation between θAand θB doesn’t hold since the data channels S2R_CHAN N EL and R2C_CHAN N EL are Non Blocking Read — Non Blocking Write (Section 3). Thus, in the simulation trace multiple simulation transactions corresponding to reading these channels may exist before writing them (first 2 transactons in Figure 6(a)). To calculate the latency algorithm 1 is used.
A taintValue is generated whenever a simulation transaction (st) where st .operator = θAis encountered. The generated taint-Value is added to the tainttaint-Values attribute of VθA. The taintVal-ues attribute of VθA contains a unique taintValue for every oc-currence of st .operator = θA in sp. In Figure 6, a taintValue (t ), presented in purple circle, is added to VθAonce a simulation transaction with st .operator = θAis encountered in sp (second simulation transaction in Figure 6(a)). In addition to adding t to VθA, t is propagated to all successors vertices of VθA(shown in red arrows in Figure 6(b)) and max Nbr determined for each. A successor vertex is a vertex connected by one incoming edge from VθA. In Figure 6, t is propagated to VS2R_CH AN N EL corre-sponding to communication on BU S0 and to VST ASK .stop. The conNbr for a vertex is incremented by one once its successors are tainted. conNbr of a vertex is compared to its max Nbr to check if this vertex can still be considered for t . Once st .operator = VS2R_CH AN N ELis encountered after VθAand VS2R_CH AN N ELare tainted with t (third simulation transaction in Figure 6(a)), t is propagated to VRT ASK .r ead (S2R_CH AN N EL,4)(shown in green ar-row in Figure 6(b)). When a simulation transaction corresponding to VRT ASK .r ead (S2R_CH AN N EL,4)is encountered (fifth simulation transaction in Figure 6(a)), and VRT ASK .r ead (S2R_CH AN N EL,4)is tainted with t , then this simulation trace corresponds to reading the tainted data. t is propagated to VRT ASK .f or Loop (5)(navy color ar-row in figure 6(b)). As no transactions corresponds to control opera-tors including “for loops”, t is propagated to VRT ASK .action(x=x+1) where the max Nbr is also set to 5 since it falls inside a for loop.
The conNbr for the RT ASK . f or Loop (5) will be incremented after all the vertex inside the loop are considered once. Ver-texes corresponding to control operators are tainted and their conNbr is updated in order to maintain the progress of a taint value across the graph according to the functional logic in the mapping. The vertex corresponding to the exit of the loop (RT ASK .write (R2CCHAN N EL, 4) in our case) will be tainted after the conNbr for the RT ASK . f or Loop (5) equals its max Nbr .
We consider reading channel R2C_CHAN N EL in CT ASK task to be θB. t will be transmitted to VCT ASK .r ead (R2C_CH AN N EL,4)
after R2C_CHAN N EL is tainted. The simulation transaction where st .operator = θB, encountered after t is propagated to VθB, is used to calculate the latency λt.
Algorithm 1 (lines 13 — 34) is executed to fill ArrayMandatory
and ArrayN onMandatory. The first step is to check if VθAand VθB are connected by at least one path in the graph G. A path is defined as a sequence of vertices such that each vertex in the sequence is connected with directed edge to vertex next to it. This sequence should start with VθAand end with VθBto say that we have a path between VθAand VθB. For every simulation transaction added to
SysML Models: Studying Safety and Security Measures Impact on Performance Using Graph Tainting MoDeVVa ’20, October 18–23, 2020, Montreal, Canada
Table 1: Time Values of Two Simulation Transaction in Fig-ure 6
runnableT ime starttime endtime
sti 1 200 202
stii 200 300 302
Table 2: The Tainting Progress
Vθ B Vθ A VS 2 R _C VT IM E R Vθ B Vθst is VθA? NO YES NO NO NO Vθst is VθB? YES NO NO NO YES t= Null? YES NO NO NO NO
vertexHasSuccessors (д, Vθst)? − YES YES − YES
Vθst ∈path? − YES YES NO YES
add (st ) to ArrayMandatoryt? − YES YES NO YES
add (st ) to ArrayN onMandatt? − − − YES NO
ArrayMandatoryits runnableTime and startTime are saved to be used to divide ArrayN onMandatorybetween ArrayContention
and ArrayN onContention(Algorithm 1: lines 35 — 44). Generally speaking, if the runnableTime and startTime values of a transaction don’t match, it means that the simulator scheduled a transaction but didn’t execute it since the resource was busy.
Lets consider the fourth and sixth transaction in the excerpt of the simulation trace of the example introduced before (Fig-ure 6). We refer to the fourth simulation transaction as sti and the sixth as stii. The simulation transactions sti and stii be-long to ArrayN onMandatory and ArrayMandatory respectively. sti and stii are executed on the same hardware. sti is exe-cuted at cycle 200 between the runnableTime (200) and start-Time (300) of stii(Table 1). Thus sti caused a delay in a manda-tory transaction stii, so sti is added to ArrayContention.Table 2 summarize the main points that the tainting algorithm checks for each simulation transaction. The second column corre-spond to VCT ASK .r ead (R2C_CH AN N EL,4)(VθB) encountered before VθA. Then VθA, VS2R_CH AN N EL and VT I M ER are considered in columns 3,4 and 5. Column 6 represent a simulation trace where st .operator = VCT ASK .r ead (R2C_CH AN N EL,4)however this time VR2C_CH AN N ELis considered to be tainted.
4.5
Graphical Interface
DLAT is implemented within TTool [5]. TTool enables the designer to simulate the model through graphical interface. The simulation trace can be saved in xml format. DLAT can be initiated on the saved simulation trace within TTool with a mouse click on the simulation trace name. Once DLAT is initiated on the simuation trace, the graph corresponding to the model is automatically generated in the background. The designer is informed of the number of edges and vertices of the graph. VθAand VθBare then chosen from drop
Figure 7: Latency Displayed in Tabular Format
Figure 8: DLAT output showing No Contention
Figure 9: DLAT output showing Contention
down list to run ST A_GT . Thanks to ST A_GT output, the latency λtfor each taint t is calculated and displayed along startT imestAt and endT imestBt in tabular format. Figure 7 shows us the latency between writing channel S2R_CHAN N EL operator in ST ASK task and reading channel R2C_CHAN N EL operator in CT ASK task of the previous example. The latency λtin this case is 281 cycles. In addition to λt, the arrays ArrayMandatory, ArrayContention and ArrayN onContention for each λt are also displayed in a tabular format.
Transactions in these arrays are placed according to their ex-ecution time and device, and colored according to which array they belong. Those that belong to ArrayMandatory are colored green since they are essential for stBt execution, others that be-long to ArrayN onContentionare colored orange since in this sim-ulation they didn’t delay other transactions while the ones that belong to ArrayContention are colored red as they caused con-tentions on hardware nodes. Figure 8 shows simulation traces in ArrayN onContentionand ArrayMandatory. However in time-slot 201 (figure 9) the RT ASK function was scheduled to execute but found the resource CPU _R busy executing T I MER task, thus the simulation trace corresponding to the T I MER operator is colored red. Thanks to this display, the designer can directly identify which transactions are causing an increase in the latency between the ex-ecution of two operators and quickly spot contention on hardware nodes.
As mentioned previously, ideally we should have stBt for each taintValue (t ) of VθA. However if the simulation was stopped before VθBis tainted, a message indicating “no transaction was found for this taint” is shown to the user.
5
CASE STUDY
We illustrate the benefits of graph tainting with the Rail Carriage Mechanisms use case defined in the scope of the H2020 AQUAS project [4], with a focus on the control of automatic platform gates. The system consists of Lidars with their processing units, a main computing unit, a relay and a PSD (Platform Screen Doors) controller. The Lidars are divided in two categories. Positioning Lidars scan for a train presence and door Lidars scan the train doors
Algorithm 1: Simulation trace analysis with Graph tainting Data: θA,θB, sp, д
Result: Tainted Detailed time analysis between θA,θB
1 foreach SimulationTransaction st in spdo 2 if Vθstis VθAthen 3 t= generateTaintValue() 4 addTaintValue(VθA,t) 5 stAt= st ; 6 end
7 else if !Vθst.getTaintValue().isEmpty() then
8 t= Vθ
st.getTaintValue();
9 end
10 if vertexHasSuccessors(g,Vθst) && t != Null then 11 addTaintValueToSuccessors();
12 end
13 if ∃ path(VθA→VθB) in д then 14 if Vθst ∈path && t != Null then
15 if Vθ
st is VθB then
16 stBt= st
17 end
18 ArrayMandatoryt.add(st);
19 addRunnableTimePerDevice();
20 end
21 else if st.deviceName ==
hardwareθA| |θB| |θX |VθX∈paththen 22 ArrayN onMandatoryt.add(st);
23 end
24 end
25 else if ∃ path(Vθ
A→Vθst) || ∃ path( Vθst →VθB) then 26 if Vθst ∈path && t != Null then
27 ArrayMandatoryt.add(st);
28 addRunnableTimePerDevice();
29 end
30 else if st.deviceName == hardwareθA| |θB| |θX |θX∈path then
31 ArrayN onMandatoryt.add(st);
32 end
33 end
34 end
35 foreach SimulationTransaction stEin ArrayN onMandatory t do
36 foreach SimulationTransaction stRin ArrayMandatory t do
37 if stE.startTime >= stR.runnableTime &&
stE.startTime <= stR.startTime && stE.deviceName == stR.deviceName then
38 ArrayContentiont.add(stE);
39 end
40 else
41 ArrayN onContentiont.add(stE);
42 end
43 end
44 end
to determine their status. The processing unit of the positioning Lidars calculates the position and the speed of the train once it is present while the processing unit of the door Lidars detects the state of doors e.g. opening, open, closing and closed. The main computing unit gathers data from the Lidars processing units and issues orders to relays to open or close the platform screening doors. This open/close authorization is sent to the PSD controller through the relay.
Our design captures four Lidars (2 positioning Lidars and 2 door Lidars). We also consider the four following requirements:
(1) Req_1: The delay between sending the data from the posi-tioning Lidar and the relay receiving the order from the main computing unit shall be less than 130ms (safety requirement) (2) Req_2: The delay between sending the data from the posi-tioning Lidar and processing it in the corresponding process-ing unit shall be less than 85ms. (safety requirement) (3) Req_3: Data sent from the Lidars processing units (speed
and direction, or door status) to the main computing unit should remain authentic (security requirement)
(4) Req_4: Data sent from the Lidars to their corresponding processing units should remain confidential (security re-quirement)
5.1
HW/SW partitioning models
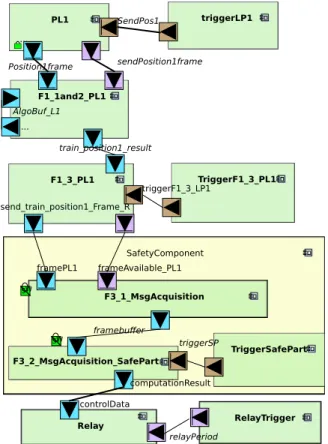
Figure 10 shows the functional view of the use case where only one Lidar is presented. The primitive component PL1 is used to repre-sent sending data by the first positioning Lidar. PL1 sends 1 frame of data once triggered by triggerPL1 every 67ms. This frame is received by another primitive component named F1_1and2_PL1 where the frame is copied to the algorithm buffer then checked for validity by checking its length and CRC calculation. After being checked, a de-tection algorithm is run that includes rotational mapping, filters and pattern detection. The computation complexity of this algorithm is modeled in the activity diagram using complexity operators (Sec-tion 3). F1_3_PL1 reads the output of the detec(Sec-tion algorithm, runs CRC calculation and sends a message to the F3_1_MsgAcquisition component. F1_3_PL1 is triggered every 50ms. F1_1and2_PL1 and F1_3_PL1 represent the functionality of the positioning lidar pro-cessing unit. All these blocks are duplicated for the 3 remaining Lidars. The door Lidars are triggered every 20ms.
F3_1_MsgAcquisition is a primitive component in a composite component named SafetyComponent. F3_1_MsgAcquisition reads data from F1_3_PL1. The same applies for the data received from the other 3 Lidars processing unit functions. In the composite com-ponent SafetyComcom-ponent, another primitive comcom-ponent named F3_2_MsgAcquisition_SafePart is a redundant function added to the model to ensure safety. F3_2_MsgAcquisition_SafePart is trig-gered every 50ms. It runs a validity check and a sequence algorithm (represented by computation complexity) to compute the adequate result to be sent to Relay. The later is triggered every 33 ms.
The architecture of the system is as follows. Each Lidar is cap-tured by its own set of processors, buses, memories, while the safety platform is built upon a CPU (MainCPU ) and 2 memories: Main-Memory and RelayMain-Memory. The mapping model associates LIDAR blocks triggerPL1, PL1, F1_1and2_PL1 and F1_3_PL1 and their com-munications to their corresponding hardware while safety blocks
SysML Models: Studying Safety and Security Measures Impact on Performance Using Graph Tainting MoDeVVa ’20, October 18–23, 2020, Montreal, Canada SafetyComponent F3_1_MsgAcquisition frameAvailable_PL1 framePL1 F3_2_MsgAcquisition_SafePart computationResult TriggerSafePart TriggerF1_3_PL1 triggerF1_3_LP1 F1_1and2_PL1 ... PL1 ... Relay controlData triggerLP1 F1_3_PL1 send_train_position1_Frame_R RelayTrigger SendPos1 sendPosition1frame Position1frame AlgoBuf_L1 train_position1_result framebuffer relayPeriod triggerSP SW SW
Figure 10: Functional view of Rail Carriage Mechanisms Use Case
are mapped to MainCPU. A share memory helps exchanging data between a MainCPU and Relay.
5.2
System verification
The System Under Analysis (SUA) is supposed to run at 80 MHz. TTool was used to simulate it on a Intel Core i7–7820HQ CPU run-ning at 2.9 GHz. 150 ms of the SUA execution have been simulated; the simulation trace contains 19575 transactions and is saved in xml format. A duration of 150 ms is chosen since it is the minimum duration that permit us to validate Req_1 using DLAT. DLAT is used to validate Req_1 since the computationResult −ControlData channel in Figure 10 is Non Blocking Read — Non Blocking Write (NBR-NBW). This means — as mentioned previously — that it is equivalent to a shared memory between the sender and the receiver. In other words, the receiver task is not blocked if the sender didn’t send data on the channel. Thus, tainting should be used to trace when the control data is computed based on the position frame input. So data sent from PL1 should be tainted to calculate the exact time delay between θAand θB. Sending a frame from the Position-ing Lidar (request “SendPos1” in triggerPL1) is θAin Req_1 and the relay receiving a control signal to send to the PSD (channel “controlData” in Relay) is θB. STA_GT requires as input: the sim-ulation trace, the generated latency graph of the model, and the 2 operators θAand θB. The latency graph д corresponding to the model is generated based on the algorithm presented in [33]. In
this use case, the latency graph is composed of 244 vertices and 393 edges.
The latency between θAand θBcan be calculated whenever VθB is tainted with the same taint value as θAand the conNbr of VθB is greater than 0. Based on algorithm 1, the latency between θA
and θBis 10170380 cycles (127.1 ms). Thus Req_1 is satisfied. The latency corresponding to Req_2 is 681372 cycles (8.51 ms) thus Req_2 is not satisfied.
To validate the authenticity of the data sent from F1_3_PL1 to F3_1_MsgAcquisition and from F3_1_MsgAcquisition to F3_2_MsgAcquisition_SafePart (Req_3), and the confidentiality between PL1 and F1_3_PL1 (Req_4), the formal security verifica-tion of TTool/ProVerif is used. The latter proves that Req_3 and Req_4 are not satisfied and shows it to the user by adding a red lock on the concerned data channels. To ensure the authenticity property on these channels, CRC is replaced by HMAC-SHA256 in F1_3_PL1. [20] describes how a security operator can be added in TTool to represent HMAC-SHA256. To determine the computation complexity of HMAC-SHA256 (i.e. 8322 clock cycles), we have used the technique described in [15] and relying on SSDLC (Secure Software Development Life Cycle). The overhead of the message is set to 256 bits.
To ensure the confidentiality property on the channel between PL1 and F1_3_PL1 (Req_4) encryption/decryption operators are added. We chose the AES algorithm in Cipher Block Chaining (CBC) mode and set the computational complexity to 3000 as indicated in [15].
By adding authenticity and confidentiality mechanisms, we could formally prove that (Req_3) and (Req_4) are now satisfied. The concerned data channels are annotated with green locks in figure 10. In TTool, channels can be either private or public and only attacks on public channels are considered [22].
We run again DLAT along with its new model and new simula-tion trace. The time delay corresponding to Req_1 is now 10249025 cycles (128.1 ms) while the time delay corresponding to Req_2 is 683551 cycles (8.54 ms). The increase of the time delay of Req_2 is due to the added encryption/decryption operators and the increase of the time delay of Req_1 is due to the scheduling policy of the mainCPU. The details corresponding to the increase or decrease of the time delay are displayed in the output table of DLAT.
To satisfy Req_2 while keeping the confidentiality property of Req_4 valid, we replace AES CBC with AES CTR (counter mode). The computational complexity is now set to 428 cycles. This value is obtained by applying the same interaction as indicated in [15]. The security verification indicates that the confidentiality property still hold. The latency was recalculated in a similar manner as mentioned before. The maximum delay corresponding to Req_2 now is 678029 cycles (8.47 ms). The maximum delay of Req_1 wasn’t effected as the latency for Req_1 depend on the trigger time and scheduling policy of mainCPU.
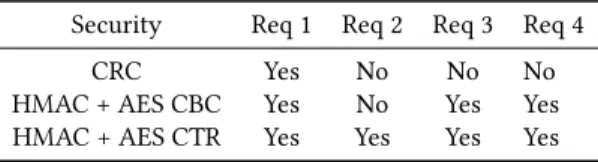
Table 3 summarizes the result of each requirement along each tested model in this use case. While replacing AES CBC with AES CTR mode enhanced performance by decreasing the latency pro-portionally to the decrease in the computational complexity cycles, several other methods can be tested in case further performance enhancement is required, e.g. by adding hardware accelerators for cryptographic functions, by using other security algorithms, by
Table 3: Requirement Satisfaction Summary table
Security Req 1 Req 2 Req 3 Req 4
CRC Yes No No No
HMAC + AES CBC Yes No Yes Yes
HMAC + AES CTR Yes Yes Yes Yes
trying a different mapping, by adjusting the scheduling policy of CPUs or buses, of by using more powerful processing units, . . . . After applying the required enhancements, the designer can simu-late the model and run the verification process again to test if the requirements still hold.
6
CONCLUSION AND PERSPECTIVES
To accurately study the impact of safety/security measures on per-formance when designing an embedded system, an approach named Detailed Latency Analysis Technique based on graph tainting has been described. It is intended to be used at a high level of abstrac-tion, thus giving early design guarantees. Its main idea is to model systems at a high level of abstraction and then simulating them. Simulation traces are then used to gradually taint a generated di-rected graph that corresponds to the model under investigation. Depending on the tainting progress, the latency between two events in the model can be evaluated. Studying this latency using tainting not only reveals the delay between the events under study but also highlights in a clear way which model components are involved in this delay. Last but not least, the approach is now implemented in SysML-Sec.
The object of our future work is to enhance the graph generation to consider other functional-level communication semantics and to settle an automated search for a solution satisfying safety/security requirements while minimizing system latency.
ACKNOWLEDGEMENTS
The AQUAS project is funded by ECSEL JU under grant agreement No 737475
REFERENCES
[1] 2008-2011. EVITA E-safety vehicle intrusion protected applications. Retrieved May 7, 2020 from https://www.evita-project.org/index.html
[2] 2012-2016. MERGE: multi-concerns interactions system engineering. Retrieved May, 2019 from http://www.merge-project.eu/
[3] 2012-2016. SESAMO: security and safety modelling. Retrieved May, 2019 from http://sesamo-project.eu/
[4] 2013. Aggregated Quality Assurance for Systems (AQUAS). Retrieved May 7, 2020 from https://aquas-project.eu
[5] 2013. TTool. Retrieved May 7, 2020 from https://ttool.telecom-paris.fr [6] 2013-2016. CRYSTAL - CRITICAL SYSTEM ENGINEERING ACCELERATION.
Retrieved May 9, 2020 from http://www.crystal-artemis.eu/
[7] 2015. Time4Sys. Retrieved May 7, 2020 from https://www.eclipse.org/time4sys/ [8] 2015-2018. SAFURE - Safety And Security By Design For Interconnected Mixed-Critical Cyber-Physical Systems. Retrieved May 9, 2020 from https://safure.eu/ [9] Charles André. 2009. Syntax and semantics of the clock constraint specification
language (CCSL). (2009).
[10] Felice Balarin, Yosinori Watanabe, Harry Hsieh, Luciano Lavagno, Claudio Passerone, and Alberto Sangiovanni-Vincentelli. 2003. Metropolis: An integrated electronic system design environment. Computer 36, 4 (2003), 45–52. [11] Bruno Blanchet, Ben Smyth, Vincent Cheval, and Marc Sylvestre. 2018. ProVerif
2.00: Automatic Cryptographic Protocol Verifier, User Manual and Tutorial. Ver-sion from (2018), 05–16.
[12] Julien DeAntoni and Frédéric Mallet. 2012. Timesquare: Treat your models with logical time. In International Conference on Modelling Techniques and Tools for Computer Performance Evaluation. Springer, 34–41.
[13] Johan Eker, Jörn W Janneck, Edward A Lee, Jie Liu, Xiaojun Liu, Jozsef Lud-vig, Stephen Neuendorffer, Sonia Sachs, and Yuhong Xiong. 2003. Taming heterogeneity-the Ptolemy approach. Proc. IEEE 91, 1 (2003), 127–144. [14] Andrea Enrici, Letitia Li, Ludovic Apvrille, and Dominique Blouin. 2018. A
Tutorial on TTool/DIPLODOCUS: an Open-source Toolkit for the Design of Data-flow Embedded Systems.
[15] Radek Fujdiak, Petr Blazek, Ludovic Apvrille, Zdenek Martinasek, Petr Mlynek, Renaud Pacalet, David Smekal, Pavel Mrnustik, Maros Barabas, and Maysam Zoor. 2019. Modeling the Trade-off Between Security and Performance to Support the Product Life Cycle. In 2019 8th Mediterranean Conference on Embedded Computing (MECO). IEEE, 1–6.
[16] Radek Fujdiak, Petr Mlynek, Petr Blazek, Maros Barabas, and Pavel Mrnustik. 2018. Seeking the relation between performance and security in modern systems: Metrics and measures. In 2018 41st International Conference on Telecommunications and Signal Processing (TSP). IEEE, 1–5.
[17] Franco Fummi, Giovanni Perbellini, Paolo Gallo, Massimo Poncino, Stefano Martini, and Fabio Ricciato. 2003. A timing-accurate modeling and simulation environment for networked embedded systems. In Proceedings 2003. Design Au-tomation Conference (IEEE Cat. No. 03CH37451). IEEE, 42–47.
[18] Thomas Gruber, Christoph Schmittner, Martin Matschnig, and Bernhard Fischer. 2018. Co-Engineering-in-the-Loop. In International Conference on Computer Safety, Reliability, and Security. Springer, 151–163.
[19] Daniel Knorreck. 2011. UML-based design space exploration, fast simulation and static analysis. Ph.D. Dissertation. Telecom ParisTech.
[20] Letitia Li. 2018. Approche orientée modèles pour la sûreté et la sécurité des systèmes embarqués. Ph.D. Dissertation. Paris Saclay.
[21] Chung-Wei Lin, Bowen Zheng, Qi Zhu, and Alberto Sangiovanni-Vincentelli. 2015. Security-aware design methodology and optimization for automotive systems. ACM Transactions on Design Automation of Electronic Systems (TODAES) 21, 1 (2015), 1–26.
[22] Florian Lugou, Letitia W Li, Ludovic Apvrille, and Rabéa Ameur-Boulifa. 2016. Sysml models and model transformation for security. In 2016 4th International Conference on Model-Driven Engineering and Software Development (MODEL-SWARD). IEEE, 331–338.
[23] Shankar Mahadevan, Kashif Virk, and Jan Madsen. 2007. ARTS: A SystemC-based framework for multiprocessor systems-on-chip modelling. Design Automation for Embedded Systems 11, 4 (2007), 285–311.
[24] Bernd Muller-Rathgeber and Holm Rauchfuss. 2008. A cosimulation framework for a distributed system of systems. In 2008 IEEE 68th Vehicular Technology Conference. IEEE, 1–5.
[25] Dorina C Petriu. 2010. Software model-based performance analysis. Model Driven Engineering for distributed Real-Time Systems: MARTE modelling, model transformations and their usages (JP Babau, M. Blay-Fornarino, J. Champeau, S. Robert, A. Sabetta, Eds.), ISTE Ltd and John Wiley & Sons Inc (2010).
[26] Andy D Pimentel, Cagkan Erbas, and Simon Polstra. 2006. A systematic approach to exploring embedded system architectures at multiple abstraction levels. IEEE Trans. Comput. 55, 2 (2006), 99–112.
[27] Luigi Pomante, Vittoriano Muttillo, Bohuslav Křena, Tomáš Vojnar, Filip Veljković, Pacôme Magnin, Martin Matschnig, Bernhard Fischer, Jabier Martinez, and Thomas Gruber. 2019. The AQUAS ECSEL Project Aggregated Quality Assur-ance for Systems: Co-Engineering Inside and Across the Product Life Cycle. Microprocessors and Microsystems 69 (2019), 54–67.
[28] Alejandra Ruiz, Barbara Gallina, Jose Luis de la Vara, Silvia Mazzini, and Huáscar Espinoza. 2016. Architecture-driven, multi-concern and seamless assurance and certification of cyber-physical systems. In International Conference on Computer Safety, Reliability, and Security. Springer, 311–321.
[29] Sanjit A Seshia, Shiyan Hu, Wenchao Li, and Qi Zhu. 2016. Design automation of cyber-physical systems: challenges, advances, and opportunities. IEEE Trans-actions on Computer-Aided Design of Integrated Circuits and Systems 36, 9 (2016), 1421–1434.
[30] Benoit VIAUD, Laurent RIOUX, and Aurélien DIDIER. 2020. Applying Timing Verification with TIDEAL/Time4Sys on Flight Management System. [31] Alexander Viehl, Timo Schönwald, Oliver Bringmann, and Wolfgang Rosenstiel.
2006. Formal performance analysis and simulation of UML/SysML models for ESL design. In Proceedings of the conference on Design, automation and test in Europe: Proceedings. European Design and Automation Association, 242–247. [32] Bowen Zheng, Peng Deng, Rajasekhar Anguluri, Qi Zhu, and Fabio Pasqualetti.
2016. Cross-layer codesign for secure cyber-physical systems. IEEE Transactions on Computer-Aided Design of Integrated Circuits and Systems 35, 5 (2016), 699–711. [33] Maysam Zoor., Ludovic Apvrille., and Renaud Pacalet. 2020. Impact of Security
Measures on Performance Aspects in SysML Models. In Proceedings of the 8th International Conference on Model-Driven Engineering and Software Development - Volume 1: MODELSWARD,. INSTICC, SciTePress, 373–380. https://doi.org/10. 5220/0008970203730380