Strong interaction and E2 effect in even-A antiprotonic Te atoms
B. KłosPhysics Department, Silesian University, PL-40-007 Katowice, Poland
S. Wycech
Sołtan Institute for Nuclear Studies, PL-00-681 Warsaw, Poland
A. Trzcińska, J. Jastrze¸bski, T. Czosnyka, M. Kisieliński, P. Lubiński,*P. Napiorkowski, and L. Pieńkowski
Heavy Ion Laboratory, Warsaw University, PL-02-093 Warsaw, Poland
F. J. Hartmann, B. Ketzer, R. Schmidt, and T. von Egidy
Physik-Department, Technische Universität München, D-85748 Garching, Germany
J. Cugnon
Institut de Physique, Universite de Liege au Sart Tilman, B4000 Liege 1, Belgium
K. Gulda and W. Kurcewicz
Institute of Experimental Physics, Warsaw University, PL-00-681 Warsaw, Poland
E. Widmann†
CERN, CH-1211 Geneva 23, Switzerland (Received 17 October 2003; published 19 April 2004)
The x-ray cascade from antiprotonic atoms was studied for122Te,124Te,126Te,128Te, and130Te. Widths and shifts due to the strong interaction were deduced for several levels. The E2 nuclear resonance effect was observed in all investigated nuclei. In130Te the E2 resonance allowed to determine level widths and shifts of
the LS-split deeply bound 共n,l兲=共6,5兲 state, otherwise unobservable. The measured level widths and shifts, corrected for the E2-resonance effect, were used to investigate the nucleon density in the nuclear periphery. The deduced neutron distributions are compared with results of the previously introduced radiochemical method and with Hartree-Fock-Bogoliubov model calculations.
DOI: 10.1103/PhysRevC.69.044311 PACS number(s): 21.10.Gv, 13.75.Cs, 27.60.⫹j, 36.10.⫺k
I. INTRODUCTION
The present paper reports part of our systematic study of heavy antiprotonic atoms undertaken during the last two years of the Low Energy Antiproton Ring(LEAR) activity at CERN. Although the most important part of the antiprotonic x-ray data(level widths and shifts) was already briefly re-ported [1,2] and analyzed [3]—a number of experimental results and their interpretation were also given in Refs.[4–6] and will be a subject of more exhaustive articles.
The experimental study of the antiprotonic atoms of a series of even-A tellurium isotopes was motivated first by the prediction of a strong E2-resonance effect[7] in130Te, which would allow us to obtain information on the properties of a deeply bound, “hidden” antiprotonic level, inaccessible by the antiprotonic cascade. The investigation of the E2-resonance effect occurring in this isotope was previously reported in Ref.[8]. In that reference the attenuation
coeffi-cient of the n = 8→n=7 x-ray transition affected by the reso-nance was determined but this did not allow the authors to deduce the width and shift of the n = 8 level in a unique way. When undertaking the present investigation it was hoped that the comparison of a series of even-A tellurium isotopes can lead to a precise determination of both these observables. This, in turn, would allow us to deduce the widths and shifts of the deeply bound n = 6 level in 130Te which are more strongly dependent on the antiproton-nucleus interaction than are levels directly populated by the antiprotonic cas-cade.
A second motivation for the study of even antiprotonic Te atoms was the search for isotope effects in the level widths and shifts. As in other isotopic chains investigated by our collaboration these effects would be a sign of changes in the nuclear periphery when pairs of neutrons are added to the lightest isotope studied—in our case122Te. Tellurium nuclei have only two protons outside the closed Z = 50 shell and their study constitutes a natural extension to our previous investigation of the isotope effects in even Sn nuclei[6].
This paper is organized as follows. Section II presents very briefly the experimental procedure with reference to our previous papers where a more detailed description was given. The experimental results are presented in Sec. III. Data analysis and discussion in Sec. IV are divided into two *Present address: N. Copernicus Astronomical Center, Pl-00-716
Warsaw, Poland.
†
Present address: Department of Physics, University of Tokyo, 7-3-1 Hongo, Bunkyo-ku, Tokyo 113-0033, Japan.
parts. The first one analyzes the E2 nuclear resonance effects in tellurium isotopes, whereas in the second one the E2 cor-rected level shifts and widths are used to determine the neu-tron distribution in the periphery of the investigated nuclei. Section V summarizes and concludes this paper.
II. THE EXPERIMENT
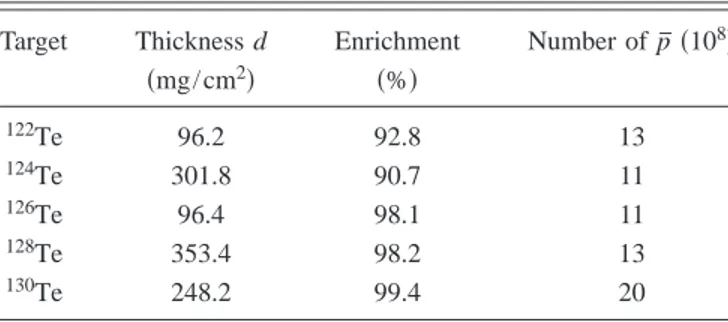
Five even-A tellurium isotopes were investigated during two experiments conducted in 1995 and 1996. In 1995 the antiprotonic atoms of 124Te, 128Te, and 130Te were studied using antiprotons with a momentum of 300 MeV/ c. The iso-topes of122Te and 126Te were investigated in 1996 using a beam of 106 MeV/ c antiprotons. Table I gives the target properties and the number of antiprotons used for each tar-get.
The antiprotonic x rays were measured with high purity germanium (HPGe) detectors. In 1995 one planar detector with 25 mm diameter and 13 mm thickness was employed. One coaxial detector with an active diameter of 49 mm and a length of 49.5 mm(relative efficiency about 19%) and one planar detector with 36 mm diameter and 14 mm thickness were used in 1996.
More details concerning the experimental methods, the detector calibration, and the data reduction may be found in
our previous publications[4–6]. We also refer to these pub-lications for an introduction to the phenomena relevant for the antiprotonic cascade and strong interaction affecting the last observable x-ray transitions.
III. EXPERIMENTAL RESULTS
The strong interaction between antiproton and nucleus causes a sizeable change of the energy of the last x-ray tran-sition from its purely electromagnetic value. The nuclear ab-sorption reduces the lifetime of the lowest accessible atomic state(the “lower level,” which for tellurium is the n=7 state) and hence the x-ray line is broadened. Nuclear absorption also occurs from the next higher level (“upper level”) al-though the effects on level energy and width are generally too small to be directly measured. The width of the 共n,l = 8 , 7兲 level was deduced indirectly by measuring the loss of
FIG. 1. Level scheme for antiprotonic tellurium atom. The ob-servables of the present experiment are indicated.
FIG. 2. Antiprotonic x-ray spectrum from122Te measured with
the HPGe detector of 19% relative efficiency.
FIG. 3. Part of the antiprotonic x-ray spectrum measured for
122Te using the detector with the 1035⫻14 mm3crystal. The fit to
the broadened 8→7 line is also shown. TABLE I. Target properties.
Target Thickness d Enrichment Number of p¯ 共108兲
共mg/cm2兲 共%兲 122Te 96.2 92.8 13 124Te 301.8 90.7 11 126Te 96.4 98.1 11 128Te 353.4 98.2 13 130Te 248.2 99.4 20
intensity of the final x-ray transitions. The level scheme for the tellurium antiprotonic atoms with the observables of the x-ray experiment is shown in Fig. 1.
The x-ray spectrum measured with antiprotons stopped in 122Te is shown in Fig. 2. Those lines in the spectra that are not broadened were fitted with Gaussian profiles. The lowest observable LS-split doublet lines共n=8→7兲, which are
sig-nificantly broadened, were fitted with two Lorentzians con-voluted with Gaussians(Fig. 3). The experimental resolution also allowed to resolve two Gaussian-shaped, LS-split n = 9
→8 lines.
The measured relative intensities of the antiprotonic x rays observed in all investigated tellurium targets are given in Table II. These intensities were used to determine the TABLE II. Measured relative x-ray intensities normalized to the transition n = 10→n=9.
Transition Energy 122Te 124Te 126Te 128Te 130Te (keV) 8→7 323.4 38.0± 2.4 48.4± 3.5 44.7± 2.7 40.5± 3.2 14.1± 1.8 9→8 221.3 74.0± 2.8 95.9± 4.8 95.3± 3.6 105.1± 5.4 101.9± 6.0 10→9a 158.2 100.0± 5.3 100.0± 7.2 100.0± 5.7 100.0± 7.3 100.0± 8.0 11→10 117.0 92.6± 4.7 86.1± 5.8 93.5± 4.7 84.7± 5.9 83.9± 6.6 12→11 88.9 78.3± 4.0 79.2± 4.0 13→12 69.1 64.5± 3.4 65.6± 3.3 14→13 54.8 60.8± 3.1 62.6± 3.2 9→7 544.7 3.1± 0.4 7.4± 1.1 10→8 379.5 8.1± 0.5 9.8± 1.0 7.7± 0.6 9.0± 0.8 8.7± 0.8 11→9 275.2 12.5± 1.1 13.2± 2.6 10.3± 0.8 12.8± 1.3 12.1± 1.4 12→10 205.9 11.8± 0.7 13.5± 1.0 13.0± 0.7 13.5± 1.0 13.6± 1.1 13→11a 158.0 13.3± 0.7 15.2± 1.0 13.6± 0.8 12.9± 1.0 13.0± 1.0 14→12 123.9 12.3± 0.7 12.5± 0.9 13.3± 0.7 11.8± 0.9 11.9± 1.0 15→13 99.1 10.4± 0.6 10.2± 0.6 16→14 80.4 6.3± 0.4 7.0± 0.6 17→15 66.1 9.7± 0.5 10.2± 0.5 10→7 702.9 2.4± 0.4 11→8 496.5 2.2± 0.4 12→9 364.1 3.0± 0.3 3.7± 0.6 3.1± 0.3 3.4± 0.5 2.4± 0.4 13→10 275.0 4.0± 0.4 4.0± 0.5 4.5± 0.4 4.4± 0.3 4.1± 0.4 14→11 212.8 8.9± 0.5b 4.5± 0.5 4.8± 0.3 4.4± 0.4 3.9± 0.4 15→12 168.2 3.1± 0.2 3.2± 0.3 3.7± 0.3 3.6± 0.3 3.4± 0.3 16→13 135.2 2.3± 0.3 2.7± 0.4 3.5± 0.3 2.1± 0.5 2.5± 0.4 17→14 110.3 5.0± 0.3 6.1± 0.5 4.7± 0.3 6.0± 0.5 5.7± 0.5 18→15 91.2 3.9± 0.2 4.0± 0.2 12→8 585.4 1.6± 0.4 13→9 433.2 1.4± 0.2 14→10 329.8 1.6± 0.1 2.0± 0.1 1.7± 0.1 2.1± 0.2 1.7± 0.2 15→11 257.1 1.6± 0.1 1.7± 0.2 2.0± 0.3 1.9± 0.2 1.8± 0.2 16→12 204.3 1.6± 0.2 1.3± 0.2 2.1± 0.2 1.5± 0.2 1.9± 0.2 17→13 165.1 1.7± 0.2 1.9± 0.2 2.3± 0.2 2.2± 0.2 2.0± 0.2 18→14 135.4 2.0± 0.2 2.2± 0.2 2.1± 0.2 2.4± 0.2 1.8± 0.3 19→15 112.4 2.9± 0.2 2.7± 0.2 1.9± 0.2 2.4± 0.2 1.9± 0.2 a
The 10→9 and 13→11 transition intensity ratio was obtained from antiprotonic cascade calculations per-formed with a modified statistical initial distribution关p共l兲⬀2共l+1兲exp 共␣·l兲;␣⬇0.1兴 [4].
b
The antiprotonic x-ray line is mixed with a strong nuclear 3 / 2+→1/2+transition in121Te(N
target− 1 isotope,
feeding of the consecutive n levels along the antiprotonic cascade. This is shown in Fig. 4.
Table III gives the measured shifts defined by =Eem − Eexpt, where Eexpt is the experimental value for the transi-tion energy and Eem is the energy calculated without strong interaction[9]. For the n,l=7,6 levels the shifts are clearly repulsive, whereas for the n , l = 8 , 7 levels they are compat-ible with zero except for 128Te and 130Te, where the upper levels are affected by the E2 resonance. Tables IV and V give the measured widths. As indicated above, the widths of the n , l = 8 , 7 levels were derived from the intensity balance of transitions feeding and depopulating these levels. Contri-butions of parallel transitions to the measured intensities were obtained from cascade calculations(see Ref. [4]). The rates for radiative dipole transitions were calculated from the formulas given in Ref.[10]. The Auger rates were derived from the radiative rates and from cross sections for the photoeffect using Ferrell’s formula [11]. The width of the level n , l = 8 , 7 for 130Te, and to a smaller extent that for 128Te, is larger than in the other tellurium isotopes. This is due to the E2 nuclear resonance effect to be discussed below. Besides this effect the data of Tables III–V hardly show any systematic changes in shifts or widths in the whole series of tellurium isotopes. At first glance this seems strange: the heaviest tellurium isotope studied has eight neutrons more than the lightest one and, from our study of Sn isotopes[6], isotope effects in shifts and widths would be expected. As it will be shown in the following sections, the additional
neu-tron contributions to the level widths and shifts are in the tellurium isotopic chain counterbalanced by the deformation effect(the deformation decreases with increasing mass num-ber A).
IV. DATA ANALYSIS AND DISCUSSION A. The E2-resonance effects—observation
of a deeply bound p¯ state
Nuclear deformation affects the atomic levels mainly due to the quadrupole interaction between the atomic and the nuclear system[7]. It is described by the Hamiltonian
HQ= − e2
2r3Q2Y2, 共1兲
where Q2 is the nuclear quadrupole operator and Y2 is a spherical harmonic in the antiproton coordinates. This poten-tial mixes atomic and nuclear states, and the mixing matrix 具n,l,0+兩HQ兩n
⬘
, l⬘
, 2+典 connects the 0+nuclear ground state to the first excited 2+ state. These mixing matrix elements are particularly large in the n⬘
= n − 2 and l⬘
= l − 2 cases of the circular共l=n−1兲 orbits. This concentration of strength is a consequence of the quadrupole nature of HQ and the node-less radial atomic wave functions for the circular orbits.The兩n=8,l=7;0+典 states in tellurium are mixed with the 兩n=6,l=5;2+典 states (see Fig. 5). The values of the mixing matrix are close to 1 keV and the level spacing between these two states is about 15 keV. The small ratio of mixing strength and level spacing allows a perturbative treatment and the E2-induced, complex energy shift due to this mixing is approximately given by
TABLE III. Measured shiftsu±of the n , l = 8 , 7(upper) andl± of the n , l = 7 , 6(lower) levels in the antiprotonic tellurium atoms (the ± sign corresponds to the j =l±1/2 orbit).
Target u+共eV兲 u−共eV兲 l+共eV兲 l−共eV兲
122Te 3 ± 11 −7 ± 11 52± 35 50± 45 124Te −3 ± 7 −6 ± 7 48± 21 55± 27 126Te 4 ± 10 6 ± 11 56± 34 31± 45 128Te 18± 6 12± 6 52± 20 79± 31 130Te −56± 5 −80± 5 46± 42 89± 73
TABLE IV. Measured absorption widths ⌫l± of the n , l = 7 , 6 level in the antiprotonic tellurium atoms(the ± sign corresponds to the j = l ± 1 / 2 orbit).
Target ⌫l+共eV兲 ⌫l−共eV兲
122Te 583± 77 661± 77
124Te 562± 68 532± 76
126Te 624± 73 683± 72
128Te 546± 87 722± 82
130Te 604± 138 707± 201
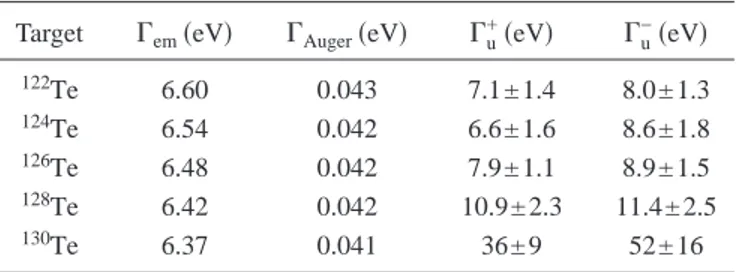
TABLE V. Radiation width⌫emand Auger width⌫Augerfor the
n = 8 levels, where the strong interaction width⌫uwas determined via the intensity balance.
Target ⌫em共eV兲 ⌫Auger共eV兲 ⌫u+共eV兲 ⌫u−共eV兲
122Te 6.60 0.043 7.1± 1.4 8.0± 1.3 124Te 6.54 0.042 6.6± 1.6 8.6± 1.8 126Te 6.48 0.042 7.9± 1.1 8.9± 1.5 128Te 6.42 0.042 10.9± 2.3 11.4± 2.5 130Te 6.37 0.041 36± 9 52± 16
FIG. 4. Total relative intensities of observed transitions (normal-ized to the transition n = 10→n=9, taken as 100) feeding the indi-cated n level in122Te. The transitions not observed experimentally
come from a cascade calculation(open area). The decrease in in-tensity of the transitions feeding the n = 8 level is due to the E2-resonance effect(see text and Fig. 5).
共E2;8,7兲 − i⌫共E2;8,7兲
2 ⬵
具8,7;0+兩HQ兩6,5;2+典2 E共8,7;0+兲 − E共6,5;2+兲, 共2兲 where E共8,7;0+兲 is the energy of the 兩n=8,l=7;0+典 state and E共6,5;2+兲=E共2+兲+Eem共6,5兲+共6,5兲−i⌫共6,5兲/2 is the energy of the atom in the兩n=6,l=5典 state and the nucleus in the 2+ state. The energy E共6,5;2+兲 contains a complex level shift of the admixed level which is not accessible by direct atomic cascade transitions. The interest in this state stems from the fact that it offers the largest nuclear-atomic overlap tested so far with antiprotonic atoms. The real situation is slightly more complicated than that indi-cated in Eq. 共2兲 since the two states of interest are split into the j = l + 1 / 2共upper兲 and j=l−1/2 共lower兲 fine struc-ture 共fs兲 components. Thus there are three mixing matrix elements involved. The two elements that mix the corre-sponding upper-upper and lower-lower fs components1 of
each共n,l兲 doublet are large 共1.135 and 1.150 keV in130Te兲. The third one that mixes the lower-upper components of the corresponding doublets is weaker 共0.18 keV兲. The method is described in more detail in Refs.关7,8兴, and for the explicit representation of these matrix elements we refer to the review of Ref. 关12兴.
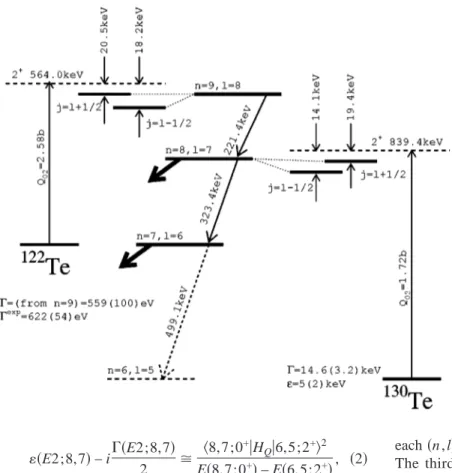
The E2 nuclear resonance effect occurs when an atomic deexcitation energy closely matches a nuclear excitation en-ergy and the electric quadrupole coupling induces configura-tion mixing. Such an effect is noticeable in antiprotonic 122Te and128Te, and is large in130Te. The cases of122Te and 130Te are illustrated in Fig. 5. In 130Te the spacing between the antiprotonic共n,l兲=共8,7兲 and 共6,5兲 levels (820.0 keV for the upper and 825.3 keV for the lower fs states) is suffi-ciently close to the first I= 2+ nuclear excitation energy 共839.4 keV兲 to allow a sizable configuration mixing of the 兩8,7;0+典 and 兩6,5;2+典 atomic nuclear states. First we discuss
1
To avoid confusion we denote fs components by共+兲 and 共−兲.
TABLE VI. Shifts of the n , l = 8 , 7 states.
Isotope Experimental(eV) E2 induced(eV) Optical(eV) j = l + 1 / 2 j = l − 1 / 2 j = l + 1 / 2 j = l − 1 / 2 j = l + 1 / 2 j = l − 1 / 2 122Te 3(11) −7共12兲 12 12 −9共11兲 −19共12兲 124Te −3共7兲 −6共7兲 12 12 −15共7兲 −18共7兲 126Te 4(10) 6(11) 14 14 −10共10兲 −8共11兲 128Te 18(6) 12(6) 24 22 −6共6兲 −10共6兲 130Te −56共5兲 −80共5兲 −46共6兲 −67共6兲 −10共4兲a −13共4兲a
aValues for130Te are obtained by an extrapolation from122Te-128Te.
FIG. 5. The antiprotonic-atom level energies and corresponding nuclear excitations of the 2+
those data that can be analyzed without reference to optical potentials. This discussion is based essentially on the E2 mixing in the “upper” levels. It allows us to determine prop-erties of the deeply bound atomic state in an almost model independent way.
The two complex quantities共6,5, j
⬘
兲−i⌫共6,5, j⬘
兲/2 for the low lying states are of interest. Equation(2) allows us to determine these complex shifts in terms of the experimental upper level values 共8,7, j兲−i⌫共8,7, j兲/2 provided one is able to extract共E2兲−i⌫共E2兲/2 from the experimental data. In the given equation共8,7, j兲 − i⌫共8,7, j兲/2 = 共E2;8,7兲 − i⌫共E2;8,7兲/2 +opt共8,7, j兲 − i⌫opt共8,7, j兲/2
共3兲 the last two terms account for the direct coupling to the an-nihilation channels, i.e., the part which may be described by an optical potential.
The strategy adopted to obtain共E2兲 and ⌫共E2兲 is based on the following.
(1) The E2-induced shifts for 130Te are large due to a quasiresonant situation with a small energy difference of 20 keV. It makes these particular shifts and widths strongly dependent upon energy and width of the deeply bound state. On the other hand, the E2-induced shifts for 128Te down to 122Te are almost independent of the properties of this state. This happens because of the large共⬎150 keV兲 energy mis-match. The induced level shifts for 128–122Te are calculated and displayed in Table VI. It turns out that the residual shifts, defined as experimental minus E2-induced shifts, are very small. These residual shifts may be attributed to the effect of an optical potential in the n = 8 states as indicated in Eq.(3). As a next step, the optical shifts obtained in 128,126,124,122Te are used to calculate a small optical potential shift for130Te. It is done by a linear regression method and the extrapolated values are given in Table VI. Now for130Te the procedure is reversed and the induced E2 shifts are calculated as the
ex-perimental minus the extrapolated optical shifts.
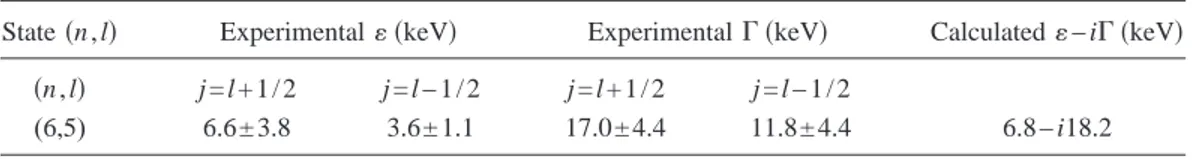
(2) A similar procedure is adopted for the level widths (see Table VII). An alternative procedure would be to calcu-late the optical components of shifts and widths in terms of an optical potential. This introduces some uncertainty related to the form of the potential and the neutron densities, which is of the order of 1 eV for the level width. It generates an uncertainty of共2–3兲% to the induced width and the width of the admixed level, much smaller than the error due to other sources. However, there are difficulties in this way as the phenomenological potentials have never been tested against the upper shifts. Attractive potentials yield attractive upper shifts of the order of −0.5 eV, inconsistent with the data. Therefore, the linear regression method seems more reliable. (3) The final step is to determine from Eq. (2) the best results for the deeply bound state(see Table VIII). Points (1) and(2) are repeated to obtain self-consistency. The errors in Table VIII correspond to the experimental errors given in Tables VI and VII. In this way one obtains two repulsive shifts in the upper and lower j = l + 1 / 2 , l − 1 / 2 fine structure components and two widths of these components. Figure 6 shows that the measured width of the n = 6 level in 130Te extends smoothly the previous systematics of these widths.
It is interesting to notice a large LS effect, partly masked by the experimental errors. Qualitatively the difference in shifts is consistent with the measurements done on the n = 8 levels in174Yb, which indicate an enhancement of the elec-tromagnetic fine structure splitting by nuclear LS interactions [13]. On the other hand, this effect does not exist in the neighboring 172Yb, 176Yb nuclei [4]. Considering the level widths in the present case the LS effect is opposite to that observed in the Yb atoms. The upper width is larger than the lower width. This goes against a simple geometric effect due to the electromagnetic LS force. One would expect the wave function兩⌿−兩 at the nuclear surface to be larger than 兩⌿+兩 as a result of LS attraction for the first and repulsion for the second state. Such an effect accounts for the Yb widths. Here in130Te however, one needs a genuine nuclear absorptive LS potential to explain the result.
TABLE VII. Widths of n , l = 8 , 7 levels.
Isotope Experimental(eV) E2 induced(eV) Optical(eV) j = l + 1 / 2 j = l − 1 / 2 j = l + 1 / 2 j = l − 1 / 2 j = l + 1 / 2 j = l − 1 / 2 122Te 7.1(1.4) 8.0(1.3) 0.8 0.5 6.3(1.4) 7.5(1.3) 124Te 6.6(1.6) 8.6(1.8) 1.0 0.6 5.6(1.6) 8.0(1.8) 126Te 7.9(1.1) 8.9(1.5) 1.7 1.0 6.2(1.1) 7.9(1.5) 128Te 10.9(2.3) 11.4(2.5) 5.8 3.3 5.1(2.3) 8.2(2.5) 130Te 36(9) 52(16) 30(9) 44(16) 6.0(0.7)a 7.8(0.8)a a
Values for130Te are obtained by an extrapolation from122Te-128Te.
TABLE VIII. Shifts and widths of the deeply bound n , l = 6 , 5 level in130Te.
State共n,l兲 Experimental 共keV兲 Experimental⌫ 共keV兲 Calculated−i⌫ 共keV兲 共n,l兲 j = l + 1 / 2 j = l − 1 / 2 j = l + 1 / 2 j = l − 1 / 2
In the case of 122Te, the n = 9 level is mixed with the n = 7 level of known shift and width. From the experimental width of 0.95共24兲 eV in this state and Eq. (2) one calculates the widths of the n = 7 state to be⌫=559共100兲 eV. This value exhausts, and is consistent with the line width ⌫ = 622共54兲 eV observed directly in the n=7 state. The other, optical contribution to the width of the n = 9 state is insignifi-cant共⌫opt⯝10−2eV兲. This situation is visualized in Fig. 5.
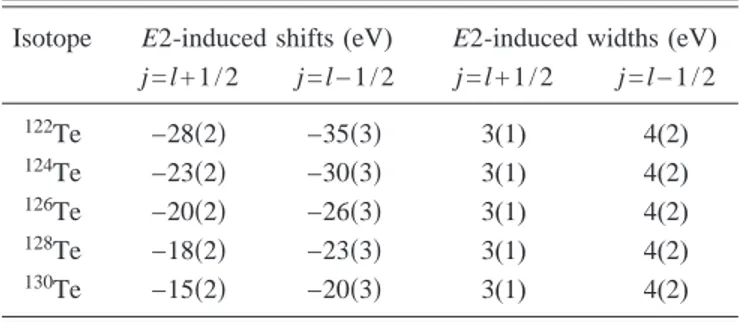
A similar analysis may be performed for the lower 兩n = 7 , l = 6典 states. These states are coupled by the quadrupole interaction to a very low兩n=5,l=4典 state and this coupling generates some E2-induced complex shifts to the 兩n=7,l = 6典 states. Now, however, the analysis cannot be performed in a model independent way, since the E2-induced widths and shifts are smaller than the optical shifts. To calculate the effect one needs the level shift for the n = 5 circular state, which we calculated with the optical potential discussed in the following section. One obtains共n=5兲⯝130 keV, ⌫共n = 5兲⯝150 keV, but these numbers are rather uncertain as the shape of the optical potential at the relevant radii is uncer-tain. The results for the induced level shifts and widths are given in Table IX. The errors are due to an estimated 50% uncertainty of, ⌫ for the n=5 state.
In Fig. 7 all the available data for n = 6 antiprotonic level widths are again presented. However, to compare the real effects of nuclear absorption, the trivial consequence of atomic wave function normalization was removed, i.e., the widths were multiplied by B2l+3(B – Bohr radius). This fig-ure indicates the initial increase, saturation, and ultimate damping of the absorption that follows the increasing pen-etration of antiprotons into the nuclear interior. Such a be-havior, typical for strongly absorptive interactions, is found in the S wave p¯ scattering on very light nuclei[14,15] and in
the n = 4 states in light p¯ atoms[16]. In this experiment the effect is extended to 130Te which offers the largest atomic-nucleus overlap observed so far.
The increasing role of absorption is apparently not the whole story in the130Te, n = 6 level shift and width. As cal-culated in Ref. [8] the overlap allowed by the centrifugal barrier is large enough to support a hidden nuclear state of antiproton, although this possibility depends on uncertain strength of nuclear attraction at short distances. The exis-tence of such a nuclear state is indicated by the Krell effect: a stronger attraction produces the more pronounced repulsion of the level[17]. Calculations [8] based on theoretical optical potentials and our results given in Table VII indicate that Krell effect may be generated in the j = l + 1 / 2 fine structure state. There, the formation of nuclear-p¯ state is assisted by the Coulomb and a nuclear LS potential. A more quantitative analysis including all the available information on the LS potential will be done separately.
B. Neutron density in the nuclear periphery
We have previously presented in detail[3] our approach to deduce the peripheral neutron density distributions from FIG. 6. The widths of the circular n = 6 level[2], including the
deeply bound level in130Te as a function of the atomic number Z.
The line interpolates the widths calculated with the optical potential used in Sec. IV B[20].
TABLE IX. The E2-induced shifts and widths of the n , l = 7 , 6 levels.
Isotope E2-induced shifts(eV) E2-induced widths(eV) j = l + 1 / 2 j = l − 1 / 2 j = l + 1 / 2 j = l − 1 / 2 122Te −28共2兲 −35共3兲 3(1) 4(2) 124Te −23共2兲 −30共3兲 3(1) 4(2) 126Te −20共2兲 −26共3兲 3(1) 4(2) 128Te −18共2兲 −23共3兲 3(1) 4(2) 130Te −15共2兲 −20共3兲 3(1) 4(2)
FIG. 7. The experimental widths of the circular n = 6 level (av-eraged over isotopes of a given element) scaled by the normaliza-tion factor of the atomic wave funcnormaliza-tion(arbitrary units) plotted vs the atomic number Z. The Z = 52 point corresponds to the deeply bound level in130Te. Data for Z = 39 are from Ref.[26], for Z=42
from Ref.[27], and other points are from Ref. [2] (see also Ref. [28]).
antiprotonic x-ray data. Recently this approach was illus-trated by a comparison with the Hartree-Fock-Bogoliubov model[6].
In short, the point proton and point neutron distributions are assumed to be represented by two-parameter Fermi(2pF) distributions of the form共r兲=o兵1+exp关共r−c兲/a兴其−1. Here c is the half-density radius, a the diffuseness parameter [re-lated to the surface thickness t by t =共4 ln 3兲a], and0 is a normalization factor. The point proton distributions are ob-tained from the charge distributions, determined using elec-tron scattering or muonic atom data. Based on our radio-chemical experiments[18,19] we inferred [3] that the half-density radii of the proton and neutron distributions are almost equal. Therefore the only unknown parameter of the neutron distribution is its surface thickness. This parameter is obtained from the p¯-atom lower and upper level widths and the lower level shift, using the optical potential “a¯ ·” with an antiproton-nucleon effective scattering length (equal for protons and neutrons) a¯=共2.5±0.3兲+i共3.4±0.3兲fm, as pro-posed for pointlike nucleons in Ref. [20]. The differences between experimental level widths and shifts and those cal-culated with the parameters of the proton distribution are attributed to the extended neutron density contribution to these observables.
The charge distribution of the 124–130Te isotopes was de-termined in Ref. [21] from a simultaneous analysis of two muonic x-ray energies, 2p-1s and 3d-2p, and optical isotope shift data. Fermi distribution parameters c , t and rms radii (root mean square radii) were presented there. For122Te no muonic data were available and only the rms charge radius value was given.
Although having only two protons outside the closed Z = 50 shell, tellurium nuclei are slightly deformed, with the deformation parameters2varying from 0.12 to 0.18, when the mass number decreases from 130 to 122[22]. In the data of Ref.[21] the variation of the deformation is accounted for by the change in the skin thickness t of the nuclear charge distribution. It was shown that the t parameter increases lin-early with the deformation parameter2.
In the present work we have deduced the two Fermi charge distribution parameters c and t for 122Te by linear
extrapolation of these values from heavier isotopes plotted as a function of2. The deformation parameters from Ref.[22] were used. The rms value of the charge distribution in122Te calculated from the extrapolated c, t values is equal to 4.715 fm, to be compared with 4.713 fm obtained from the optical isotope shift data, as quoted in Ref.[21].
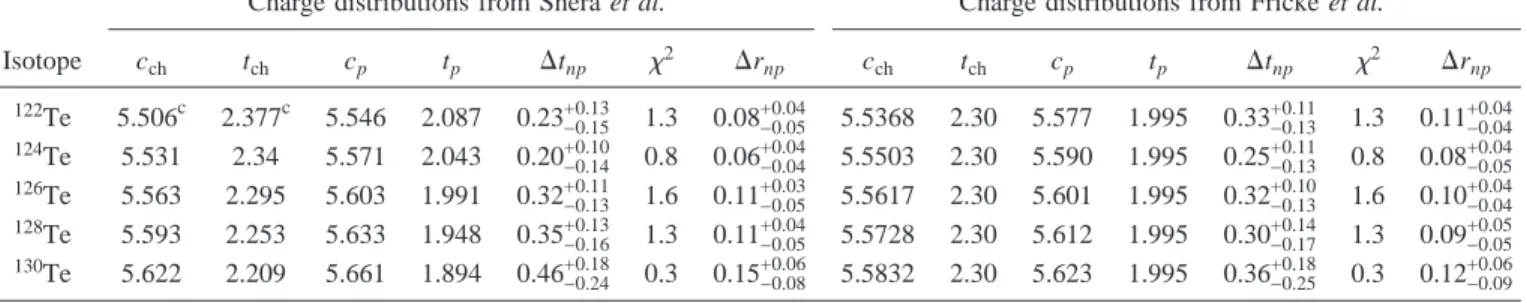
In the first-half of Table X we present the 2pF charge distribution parameters, cch and tch [21], and the deduced point proton distribution parameters cp, tp. The neutron dif-fuseness, considered as a free parameter, was adjusted to get best agreement with the experimental lower and upper level widths and lower level shifts, corrected for the E2-resonance effect as discussed in Sec. IV B. The half-density radius pa-rameters were assumed to be equal, cn= cp. The resulting differences ⌬tnp= tn− tp and ⌬rnp= rn− rp (the difference be-tween the neutron and proton rms radii) are shown for the investigated tellurium nuclei.
Using the experimental data of Ref.[21] the charge dis-tribution parameters of the tellurium isotopes were again listed in Ref. [23], but only the 2p-1s transition in the muonic atom was used. In this tabulation the skin thickness t was fixed at 2.3 fm for all spherical nuclei from9Be to209Bi. This procedure has apparently no noticeable effect on the rms radii of even tellurium isotopes, which agree within 0.03 fm in both references. However, at large distances both parameterizations differ significantly. This is illustrated in Fig. 8, where the charge density ratio as deduced from Ref. [21] and Ref. [23] are shown for 122Te and 130Te, respec-TABLE X. Parameters of 2pF neutron density distributions deduced from the widths of antiprotonic levels in Te atoms. cch, tch—the
half-density radius and the surface thickness of charge density distributions. cp, tp—the half-density radius and the surface thickness of pointlike proton density distributions.⌬tnp—difference of the surface thicknesses of proton and neutron distributions.⌬rnp—difference of
the neutron and proton rms radii.
Charge distributions from Shera et al.a Charge distributions from Fricke et al.b Isotope cch tch cp tp ⌬tnp 2 ⌬rnp cch tch cp tp ⌬tnp 2 ⌬rnp 122Te 5.506c 2.377c 5.546 2.087 0.23 −0.15 +0.13 1.3 0.08 −0.05 +0.04 5.5368 2.30 5.577 1.995 0.33 −0.13 +0.11 1.3 0.11 −0.04 +0.04 124Te 5.531 2.34 5.571 2.043 0.20 −0.14 +0.10 0.8 0.06−0.04+0.04 5.5503 2.30 5.590 1.995 0.25−0.13+0.11 0.8 0.08−0.05+0.04 126Te 5.563 2.295 5.603 1.991 0.32 −0.13 +0.11 1.6 0.11 −0.05 +0.03 5.5617 2.30 5.601 1.995 0.32 −0.13 +0.10 1.6 0.10 −0.04 +0.04 128Te 5.593 2.253 5.633 1.948 0.35 −0.16 +0.13 1.3 0.11−0.05+0.04 5.5728 2.30 5.612 1.995 0.30−0.17+0.14 1.3 0.09−0.05+0.05 130Te 5.622 2.209 5.661 1.894 0.46 −0.24 +0.18 0.3 0.15 −0.08 +0.06 5.5832 2.30 5.623 1.995 0.36 −0.25 +0.18 0.3 0.12 −0.09 +0.06 a Reference[21]. b Reference[23]. c
Extrapolated values(see text).
FIG. 8. Comparison of the charge density distribution deduced from the two-parameter Fermi distribution of Refs.[21,23].
tively. For 122Te at large distance the charge density from Ref.[23] is smaller than that from Ref. [21]. For 130Te iso-tope the situation is reversed.
The deduced differences between neutron and proton rms values using charge distributions from Ref.[23] are shown in the second-half of Table X. Although the deduced⌬rnp val-ues agree within the quoted errors with those obtained for the charge distributions of Ref. [21], no isotope effects can be discerned. We continue our discussion of the neutron distri-bution in tellurium nuclei basing on the charge distridistri-bution parameters given in Ref.[21].
Using bare-proton and bare-neutron distributions as listed for the tellurium isotopes in the first-half of Table X and using the scattering lengths given above, the theoretical widths and shifts were compared with the experimental ones and are presented in Fig. 9. It is evident that the potential used is able to reproduce, within the experimental errors, the lower and upper level widths and the lower-level shift.
The analysis of the x-ray data as presented in Table X allows us to determine the normalized neutron to proton den-sity ratio共Zn兲/共Np兲 as a function of the radial distance at the periphery of the investigated even tellurium isotopes. This ratio is presented in Fig. 10. As previously discussed [3], the radiochemical experiment [24] can be considered as giving the same ratio at a radial distance around 2.5 fm larger than the charge density radius. The radiochemical ex-periment was performed[18] for the isotopes128Te and130Te and its results are also shown in Fig. 10. The experimental data are compared with the proton to neutron density ratio obtained from spherical Hartree-Fock-Bogoliubov (HFB) calculations[25]. The difference between theoretical and ex-perimental density distributions increases with decreasing tellurium mass number, what may be due to the neglect of deformation in the calculated densities.
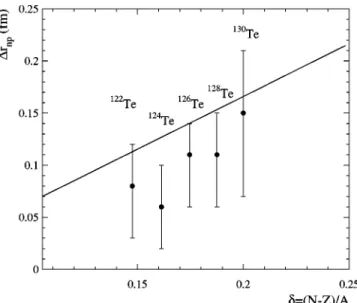
Finally, in Fig. 11 the differences ⌬rnp between neutron and proton rms radii for tellurium isotopes are plotted as a function of the nuclear asymmetry parameter␦=共N−Z兲/A. They are compared with our previous systematics of ⌬rnp values given in Ref.[3]. It is worth mentioning that for the previous systematics only128Te was used.
FIG. 10. Normalized neutron-to-proton density ratio 共Zn兲/共Np兲 deduced from strong-interaction level widths and shifts
(solid lines with indicated statistical errors) and charge distributions given in Ref.[21]. They are compared with fhalomeasured in the
radiochemical experiment(marked with crosses at a radial distance corresponding to the most probable annihilation site) and with HFB model calculations(dashed lines).
FIG. 11. Difference⌬rnpbetween the rms radii of the neutron
and proton distributions as deduced from the antiprotonic atom x-ray data and charge distributions from Ref.[21], as a function of ␦=共N−Z兲/A. The full line is the same as in Fig. 4 of Ref. [3].
FIG. 9. Average widths and shifts of the level 共n,l=7,6兲 and widths of the level 共n,l=8,7兲 plotted vs A in the tellurium isotopes. Upper level widths and lower level shifts are corrected for the E2 effect. The lines are calculated using the op-tical potential for pointlike nucleons[20] with the surface parameters given in Table X (see also text). Positive level shifts correspond to repulsive interactions.
V. SUMMARY AND CONCLUSIONS
Antiprotonic x-ray were measured in five even tellurium isotopes. The strong interaction level widths and shifts were determined. These observables are strongly affected by the E2 mixing of nuclear and atomic states. The analysis of the E2 resonance occurring in 130Te allowed to deduce the widths and shifts of the deeply bound level n , l = 6 , 5, which cannot be directly observed. The LS splitting of its compo-nents gives clear evidence of a strong nuclear spin-orbit force contribution to the determined widths and shifts of this level. Till now there exists only conflicting evidence [4,13] on the observation of this effect in Yb isotopes. We believe that the130Te case opens a new interesting topic for further research.
The measured lower and upper level widths and lower level shifts, corrected for the E2 effects, were used to deter-mine the properties of the nuclear periphery. We have as-sumed that the simple two-parameter Fermi model describes the peripheral proton and neutron distributions. The 2pF point proton distributions were taken from muonic-atom ex-periments. Based on our radiochemical experiments it was
assumed that the half-density radii of the proton and neutron distributions are the same. The neutron distribution diffuse-ness was adjusted to account best for the experimental level widths and shifts. The neutron rms radius obtained in this way was used to determine the difference between the neu-tron and the proton rms radii,⌬rnp. This difference exhibits a dependence on the mass number and is in reasonable agree-ment with ⌬rnp values determined previously for a wide mass number range[3].
ACKNOWLEDGMENTS
We thank the LEAR team for providing the intense high-quality antiproton beam and Anna Stolarz of the Heavy Ion Laboratory in Warsaw as well as Katharina Nacke and Peter Maier-Komor of the Technical University Munich for the target preparation. Financial support by the Polish State Committee for Scientific Research, Grant Nos. 2P03B04815 and 5P03B04521, as well as the Accelerator Laboratory of the University and the Technical University of Munich is acknowledged. This work was also strongly supported by Deutsche Forschungsgemeinschaft, Bonn.
[1] A. Trzcińska, J. Jastrze¸bski, T. Czosnyka, T. von Egidy, K. Gulda, F. J. Hartmann, J. Iwanicki, B. Ketzer, M. Kisieliński, B. Kłos, W. Kurcewicz, P. Lubiński, P. Napiorkowski, L. Pi-eńkowski, R. Schmidt, and E. Widmann, Nucl. Phys. A692, 176c(2001).
[2] A. Trzcińska, J. Jastrze¸bski, P. Lubiński, F. J. Hartmann, R. Schmidt, T. von Egidy, and B. Kłos, Acta Phys. Pol. B 32, 917 (2001).
[3] A. Trzcińska, J. Jastrze¸bski, P. Lubiński, F. J. Hartmann, R. Schmidt, T. von Egidy, and B. Kłos, Phys. Rev. Lett. 87, 082501(2001).
[4] R. Schmidt, F. J. Hartmann, T. von Egidy, T. Czosnyka, J. Iwanicki, J. Jastrze¸bski, M. Kisieliński, P. Lubiński, P. Napi-orkowski, L. Pieńkowski, A. Trzcińska, J. Kulpa, R. Smolańc-zuk, S. Wycech, B. Kłos, K. Gulda, W. Kurcewicz, and E. Widmann, Phys. Rev. C 58, 3195(1998).
[5] F. J. Hartmann, R. Schmidt, B. Ketzer, T. von Egidy, S. Wycech, R. Smolańczuk, T. Czosnyka, J. Jastrze¸bski, M. Kisieliński, P. Lubiński, P. Napiorkowski, L. Pieńkowski, A. Trzcińska, B. Kłos, K. Gulda, W. Kurcewicz, and E. Widmann, Phys. Rev. C 65, 014306(2002).
[6] R. Schmidt, A. Trzcińska, T. Czosnyka, T. von Egidy, K. Gulda, F. Hartmann, B. Ketzer, M. Kisieliński, B. Kłos, W. Kurcewicz, P. Lubiński, P. Napiorkowski, L. Pieńkowski, R. Smolańczuk, E. Widmann, and S. Wycech, Phys. Rev. C 67, 044308(2003).
[7] M. Leon, Nucl. Phys. A260, 461 (1976).
[8] S. Wycech, F. J. Hartmann, H. Daniel, W. Kanert, H. S. Plendl, T. von Egidy, J. J. Reidy, M. Nicholas, L. A. Redmond, H. Koch, A. Kreissl, H. Poth, and D. Rohmann, Nucl. Phys.
A561, 607(1993).
[9] E. Borie, Phys. Rev. A 28, 555 (1983).
[10] Y. Eisenberg and D. Kessler, Nuovo Cimento 19, 1195
(1961).
[11] R. A. Ferrell, Phys. Rev. Lett. 4, 425 (1960).
[12] S. Devons and I. Duerdoth, Adv. Nucl. Phys. 2, 295 (1969).
[13] A. Kreissl, A. D. Hancock, H. Koch, T. Köhler, H. Poth, U. Raich, D. Rohmann, A. Wolf, L. Tauscher, A. Nilsson, M. Suffert, M. Chardalas, S. Dedoussis, H. Daniel, T. von Egidy, F. J. Hartmann, W. Kanert, H. Plendl, G. Schmidt, and J. J. Reidy, Z. Phys. A 329, 235(1988).
[14] K. Protasov, G. Bonomi, E. L. Rizzinoi, and A. Zenoni, Eur. Phys. J. A 7, 429(2000).
[15] A. Gal, E. Friedman, and C. Batty, Phys. Lett. B 491, 219 (2000).
[16] A. Green and S. Wycech, Nucl. Phys. A467, 744 (1987). [17] M. Krell, Phys. Rev. Lett. 26, 584 (1971).
[18] P. Lubiński, J. Jastrze¸bski, A. Trzcińska, W. Kurcewicz, F. J. Hartmann, W. Schmid, T. von Egidy, R. Smolańczuk, and S. Wycech, Phys. Rev. C 57, 2962(1998).
[19] R. Schmidt, F. J. Hartmann, B. Ketzer, T. von Egidy, T. Czos-nyka, J. Jastrze¸bski, M. Kisieliński, P. Lubiński, P. Napi-orkowski, L. Pieńkowski, A. Trzcińska, B. Kłos, R. Smolańc-zuk, S. Wycech, W. Pöschl, K. Gulda, W. Kurcewicz, and E. Widmann, Phys. Rev. C 60, 054309(1999).
[20] C. J. Batty, E. Friedman, and A. Gal, Nucl. Phys. A592, 487 (1995).
[21] E. B. Shera, M. V. Hoehn, G. Fricke, and G. Mallot, Phys. Rev. C 39, 195(1989).
[22] S. Raman, C. H. Malarkey, W. T. Milner, C. W. Nestor, Jr., and P. H. Stelson, At. Data Nucl. Data Tables 36, 1(1987). [23] G. Fricke, C. Bernhardt, K. Heilig, L. A. Schaller, L.
Schel-lenberg, E. B. Shera, and C. W. de Jager, At. Data Nucl. Data Tables 60, 177(1995).
Kim, W. Kurcewicz, P. Lubiński, G. Riepe, W. Schmid, A. Stolarz, and S. Wycech, Nucl. Phys. A558, 405c(1993). [25] R. Smolańczuk (private communication).
[26] P. Robertson, T. King, R. Kunselman, J. Miller, R. J. Powers, P. D. Barnes, R. A. Eisenstein, R. B. Sutton, C. R. Cox, M. Eckhause, J. R. Kane, A. M. Rushton, W. F. Vulcan, and R. E. Welsh, Phys. Rev. C 16, 1945(1977).
[27] W. Karnet, F. J. Hartmann, H. Daniel, E. Moser, G. Schmidt, T. von Egidy, J. J. Reidy, M. Nicholas, M. Leon, H. Poth, G. Büche, A. D. Hancock, H. Koch, Th. Köhler, A. Kreissl, U. Raich, D. Rohmann, M. Chardalas, S. Dedoussis, M. Suffert, and A. Nilsson, Phys. Rev. Lett. 56, 2368(1986).