OATAO is an open access repository that collects the work of Toulouse
researchers and makes it freely available over the web where possible
Any correspondence concerning this service should be sent
to the repository administrator:
[email protected]
This is an author’s version published in: http://oatao.univ-toulouse.fr/21880
To cite this version:
Torré, Jean-Philippe
and Dicharry, Christophe and Ricaurte, Marvin and Broseta, Daniel
and Diaz, Joseph and Renaud, Xavier CO2 enclathration in a semi-continuous quiescent
hydrate-forming reactor operated with pure CO2 and water soluble additives. (2011) In: 7th
International Conference on Gas Hydrates (ICGH 7), 17 July 2011 - 21 July 2011 (Edinburgh,
United Kingdom).
CO
2ENCLATHRATION IN A SEMI-CONTINUOUS QUIESCENT
HYDRATE-FORMING REACTOR OPERATED WITH PURE CO
2AND
WATER SOLUBLE ADDITIVES
Jean-Philippe Torré∗∗∗∗, Christophe, Dicharry, Marvin Ricaurte, Daniel Broseta, Joseph Diaz
Laboratoire des Fluides Complexes et leurs Réservoirs (LFC-R) Université de Pau et des Pays de l’Adour, BP 1155, 64013 Pau Cedex
FRANCE Xavier Renaud,
Total - Centre Scientifique et Technique Jean-Féger (CSTJF) Avenue Larribau, 64018 Pau Cedex
FRANCE
ABSTRACT
CO2 capture by gas hydrates is now considered as a promising alternative to classical separation processes, especially in applications when the inlet gas is available at high pressure and CO2 is to be reinjected in a geological formation. In a continuous process, forming the gas hydrates under quiescent (or unstirred) conditions would be very interesting for many reasons, including economical and safety aspects, even though the technical challenge is then to achieve high water conversion and high hydrate formation rates. The laboratory experiments presented here show that this challenge can be met by using a low concentration of appropriate water-soluble additives. These experiments extend to semi-continuous (or semi-batch) conditions a previous series of experiments conducted in a closed vessel using as additives a combination of a small quantity – in or below the percent range – of a surfactant (sodium dodecyl sulfate) and an organic compound (tetrahydrofuran). An almost complete conversion of water into hydrates is reached in a reasonable amount of time despite the quiescent conditions used. Enhanced capture kinetics and possible actions mechanisms of this combination of two additives are analyzed and discussed on the basis of experimental equilibrium curves, visual observations, kinetics data, hydrate formation rate and final water conversion.
Keywords: gas hydrates, CO2 capture, additives, semi-continuous, quiescent conditions, THF, SDS.
∗ Corresponding author: Phone: +33(0)5 40175197 Fax +33(0) 579407725 E-mail:
NOMENCLATURE
eq. equilibrium
N agitation speed (rpm) n number of moles (moles)
P pressure (bar)
r hydrate formation rate (moles/s) x mass fraction of THF (%)
S CO2 solubility in mol CO2 / mole of solution s(I) hydrate of structure I
Proceedings of the 7th International Conference on Gas Hydrates (ICGH 2011), Edinburgh, Scotland, United Kingdom, July 17-21, 2011.
s(II) hydrate of structure II T temperature (°C) Subscripts init initial g gas w water
(i) relative to point (i) in Fig. 2
Superscripts
R reactor B ballast
I hydrate of structure s(I) II hydrate of structure s(II)
Greek letters
τ molar proportion of water converted into hydrates (%)
1. INTRODUCTION
Carbon dioxide (CO2) is the most important anthropogenic greenhouse gas (GHG) regarding its amount present in the atmosphere. Continued release of carbon dioxide, and more generally of GHGs, to atmosphere at or above current rates is very likely to cause further warming and to induce many changes in the global climate system [1]. Among the portfolio of solutions to fight this problem, carbon capture and storage (CCS) is now considered as one transition solution from a fossil-fuel to a low-carbon world.
One of the major technological challenges is to reduce the energy costs involved in the CO2 separation process. In this respect, hydrate-based solutions appear as a promising option for CO2 capture. This option was presented in a very recent review [2] as a gas separation technique potentially more effective and more advantageous than conventional separation methods such as cryogenic fractionation, gas absorption, adsorption processes or membranes. In addition, various studies have already proved its potentiality for separating CO2 from others components of mixed gases [3]. However, one of the major drawbacks of the process is related to the slow enclathration kinetics, and this important limitation has to be unlocked prior to developing large-scale hydrate-based solutions for CO2 capture and/or storage application.
One of the possibilities to enhance hydrate formation is to use hydrate promoters. Some of them, like neohexane, tetrahydropyran and cyclopentane, are insoluble in water. Others additives like salts, surfactants or some organic compounds such as acetone, tetrahydrofuran and 1-4 dioxane are miscible in water at ambient conditions. Note that, although tetrahydrofuran is completely miscible in water at ambient conditions, water and THF display a miscibility gap at moderately high temperature that is wider and extend to ambient temperatures when the amount of dissolved CO2 is high enough [4]. Liu
et al. (2008) [5] and Torré et al. (2011) [6] have
shown that the combination of an anionic surfactant (sodium dodecyl sulfate, SDS) and a cyclic ether known to form structure II hydrates (tetrahydrofuran, THF) give interesting results for pure CO2 enclathration in batch conditions. This combination of additives is further used in this study, which extends our previous study [6] to semi-continuous (semi-batch) conditions.
In a continuous process, using a hydrate forming vessel which has no mechanical agitation is interesting for many reasons, including economical and safety aspects. Firstly, the probability of gas leakage is reduced. In addition, the gas mixture where the CO2 has to be separated can be potentially hazardous and flammable (e.g. CH4-CO2, H2S-CO2). At last, the energy required to produce a sufficient mechanical stirring is not compatible with the development of a cost-competitive CO2 capture process [7]. However, achieving a high water conversion into hydrate with reasonable kinetics is really challenging when the hydrate formation is done under static (quiescent) conditions.
The experiments presented in this study are performed using a high pressure cell first in a batch configuration and then switching to a semi-continuous (semi-batch) static configuration. Similarly to our previous study, the aqueous solutions contain THF and SDS. The kinetics and possible mechanisms of CO2 enclathration kinetics are analyzed and discussed on the basis of equilibrium curves, visual observations, kinetics data and the amount of water converted into hydrates.
2. EXPERIMENTAL RIG
A simplified scheme of the experimental apparatus used in this study is presented in Figure 1.
PT TT gas purge (1) (3) (3) (4) (2) PT (7) (8) (6) PI (5) V1 V2 V3 TT TT
Figure 1. Experimental rig: (1) reactor ; (2) magnetic stirrer ;
(3) thermostatic bathes ; (4) lighting system ; (5) CCD camera; (6) pressure reducing valve ; (7): gas storage vessel (ballast); (8) computer (standard PC).
The whole system is flexible and instrumented to run experiments up to pressures of 200 bar and temperatures from -10 to 50 °C. The reactor is a jacketed high-pressure cell entirely made in 316L stainless steel except for the inner shell, which is in titanium TA6V for its excellent anti-corrosion properties. The cell is equipped with two see-through sapphire windows of 20 mm diameter. The interior of the reactor is illuminated from one side of these windows by an optical fiber (GBR150 from Bodson) and observations are recorded on the other side via a CCD camera (LiveCam Optia AF from Creative Labs). The images presented in the following are snapshots extracted from the videos recorded during the experiments. A star-shaped magnetic agitator (20 mm diameter) driven by a magnetic stirrer (Hei-Mix D model from Heidolph) allows stirring the solution before hydrate formation. Two PT100 probes are located inside the reactor to measure both liquid and gas temperatures with an accuracy of ± 0.1 °C. The reactor pressure is measured with a 0-100 bar pressure transducer (PA33X from KELLER) with an accuracy of ± 0.1 bar.
The reactor can be operated either in the batch mode, or in the continuous - also called semi-batch - mode. In the semi-batch mode, after the reactants have been charged and the cell brought
to the desired pressure, the reactor is isolated from the gas storage vessel (gas ballast) by closing the manual valve V1. In the semi-batch mode, this valve is kept open allowing fresh gas to be delivered to the reactor at a fixed pressure. Between the reactor and the gas ballast, a pressure-reducing valve from Dräger-Tescom allows adjusting the pressure inside the cell with a precision of ± 0.1 bar. When the reactor is being operated in batch configuration (valve V1 closed), the gas pressure in the reactor feeding line can be adjusted manually using a digital manometer (Leo 2 model from Keller) with a precision of ± 0.04 bar.
The gas ballast is a jacketed cylindrical stainless steel vessel. The gas temperature is measured using a PT100 probe with an accuracy of ± 0.1 °C, and its pressure is given with an accuracy of ± 0.3 bar by a pressure transducer PA33X model from KELLER in the range of 0-200 bar.
The temperatures of the reactor and the gas ballast are regulated by means of two independent cryo-thermostatic baths (model Polystat 37 from Fisher Scientific). The coolant is a water/propylene glycol solution circulating inside the vessels jackets. To ensure temperature homogeneity, all connections and fittings are insulated and wrapped with a flexible tube in which the coolant circulates. The whole system is monitored via a computer and the data acquisition is done using LabView®. The acquisition frequency is set to 1 Hz for all experiments.
The reactor and ballast volumes, which have been measured by nitrogen expansion from a calibrated vessel, are VR = 168.0 ± 0.9 ml and VB = 382.2 ± 0.5 ml, respectively. For each vessel, all dead volumes (i.e., connections with lines, fittings, pressure gauges and pressure sensors) have been taken into account in the volume measurements.
3. MATERIALS AND PREPARATION OF SOLUTIONS
The chemicals used in this work are carbon dioxide from Linde gas (purity 99.995 %), sodium dodecyl sulfate (SDS) from Chem-Lab (purity > 98 %) and tetrahydrofuran (THF) from Sigma-Aldrich (purity > 99.9 %). Ultra-pure water (resistivity of 18.2 mΩ.cm), produced in our
laboratory by a PureLab Classic® from ELGA Labwater, was used to prepare all the solutions. The SDS/THF/water solutions are prepared at ambient temperature by first dissolving the desired amount of SDS into 50 ml of ultra-pure water under stirring. Stirring is maintained during 5 min, then THF is added, and the solution is agitated again during 5 min. Finally, the total mass of the solution is adjusted to 200 ± 0.01 g by adding ultra-pure water and kept under stirring conditions in a glass erlenmeyer closed by a PTFE cap. All results presented in this paper are for the same aqueous solutions containing SDS and THF concentrations equal to 0.3 wt.% and 1 or 4 wt.%, respectively.
4. EXPERIMENTAL PROCEDURE AND OBSERVATIONS
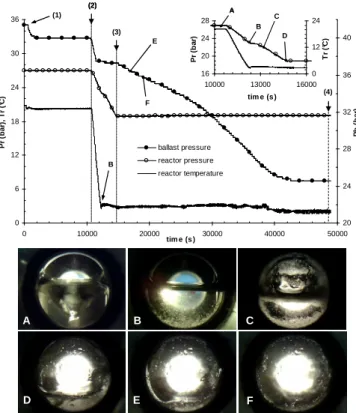
The experimental procedure entails the following consecutive steps, which are presented in more detail below: (i) reactor loading with the aqueous solution and CO2, (ii) solubilization of CO2 in the aqueous solution, (iii) reactor in batch configuration, and (iv) reactor in semi-continuous (semi-batch) configuration. Figure 2 shows the evolution with elapsed time of the reactor/ballast pressures and reactor temperature for one experiment, together with a selection of snapshots from the CCD camera.
4.1. Reactor loading
A volume of 65.0 ± 0.1 ml from a freshly prepared aqueous solution is charged into the reactor with calibrated pipettes of 50 and 15 ml (the water/gas interface is located in the middle of the reactor see-through windows). The reactor is then closed, connected to the rest of the experimental rig, and brought under agitation (N = 600 rpm) to the temperature of 20.0 °C. When temperature is stabilized at 20.0 °C, agitation is stopped and air is purged from the reactor: all loading lines are first vented with CO2, then the reactor itself is vented three times with CO2 and then purged (the reactor pressure is increased to 3 bar and then decreased to 1 bar). Then CO2 is loaded to the desired pressure from the gas ballast. During loading, the feed gas warms slightly up due to gas friction in the 1/8 inches diameter feeding lines of and temperature in the ballast temperature slightly decreases due to
gas expansion. Once the desired pressure is reached in the reactor, a time period of around one minute is needed to stabilize again the reactor and ballast temperatures at 20.0 °C (stirring is off).
0 6 12 18 24 30 36 0 10000 20000 30000 40000 50000 tim e (s ) P r (b a r) , T r (° C ) 20 24 28 32 36 40 P b ( b a r) 16 20 24 28 10000 13000 16000 tim e (s ) P r (b a r) 0 12 24 T r (° C ) (1) (2) (3) B (4) A B C D E F A B C D E F ballast pressure reactor pressure reactor temperature 0 6 12 18 24 30 36 0 10000 20000 30000 40000 50000 tim e (s ) P r (b ar ), T r (° C ) 20 24 28 32 36 40 P b ( b a r) 16 20 24 28 10000 13000 16000 tim e (s ) P r (b a r) 0 12 24 T r (° C ) (1) (2) (3) B (4) A B C D E F A B C D E F ballast pressure reactor pressure reactor temperature
Figure 2. Evolution of reactor pressure, reactor temperature
and ballast pressure versus time and snapshots through the reactor window made during a typical experiment: (1) → (2): CO2 solubilization in the aqueous phase ; (2) → (3): reactor in
batch configuration; Point B: first hydrate formation ; (3) → (4): reactor in semi-continuous configuration. The additive concentrations are 1 wt.% and 0.3 wt.% for THF and SDS, respectively.
4.2. Solubilization period { from (1) to (2) in
Figure 2 }
In (1), the magnetic stirrer is started again at N = 600 rpm to speed up CO2 solubilization in the aqueous solution. The ballast pressure decreases with time and stabilizes to a constant value when equilibrium is reached. The reactor is maintained under agitation (N = 600 rpm) in isobaric and isothermal conditions during at least two hours to allow for complete CO2 solubilization. Temperature is set to 20.0 °C and reactor pressure to 27.0 bar. Snapshot A shows the aspect of the solution: the liquid is transparent, and due to vigorous stirring a vortex is deforming the liquid free surface.
4.3.Reactor in batch configuration { from (2) to (3) in Figure 2 }
The reactor is then isolated from the ballast by shutting the manual valve V1 (cf. Fig. 1): the reactor is operated in batch configuration.
Starting from (2) in Fig. 2, the temperature of the cryostat is decreased with a cooling ramp of 0.9 °C/min to a target value of 2.0 °C (this temperature is maintained constant till the end of the experiment). In parallel, the ballast temperature is decreased from 20.0 °C to 2.0 °C (experiment #1) or 10.0 °C (experiments #2 to #6) in order to pre-cool the gas which will be later on (during step iv) brought to the reactor (note that the saturation pressure of CO2 is 45.0 bars at 10.0 °C instead of 36.7 bars at 2.0 °C [8]). Stirring of the aqueous phase is maintained in the reactor during the reactor cooling period in order to speed up CO2 solubilization and keep the system as close as possible to equilibrium. The appearance of the aqueous phase is carefully monitored, and stirring is turned off as soon as the aqueous phase becomes turbid: this occurs at point B (see Fig. 2, snapshot B). It is observed the formation of crystals which settle rapidly to form a solid-like deposit visible at the bottom of the reactor window (see snapshots B and C in Fig. 2) at a temperature slightly above the target temperature of 2 °C (e.g., TR
(point B)
= 2.5 °C in the experiment reported in Fig. 2). This first crystallization is accompanied by a noticeable exothermicity (the temperature in the liquid rises suddenly), whereas the reactor pressure continues to decrease. It can therefore be interpreted as being due to a gas hydrate crystallization process (see next section), which is hereafter referred to as “first hydrate” formation. In this process, a solid-like layer grows up on the reactor windows, while particles continue to appear in the bulk. The reactor temperature remains quasi-constant (in the range of 3.0 °C) and the reactor pressures continue to decrease.
In the same time, the gas pressure in the reactor feed line is adjusted manually to the exact value required in the next semi-continuous step. This technique avoids any perturbation when opening the valve V1 to shift to the semi-continuous configuration.
4.4. Reactor in semi-continuous configuration {
from (3)to(4) in Figure 2 }
Batch configuration (reactor closed) ends at point (3) in Fig. (2), which represents the moment when valve V1 is opened: the reactor is then fed at a specified constant pressure with CO2 coming from the ballast. The pressure is chosen to be 18.9 ± 0.1 bar: as shown in a previous series of batch measurements [6], this pressure corresponds to the maximum value of dP/dt (maximum CO2 consumption rate by the formation of the “second hydrate” phase). These inflexion points, which are located in a narrow reactor pressure interval (18.9 ± 0.8 bar), turn out to be somewhat independent of THF and SDS concentrations, and of initial reactor pressure. From (3) to (4), the ballast pressure decreases with elapsed time due to the CO2 consumption needed for the hydrate formation. Snapshots D, E and F (see Fig. 2) show evidence for rapid water consumption: the level of liquid in the reactor decreases rapidly and drops down to below the bottom of the reactor window in less than 1 h 30 min. Finally, the reactor temperature decreases slowly from about 3 °C to the target temperature of 2 °C, whereas the reservoir and ballast pressures stabilize to a constant value, signifying that hydrate formation has ended in (4).
5. RESULTS AND DISCUSSION
The mechanisms that drive hydrate formation are first discussed on the basis of the above results and of a more extended set of experimental results obtained in the batch configuration [6]. In those experiments, the initial reactor pressure was also set to 27 bar and SDS concentration in the aqueous phase was also equal to 0.3 wt.%, but THF concentration was varied from 1 to 4 wt.%. The experimental procedure used by Torré et al. (2011) [6] was the same as that described above in section 4.3, except that a longer reaction time was allowed until the stabilization of reactor pressure and temperature to a constant value (i.e., until the completion of hydrate formation). At the end, the reactor was heated up to 20.0 °C in order to dissociate completely the hydrates formed. Figure 3 shows some of results obtained in one of those experiments with 4%wt of THF, including the evolution with elapsed time of the reactor pressure/temperature and a few snapshots.
Figure 3. Typical curves obtained during hydrate(s) formation in batch configuration. (a) data versus time with [THF] = 4 wt.% and [SDS] = 0.3 wt.%, and PRinit = 27 bar ; (b) P,T
diagram and comparison with Lw-H-V equilibrium curves.
The first point is to determine whether 0.3 wt. % of SDS dissolved in water has an influence on the CO2 hydrate equilibrium curve. A cycle of CO2 hydrate formation/dissociation with such an aqueous solution is obtained by varying the temperature over the range of 2-20°C and monitoring the pressure, starting with a pressure of 35 bar at 20°C. The experimental setup and procedure used are described by Duchateau et al. (2009) [9]. The setup consists in a 100 ml vessel loaded with 50 ± 0.05 ml of the aqueous solution and with CO2 under a pressure of 35 bar and kept under agitation (800 rpm). This vessel is immersed in a thermostatic bath with a fine temperature controller allowing a very slow temperature ramp (dT/dt ≈ 0.15 °C/hour). The equilibrium (i.e., dissociation) part of the “hysteresis curve” that is obtained in the pressure-temperature plane coincides with that of the pure
CO2 hydrate [10], showing that the SDS at 0.3 wt.% has no noticeable effect on the hydrate equilibrium curve. This result is consistent with other studies [11] which have showed that SDS has no effect on methane hydrate equilibrium curves.
During the reactor cooling phase, the agitated solution is transparent as shown is snapshot A. The first hydrate forms at point B and this first crystallization is accompanied with an exothermicity of several degrees. As shown in snapshots B and C, a large amount of crystals is generated quasi-instantaneously in the whole bulk which becomes opaque and static (the agitator is blocked). Unfortunately, our camera has no sufficient resolution to distinguish clearly the nature and the structure of the solid(s) in presence. However, the general aspect of the bulk after crystallization seems closer to a thick S/L dispersion than to a compact solid mass. When THF and CO2 are present together, several authors [12, 13] have proposed that a mixed CO2+THF with hydrate structure s(II) forms, with the large cavities occupied by THF and the small ones by CO2. Assuming full cavity occupancy, the resulting formula for this mixed hydrate is 2CO2 -THF-17H2O. The formation temperature of this mixed THF+CO2 hydrate is known (Delahaye et al. (2006) [12]) to be higher than that of the single
CO2 hydrate (for a similar CO2 pressure), confirming that THF is a strong thermodynamic CO2 hydrate promoter.
The Lw-H-V equilibrium curve determined by Delahaye et al. [12] for a THF concentration equal to 3.8 wt.% (which is very close to the THF concentration of 4 wt.% used in this study) is shown in Figure 3. Accordingly, since point B is located between the equilibrium curves of pure CO2 and mixed CO2-THF (3.8 wt.%), it is very likely that the crystallization observed at this point is the formation of a mixed hydrate CO2+THF. Close to point D, the conditions in the reactor are such that the P, T curve crosses the CO2 equilibrium curve: snapshot D shows that this is exactly at this point that we observed a white solid-like layer growing on the reactor window. Assuming that all THF is consumed at point B, the solid that appears and grows at later time (see, e.g., D) is then a CO2 hydrate. As the CO2 hydrate forms immediately after having crossed its equilibrium frontier, it means that the mixed 14 16 18 20 22 24 26 28 0 5000 10000 15000 20000 time (s) re a c to r p re s s u re ( b a r) 0 4 8 12 16 20 24 28 32 re a c to r te m p e ra tu re ( °C ) 10 15 20 25 30 35 40 45 0 5 10 15 20
Reactor tem perature (°C)
re a c to r p re s s u re ( b a r) (b ) A B F G C D E saturation data
eq. data for CO2 hydrate (Sloan and Koh, 2007) our data (hysteresis curve) for Water+SDS and CO2 eq. data with [THF] = 3.8 %wt. (Delahaye et al., 2006) our experimental data
pressure temperature inflexion A B E C D (a ) F G B A C D E F
THF+CO2 hydrate of structure s(II) is a very good promotor of the ensuing second formation of pure CO2 hydrates. This mechanism is akin to the one proposed by Zhang and Lee (2009) [14] for CO2 hydrate formation in presence of cyclopentane. After point D, the reactor pressure decreases dramatically and the rate of hydrate formation increases. The inflexion point of the pressure curve corresponds to the exothermicity peak observed at point E. Close to this point, the system is near the pure CO2 hydrate equilibrium curve and we can see very distinctly that all the hydrate which has been formed on the reactor window dissociates progressively. The vicinity of the equilibrium curve probably helps the mass transfer by promoting the creation of additional exchange surface. As shown in Fig 3(b), the end of the hydrate formation is determined by the stabilization of the reactor temperature and pressure to values (16.0 ± 0.1 bar at 2.0 °C) very close to the equilibrium conditions of pure CO2 hydrate (15.73 bar at 2.0 °C) [10]), thus providing further evidence that the second hydrate corresponds to a pure CO2 hydrate.
At point F the temperature of the cryostat is raised to the initial temperature of 20.0 °C. From F to G, the hydrates dissociate progressively. The temperature target of 20.0 °C being reached in a very short time (typically in a few minutes), the pure CO2 hydrate equilibrium curve is followed only at the beginning of the dissociation. Then, the reactor pressure reaches progressively the initial pressure level. The final pressure is often observed to be very slightly – by less than 2% – lower than the initial pressure, possibly due to CO2 supersaturation effects.
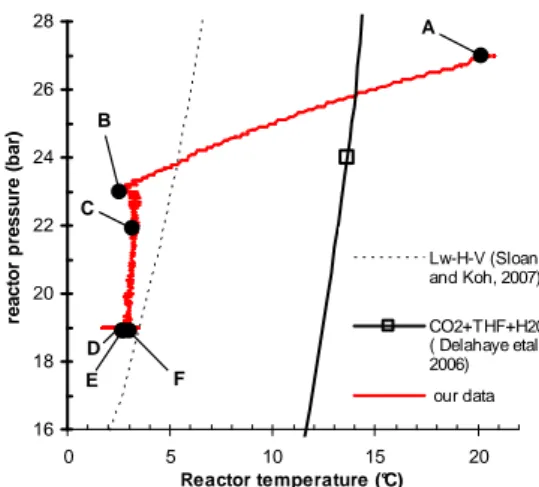
Torré et al (2011) [6] have already shown, for the same initial reactor pressure, that only a very small quantity of THF is necessary (0.5 wt.% is enough but 1 wt.% ensures a higher reproducibility) to start the CO2 enclathration process. The latter concentration has been used to demonstrate the feasibility of the semi-continuous approach reported above (e.g., in Fig. 2). Figure 4 shows the P, T diagram corresponding to the experiment of Figure 2.
With only 1 wt.% of THF, the mixed hydrate forms at a lower temperature (close to 2°C, to be compared to those observed for a THF
concentration of 4 wt.%, see Fig. 3). This temperature is in the thermodynamic stability domain of pure CO2 hydrate.
16 18 20 22 24 26 28 0 5 10 15 20 Reactor temperature (°C) re a c to r p re s s u re ( b a r) A B C D E F Lw-H-V (Sloan and Koh, 2007) CO2+THF+H20 ( Delahaye etal., 2006) our data 16 18 20 22 24 26 28 0 5 10 15 20 Reactor temperature (°C) re a c to r p re s s u re ( b a r) A B C D E F 16 18 20 22 24 26 28 0 5 10 15 20 Reactor temperature (°C) re a c to r p re s s u re ( b a r) A B C D E F Lw-H-V (Sloan and Koh, 2007) CO2+THF+H20 ( Delahaye etal., 2006) our data
Figure 4. P,T diagram with data plotted in Figure 2 and comparison with Lw-H-V equilibrium curves
However, in respect to the conclusions made from the batch experiments at higher THF concentrations, it is obvious that the mixed CO2+THF hydrate s(II) forms firstly (“first hydrate” formation) and promotes the ensuing formation of pure CO2 hydrate (“second hydrate”). From point C to D in Fig. 4 and Fig 2, the reactor pressure decreases dramatically and it is clearly visible on the corresponding snapshots of Fig. 2 that the solid-like layer grown up on the reactor window (visible in snapshot C of Fig. 2) has completely disappeared. These observations support our previous conclusions [6]: high-rate CO2 enclathration takes place when the solid structure formed on the reactor window starts decomposing.
The structure of the formed solid phase may be very important for the ensuing enclathration rate. One of the hypotheses to explain why CO2 enclathration is so efficient even in static conditions is that the action of the couple of additives leads to the formation of a porous hydrate structure. Concerning possible mechanisms, Zhang et al. (2008) [15] have shown by ξ-potential and fluorescence measurements that DS- anions adsorbs on THF hydrates. A monolayer of DS- may be complete at a concentration of SDS equal to 0.17 mmol.L-1. For a further increase in SDS concentration, DS- may associates with the first monolayer by
hydrophobic forces to form a bi-layer with head groups oriented toward the aqueous solution. However, this effect may be reduced in presences of other anions as carbonate or bicarbonate which are susceptible to compete with DS- adsorption [16]. The SDS concentration used here is 10.4 mmol.L-1 and DS- adsorption on hydrate surface may occur, and it may be probable that this adsorption confers anti-agglomerant properties to the hydrate particules. A porous hydrate structure can be also explained by the coexistence of two different hydrate structures [17], which is the case here with pure CO2 hydrate of structure s(I) and mixed CO2+THF hydrates of structure s(II). The creation of this porous structure is consistent with the observations of Fig 2 where the liquid level observed through the reactor window is decreasing very fast when hydrate formation occurs. A proposed mechanism is that the porous hydrate habit grows on the cold reactor shell and this microporous structure pumps the aqueous phase by capillarity. This “capillary driven” mechanism of hydrate formation has already been clearly identified by Gayet et al. (2005) [11] with propane hydrates.
The number of CO2 moles consumed versus time during the hydrate formation process in the semi-continuous configuration is presented in Figure 5 for six experiments. This quantity has been inferred from the pressure variation in the ballast and the Peng-Robinson equation of state.
0 0.05 0.1 0.15 0.2 0.25 0.3 0.35 0.4 0 10000 20000 30000 40000 50000 time (s) q u a n ti ty o f C O 2 c a p tu re d ( m o l) # 1 # 2 # 3 # 4 # 5 # 6 (dn/dt)mean+ 18 % (dn/dt)mean- 18 % (dn/dt)mean= 1.22 10-5mol/s 0 0.05 0.1 0.15 0.2 0.25 0.3 0.35 0.4 0 10000 20000 30000 40000 50000 time (s) q u a n ti ty o f C O 2 c a p tu re d ( m o l) # 1 # 2 # 3 # 4 # 5 # 6 (dn/dt)mean+ 18 % (dn/dt)mean- 18 % (dn/dt)mean= 1.22 10-5mol/s
Figure 5. CO2 consumption as a function of time in
semi-continuous configuration for six experiments.
It can be remarked that the behavior has a general linear tendency consistent with a pseudo-first order kinetics model. One example is the well known Englezos–Kalogerakis–Dholabhai–Bishnoi kinetic model [18]. From the results displayed in Fig. 5 (corresponding to six different experiments), the reproducibility is deemed acceptable. Considering this first order behaviour, the mean hydrate growth rate is estimated to be 1.22 10-5 mol/s ± 18 %. In some experiments (#2, #3 and #5), the hydrate growth rate is observed to increase slightly after ~15000 s.
Table 1 shows the results of water conversion into hydrates for the six experiments presented in Fig. 5. At the end of CO2 solubilization period, the gas reactor temperature and pressure in (2) is TR(2) = 20.1 ± 0.1 °C and PR(2) = 27.0 bar. At the beginning and end of the semi-continuous CO2 enclathration, the gas temperature in the reactor is TR(3) = T
R
(4) = 2.1 ± 0.1 °C. Reactor pressure is maintained at 18.9 bar and ballast temperature at 2.0 °C in experiment # 1 and 10.0 °C in experiments #2 to #6.
Table 1. Molar proportion of water converted into hydrate in experiments # 1 to 6. Ballast temperature is 2.0 °C in expt. #1 and 10.0 °C in expts. 2 to 6. # expt. P B (3) (bar) PB(4) (bar) ∆nB(3-4) (mol) τ (%) #1 33.4 19.8 0.3898 98.6 #2 39.4 27.2 0.3814 96.6 #3 37.3 24.3 0.3766 95.5 #4 40 28.5 0.3705 94.1 #5 40.6 29.7 0.3620 92.0 #6 39.2 27 0.3789 96.0
The molar proportion τ of water converted into hydrate (defined as the number of moles of water in the hydrate phases divided by total number of moles of water) at the end of the semi-batch period has been calculated for the six experiments. The calculation of water conversion is detailed in Appendix, considering the five following reasonable assumptions:
1. The volume of the gas phase remains constant over the duration of the experiment (the hydrate volume expansion has not been considered);
2. THF is fully converted into the mixed s(II) hydrate, which has the following molecular formula: 2CO2-THF-17H20 [12]. Once formed this hydrate remains stable in the presence of the CO2 s(I) hydrates [13] ;
3. The CO2 s(I) hydrate has the following formula: CO2-7.3H2O [19] ;
4. As the solution contained only 1 wt.% of THF, the liquid phase is considered as ideal (ρsol = 997.0 kg/m3) ;
5. The presence of water and THF in the gas phase is neglected.
With this simplified model, the water conversion is found to be larger than 90% for all the experiments. The reproducibility of the final water conversion is found very acceptable as the maximum deviation is inferior to 7 %. A more elaborated model is actually in progress to correct for some of the assumptions.
5. CONCLUSIONS
In this study, a quiescent CO2 enclathration process operated in a semi-continuous configuration has been tested and the possible driving mechanisms of the water-soluble hydrate additives are analyzed and discussed. The results show that the combination of a small quantity of SDS and THF performs well in quiescent semi-continuous configuration. Some further evidence is provided for the mechanisms proposed previously from experiments in the batch configuration. A mixed CO2+THF hydrate of structure II forms firstly, which then promotes the formation of the pure CO2 hydrate. It is likely that the latter step is favored by a porous hydrate structure formed after the formation of the mixed CO2+THF hydrate. These two observations bear some resemblance with those already noted with another s(II) hydrate-forming additive, cyclopentane, in place of THF. An interesting result is that it is possible to convert in hydrates more than 90 % of initial water, in static conditions, with a quasi-constant hydrate growth-rate. However, the hydrate growth rate obtained here is still too low and enhancing the formation kinetics to an acceptable level requires further work.
Subsequent investigations will consist in better characterizing the mechanisms that drive this
two-step process and in understanding the critical role played by the surfactant molecules used as additive in conjunction to the organic hydrate s(II) forming molecules.
On the practical side, further work will consist in extending the above experiments to gas mixtures representative of natural gas streams, such as CO2 -CH4 mixtures, with the purpose of assessing whether the above two-step hydrate formation process could be used to capture CO2. An effort in that direction is reported in the companion paper by Ricaurte and co-workers [20].
REFERENCES
[1] IPCC, Intergovernmental Panel on Climate Change (2007). Climate change 2007: synthesis
report.
http://www.ipcc.ch/publications_and_data/publicat ions_ipcc_fourth_assessment_report_synthesis_re port.htm
[2] Sun C, Li W, Yang X, Li F, Yuan Q, Mu L, Chen J, Liu B, Chen G. Progress in Research of
Gas Hydrate. Chinese Journal of Chemical
Engineering 2011;19(1):151–162.
[3] Herri J-M, Bouchemoua A, Kwaterski M, Fezoua A Ouabbas Y, Cameirao A. Gas hydrate
next term equilibria for CO2–N2 and CO2–CH4
gas mixtures—Experimental studies and thermodynamic modelling. Fluid Phase Equilibria
2011;301(2):171–190.
[4] Lazzaroni MJ, Bush D, Jones R, Hallett JP, Liotta CL, Eckert CA. High-pressure phase
equilibria of some carbon dioxide–organic–water systems. Fluid Phase Equilibria 2004;224:143–
154.
[5] Liu N, Gong G, Liu D, Xie Y. Effect of
additives on carbon dioxide hydrate formation.
Proceedings of the 6th International Conference on Gas Hydrates (ICGH 2008); Vancouver, Canada, July 6-10, 2008.
[6] Torré J-P, Dicharry C, Ricaurte M, Daniel-David D, Broseta D. CO2 capture by hydrate
formation in quiescent conditions: in search of efficient kinetic additives. Energy Procedia journal
[7] Linga P, Kumar R, Lee JD, Ripmeester J., Englezos P. A new apparatus to enhance the rate
of gas hydrate formation: Application to capture of carbon dioxide. International Journal of
Greenhouse Gas Control 2010; 4(4): 630–637. [8] NIST webbook
http://webbook.nist.gov/chemistry/
[9] Duchateau C, Dicharry C, Peytavy J-L, Glenat P, Pou TE., Hidalgo M. Laboratory Evaluation of
Kinetic Hydrate Inhibitors: A Procedure for Enhancing the Repeatability of Test Results.
Energy Fuels 2009;23(2):962–966.
[10] Sloan ED, Koh CA. Clathrate hydrates of
natural gases. 3rd edition. New York: CRC Press;
2008.
[11] Gayet P, Dicharry C, Marion G, Graciaa A, Lachaise J, Nesterov A. Experimental determination of methane hydrate dissociation curve up to 55MPa by using a small amount of surfactant as hydrate promoter. Chemical Engineering Science 2005;60:5751–5758.
[12] Delahaye A, Fournaison L, Marinhas S, Chatti I, Petitet J-P, Dalmazzone D, Fürst W.
Effect of THF on equilibrium pressure and dissociation enthalpy of CO2 hydrates applied to
secondary refrigeration. Ind. Eng. Chem. Res.
2006;45:391–397.
[13] Shin HJ, Lee Y-J, Im J-H, Han KW, Lee J-W, Lee Y, Lee JD, Jang W-Y, Yoon J-H.
Thermodynamic stability spectroscopic identification and cage occupation of binary CO2
clathrate hydrates. Chemical Engineering Science
2009;64:5125–5130.
[14] Zhang J, Lee JW. Enhanced Kinetics of CO2
Hydrate Formation under Static Conditions. Ind.
Eng. Chem. Res. 2009;48:5934–5942.
[15] Zhang JS, Lo C, Somasundaran P, Lu S, Couzis A, Lee JW. Adsorption of Sodium Dodecyl
Sulfate at THF Hydrate/Liquid Interface. J. Phys.
Chem. C 2008;112(32):12381–12385.
[16] Zhang JS. Lo C, Somasundaran P, Lee JW.
Competitive adsorption between SDS and carbonate on tetrahydrofuran hydrates. Journal of
Colloid and Interface Science 2010;341:286–288. [17] Schicks JM, Naumann R, Erzinger J, Hester KC, Koh CA, Sloan ED Jr. Phase transitions in
mixed gas hydrates: experimental observations versus calculated data. J. Phys. Chem. B
2006 ;110:11468–11474.
[18] Ribeiro Jr. CP, Lage PLC. Modelling of
hydrate formation kinetics: State-of-the-art and future directions. Chemical Engineering Science
2008; 63:2007–2034.
[19] Uchida T, Hondoh T, Mae S, Kawabata J. Physical data of CO2 hydrate. Direct Ocean Disposal Of Carbon Dioxide, 45-61, Terra Scientific Publishing Company, Tokyo 1995. [20] Ricaurte M, Torré J-P, Broseta D, Diaz J, Dicharry C. CO2 removal from A CO2-CH4 gas
mixture by hydrate formation: evaluation of additives and operating conditions. Proceedings of
the 7th International Conference on Gas Hydrates (ICGH 2011), Edinburgh, Scotland, United Kingdom, July 17-21, 2011.
APPENDIX
Calculation of the water converted into hydrates at the end of the experiment.
The water converted into hydrate at the end of the experiment is estimated here on a molar basis:
w I w II w n n n )/ ( + = τ Eq. (1)
where nwis the number of moles of water loaded in the vessel,
II w
n and I w
n are the number of moles of water contained respectively in the mixed THF+H2O s(II) hydrates and in the CO2 s(I) hydrates.
τ is obtained from the two equations expressing the conservation of water and CO2. The conservation of water is: w I w II w w n n n n = + + (1 −
τ
) Eq. (2)where nwII =17nTHF (nTHF is the number of moles of THF loaded in the vessel), nwI =7.3nCOI 2 with I
CO
n 2is the number of moles of CO2 in the CO2 s(I) hydrate phase. The last term (1−
τ
)nwis the water remaining liquid.Note that the points (2), (3) and (4) represent the end of the solubilization period, the end of the batch mode, and the end of the semi-batch mode, respectively.
In (4), the conservation of CO2 gives:
) 4 ( , 2 ) 3 ( , 2 ) 2 ( ) 2 ( , 2 2 n (T,P) (n n )S(T,P,x ) n (T,P) n (T,P) n COB g B g CO THF THF w R g CO CO = + + + − Eq. (3)
with nCO2 being the total number of moles of CO2 in the vessel, nwand
n
THF the total moles of water and THF,n
COR 2,g the moles of CO2 gas present in the reactor,S
(
T
,
P
,
x
THF)
the solubility of CO2 in the H2O/THF solution, andB g CO
n
2, the moles of CO2 present in the ballast. Similarly, we have in (4): ) 4 ( 2 2 ) 4 ( , 2 2 n (T,P) n n (1 )n S(T,P) nCO = COR g + COII + COI + −τ
w Eq.(4) with ) 4 ( , 2 (T,P)nCOR g and (1−
τ
)nwS(T,P)(4) being respectively the number of moles of CO2 gaspresent in the reactor at point (4) (T(4) = 2.1°C and P(4) = 18.9 bar) and S(T,P,x)(4) being the solubility of CO2 in water (S defined as the number of moles of CO2 dissolved in one mole of water).) , (
,
2 T P
nCOR g and
n
COB 2,g(
T
,
P
)
are calculated using the Peng-Robinson EOS with theV
gRandV
gB volumes of the gas in the reactor and ballast, respectively.We have measured experimentally the solubility of CO2 in water and in water/THF solutions for different temperatures and various THF concentrations. The values considered in the calculations are:
) 2 ( ) , , (T P xTHF
S = 0.0143 mole of CO2 / mole of solution for
R
T
(2)= 20.1 °C,P
(R2) = 27.0 bars,x
THF = 1 wt.%, and S(T,P)(4) = 0.0186 mole of CO2 / mole of solution forR
T
(4)= 2.1 °C,P
(R4)= 18.9 bars. − + = − − + = − + + − + − w I CO THF w w I CO THF THF THF w B g CO B g CO R g CO R g CO n n n n P T S n n n x P T S n n P T n P T n P T n P T n ) 1 ( 3 . 7 17 ) , ( ) 1 ( 2 ) , , ( ) ( ) , ( ) , ( ) , ( ) , ( 2 ) 4 ( 2 ) 2 ( ) 4 ( , 2 ) 3 ( , 2 ) 4 ( , 2 ) 2 ( , 2
τ
τ
Eq.(5)The only unknown variables in the above two linear equations are nCOI 2 and τ, which are easily calculated.
ACKNOWLEDGEMENTS
The technical staff of University of Pau (“Atelier de Physique”, T. Mesplou and P. Plouraboue) is acknowledged for the work done on the experimental rig.