Pépite | Comprendre et concevoir les animations dans le contexte des interfaces graphiques
168
0
0
Texte intégral
(2) Thèse de Amira Chalbi Neffati, Université de Lille, 2018. ii. © 2018 Tous droits réservés.. lilliad.univ-lille.fr.
(3) Thèse de Amira Chalbi Neffati, Université de Lille, 2018. iii. Abstract Despite their increasing popularity and omnipresence in modern graphical interfaces, animations are still largely under-comprehended. While prior research and practice provide useful insights about the merits and downsides of animation, it is still unclear what makes a good and effective animation that improves the usability and expressivity of graphical interfaces. The disparity of opinions about the value of animation is mainly due to the fact that most of previous studies have investigated the benefit of adding a particular animation to a particular interface, leaving a notable gap in the deep understanding of the many design aspects that influence the performance of animation. Prior research have also predominantly assessed the value of animation through a narrow empirical angle, which had left several facets of animation unveiled. This thesis contributes a first constructive step toward better understanding the vast design space of animation and mapping out the various merits of animation that can enrich user interfaces from different perspectives. We first provide a structured view of the roles and drawbacks of animation in user interfaces. We then present the theoretical fundamentals for animation in information visualization. We discuss the main challenges for designing and evaluating animation in dynamic visualizations. Through an empirical study, we investigate the meaning of the Common Fate Law, applied on animation trajectories, in dynamic visualizations. We then introduce a design space that allows a holistic characterization of staged animation and propose an authoring tool to support the prototyping and exploration of staging in visualizations.. © 2018 Tous droits réservés.. lilliad.univ-lille.fr.
(4) Thèse de Amira Chalbi Neffati, Université de Lille, 2018. © 2018 Tous droits réservés.. lilliad.univ-lille.fr.
(5) Thèse de Amira Chalbi Neffati, Université de Lille, 2018. v. Résumé Malgré leur omniprésence croissante dans les interfaces graphiques modernes, les animations sont encore sous-appréhendées. Bien que la recherche et la pratique fournissent des directives utiles, nous n’avons pas encore une idée claire sur ce qui définit une animation efficace pour les interfaces. La discorde sur la valeur de l’animation est principalement due au fait que la plupart des études précédentes ont étudié l’avantage d’ajouter une animation particulière à une interface particulière, laissant un manque notable dans la compréhension des nombreux aspects qui influencent la performance de l’animation. Ces études ont aussi évalué la valeur de l’animation à travers un angle empirique étroit, ce qui fait que plusieurs facettes de l’animation restent non dévoilées. Cette thèse contribue un premier pas vers une compréhension plus profonde du vaste espace de conception de l’animation, et vers une meilleure assimilation des différents mérites de l’animation. Nous fournissons d’abord une vue structurée sur les rôles et les inconvénients de l’animation dans les interfaces graphiques. Nous présentons ensuite les fondements théoriques de l’animation pour la visualisation d’information. Nous discutons les principaux défis pour la conception et l’évaluation de l’animation dans les visualisations dynamiques. Nous étudions la signification de la Loi du Destin Commun, appliquée aux trajectoires d’animation, dans les visualisations dynamiques. Nous introduisons ensuite un espace de conception qui permet une caractérisation holistique de l’animation séquentielle, et proposons un outil de création pour permettre le prototypage et l’exploration du “staging” dans les visualisations.. © 2018 Tous droits réservés.. lilliad.univ-lille.fr.
(6) Thèse de Amira Chalbi Neffati, Université de Lille, 2018. © 2018 Tous droits réservés.. lilliad.univ-lille.fr.
(7) Thèse de Amira Chalbi Neffati, Université de Lille, 2018. vii. Contents. 1. Introduction 1.1 Thesis statement and goals . . . . . . . . . . . . . . . . . . . . . . . . . . . 1.2 Research contributions . . . . . . . . . . . . . . . . . . . . . . . . . . . . .. 2. Roles and drawbacks of animation in user interfaces 2.1 The 23 roles of animation in visual interfaces . . . . . . . . . . 2.1.1 Preliminary qualitative exploration . . . . . . . . . . . . 2.1.2 Taxonomy Methodology . . . . . . . . . . . . . . . . . 2.1.3 Taxonomy of animation roles . . . . . . . . . . . . . . Keeping in Context . . . . . . . . . . . . . . . . . . . . Teaching Aid . . . . . . . . . . . . . . . . . . . . . . . User Experience . . . . . . . . . . . . . . . . . . . . . Data Encoding . . . . . . . . . . . . . . . . . . . . . . Visual Discourse . . . . . . . . . . . . . . . . . . . . . 2.1.4 Animation roles and people: summary and discussion . 2.1.5 General discussion . . . . . . . . . . . . . . . . . . . . Coverage of general roles of animation by our taxonomy Combinations of roles and granularity . . . . . . . . . . What limits the roles of animation? . . . . . . . . . . . 2.2 Animation drawbacks and people . . . . . . . . . . . . . . . . . 2.2.1 Why people do not use animation? . . . . . . . . . . . . 2.2.2 Examples of ineffective animation as seen by people . . 2.2.3 Classification of animation drawbacks as seen by people 2.3 Conclusion . . . . . . . . . . . . . . . . . . . . . . . . . . . .. 3. 4. © 2018 Tous droits réservés.. 1 8 8. . . . . . . . . . . . . . . . . . . .. . . . . . . . . . . . . . . . . . . .. . . . . . . . . . . . . . . . . . . .. . . . . . . . . . . . . . . . . . . .. . . . . . . . . . . . . . . . . . . .. 10 11 12 13 14 15 20 25 30 33 36 38 38 39 39 40 40 41 42 42. Understanding dynamic information visualizations 3.1 Information visualization: a simplified model . . . . . . . . . . . . . 3.2 From abstract data to visual representation: visual encoding . . . . . . 3.3 Dynamics of an information visualization . . . . . . . . . . . . . . . 3.3.1 Visualization states mapping . . . . . . . . . . . . . . . . . . 3.3.2 Characterizing dynamic changes in information visualization . 3.3.3 A taxonomy of dynamic changes in information visualization Levels of dynamic change . . . . . . . . . . . . . . . . . . . Data-Driven Change . . . . . . . . . . . . . . . . . . . . . . Visual-Driven Change . . . . . . . . . . . . . . . . . . . . . Variation of types of change based on the scope of change . . 3.3.4 Manner of a dynamic change . . . . . . . . . . . . . . . . . . 3.4 Conclusion . . . . . . . . . . . . . . . . . . . . . . . . . . . . . . .. . . . . . . . . . . . .. . . . . . . . . . . . .. . . . . . . . . . . . .. . . . . . . . . . . . .. 44 44 45 47 48 49 51 51 52 53 53 54 56. . . . . . .. 57 57 57 58 59 60 61. . . . . . . . . . . . . . . . . . . .. . . . . . . . . . . . . . . . . . . .. Animation for information visualization: fundamentals and challenges 4.1 Fundamentals of animation . . . . . . . . . . . . . . . . . . . . . . . 4.1.1 Animation parameters . . . . . . . . . . . . . . . . . . . . . 4.1.2 Elementary and composite animation . . . . . . . . . . . . . 4.1.3 Composition based on trajectory . . . . . . . . . . . . . . . . 4.1.4 Temporal composition . . . . . . . . . . . . . . . . . . . . . 4.2 Designing animation for information visualizations . . . . . . . . . .. . . . . . .. . . . . . .. . . . . . .. lilliad.univ-lille.fr.
(8) Thèse de Amira Chalbi Neffati, Université de Lille, 2018. viii 4.2.1. 4.3. 4.4 4.5 5. © 2018 Tous droits réservés.. Understanding animation parameters . . . . . . . . . . . . Understanding animation trajectories . . . . . . . . . . . . Understanding the temporal parameters of animation . . . . 4.2.2 Defining animation parameters . . . . . . . . . . . . . . . . Evaluating animation in information visualizations . . . . . . . . . 4.3.1 Metrics to measure the value of animation . . . . . . . . . . 4.3.2 Evaluation methodology . . . . . . . . . . . . . . . . . . . Studied animation goals . . . . . . . . . . . . . . . . . . . Evaluation methodology . . . . . . . . . . . . . . . . . . . General user study design considerations . . . . . . . . . . Independent variables . . . . . . . . . . . . . . . . . . . . Dependent variables . . . . . . . . . . . . . . . . . . . . . Tasks . . . . . . . . . . . . . . . . . . . . . . . . . . . . . Running a study . . . . . . . . . . . . . . . . . . . . . . . People and animation: insights for animation design and evaluation Conclusion . . . . . . . . . . . . . . . . . . . . . . . . . . . . . .. Reflecting on the meaning of Common Fate in visualization 5.1 Background . . . . . . . . . . . . . . . . . . . . . . . . . 5.1.1 Perception and Gestalt psychology . . . . . . . . . 5.1.2 Gestalt Laws in visualization . . . . . . . . . . . . 5.1.3 Perception in visualization . . . . . . . . . . . . . 5.2 The Gestalt Law of Common Fate . . . . . . . . . . . . . 5.2.1 Criteria for perceptual grouping . . . . . . . . . . 5.2.2 Visual variables with grouping . . . . . . . . . . . 5.3 User study background . . . . . . . . . . . . . . . . . . . 5.3.1 Task rationale . . . . . . . . . . . . . . . . . . . . 5.3.2 Summary of tasks . . . . . . . . . . . . . . . . . . 5.3.3 Manipulation of visual variables . . . . . . . . . . 5.3.4 Design decisions . . . . . . . . . . . . . . . . . . 5.3.5 Grouping strength . . . . . . . . . . . . . . . . . 5.4 User study . . . . . . . . . . . . . . . . . . . . . . . . . . 5.4.1 Task generation . . . . . . . . . . . . . . . . . . . 5.4.2 Attention trials . . . . . . . . . . . . . . . . . . . 5.4.3 Experimental protocol . . . . . . . . . . . . . . . 5.5 Results . . . . . . . . . . . . . . . . . . . . . . . . . . . . 5.5.1 Data verification . . . . . . . . . . . . . . . . . . 5.5.2 Dynamic vs. static groupings . . . . . . . . . . . . 5.5.3 Relations between Gestalt Laws . . . . . . . . . . 5.5.4 Participants feedback . . . . . . . . . . . . . . . . 5.6 Discussion . . . . . . . . . . . . . . . . . . . . . . . . . . 5.6.1 Implications for dynamic information visualization 5.6.2 Limitations . . . . . . . . . . . . . . . . . . . . . 5.7 Evaluation scenarios to assess our design implications . . . 5.7.1 Make a particular group salient . . . . . . . . . . . 5.7.2 Revealing multiple groups . . . . . . . . . . . . . 5.8 Conclusion . . . . . . . . . . . . . . . . . . . . . . . . .. . . . . . . . . . . . . . . . . . . . . . . . . . . . . .. . . . . . . . . . . . . . . . . . . . . . . . . . . . . .. . . . . . . . . . . . . . . . . . . . . . . . . . . . . .. . . . . . . . . . . . . . . . . . . . . . . . . . . . . .. . . . . . . . . . . . . . . . . . . . . . . . . . . . . .. . . . . . . . . . . . . . . . .. . . . . . . . . . . . . . . . .. . . . . . . . . . . . . . . . .. . . . . . . . . . . . . . . . .. . . . . . . . . . . . . . . . .. 61 61 62 63 65 65 67 67 68 68 70 70 70 71 71 72. . . . . . . . . . . . . . . . . . . . . . . . . . . . . .. . . . . . . . . . . . . . . . . . . . . . . . . . . . . .. . . . . . . . . . . . . . . . . . . . . . . . . . . . . .. . . . . . . . . . . . . . . . . . . . . . . . . . . . . .. . . . . . . . . . . . . . . . . . . . . . . . . . . . . .. 74 74 75 75 75 76 76 77 78 78 78 79 81 81 81 82 83 83 84 85 85 86 87 87 88 88 89 89 90 90. lilliad.univ-lille.fr.
(9) Thèse de Amira Chalbi Neffati, Université de Lille, 2018. ix 6. 7. Exploring and supporting the design of staged animation 6.1 Staged Animation . . . . . . . . . . . . . . . . . . . . 6.1.1 Motivation . . . . . . . . . . . . . . . . . . . 6.1.2 Limitations and Challenges of Staging . . . . . 6.1.3 Staging in Traditional Animation . . . . . . . 6.1.4 Animation Choreography: a Model for Staging 6.2 Design Space Overview . . . . . . . . . . . . . . . . . 6.3 Design Space: Fixed Dimensions . . . . . . . . . . . . 6.3.1 Data Attributes . . . . . . . . . . . . . . . . . 6.3.2 Change Characteristics . . . . . . . . . . . . . 6.3.3 Observer Task . . . . . . . . . . . . . . . . . 6.4 Design Space: Variable Dimensions . . . . . . . . . . 6.4.1 Staging Strategy . . . . . . . . . . . . . . . . 6.4.2 Staging Design . . . . . . . . . . . . . . . . . Decomposition . . . . . . . . . . . . . . . . . Timing . . . . . . . . . . . . . . . . . . . . . 6.5 Values of Animation Choreography . . . . . . . . . . 6.6 Describing Animation Choreography . . . . . . . . . . 6.6.1 Staging Hierarchy . . . . . . . . . . . . . . . 6.6.2 Scenario: Exploring a Co-authorship Network . 6.7 Authoring Animation Choreography . . . . . . . . . . 6.7.1 Design considerations . . . . . . . . . . . . . 6.7.2 Prototype . . . . . . . . . . . . . . . . . . . . 6.8 Conclusion . . . . . . . . . . . . . . . . . . . . . . .. . . . . . . . . . . . . . . . . . . . . . . .. . . . . . . . . . . . . . . . . . . . . . . .. . . . . . . . . . . . . . . . . . . . . . . .. . . . . . . . . . . . . . . . . . . . . . . .. . . . . . . . . . . . . . . . . . . . . . . .. . . . . . . . . . . . . . . . . . . . . . . .. . . . . . . . . . . . . . . . . . . . . . . .. . . . . . . . . . . . . . . . . . . . . . . .. . . . . . . . . . . . . . . . . . . . . . . .. . . . . . . . . . . . . . . . . . . . . . . .. . . . . . . . . . . . . . . . . . . . . . . .. . . . . . . . . . . . . . . . . . . . . . . .. 92 93 93 95 96 96 97 97 98 98 99 99 100 100 101 103 107 114 114 115 117 117 119 120. Conclusion & perspectives 122 7.1 Summary . . . . . . . . . . . . . . . . . . . . . . . . . . . . . . . . . . . . 122 7.2 Future work . . . . . . . . . . . . . . . . . . . . . . . . . . . . . . . . . . . 123. A Publications. 126. B Generation rules of employees dataset. 127. Bibliography. 130. © 2018 Tous droits réservés.. lilliad.univ-lille.fr.
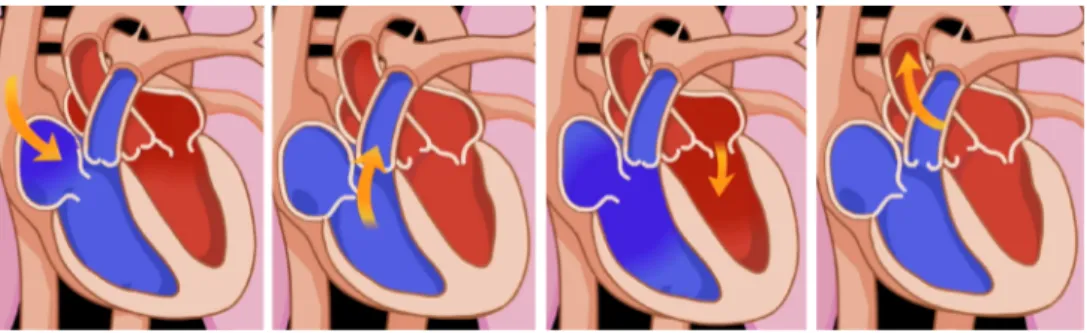
(10) Thèse de Amira Chalbi Neffati, Université de Lille, 2018. x. List of Figures. One of the Chauvet Cave paintings illustrating a scene of hunting. Azéma and Rivère claimed that flickering torches passed over these painted scenes would have heightened onlookers’ sense of seeing live-action stories thanks to the optical phenomenon known as the persistence of vision [Sto; AR12]. . . . . . 1.2 Ancient artists at Chauvet Cave superimposed drawings of two stances of a bison to depict the movement of running [Prea]. . . . . . . . . . . . . . . . . 1.3 A painting discovered at Lascaux Cave where three images of horse’s head are superimposed to depict the movement of head tossing [Prea]. . . . . . . . 1.4 A drawing found at the Cave of the Trois-Frères where ancient artists drew two superimposed images of an animal trail to depict the movement of trail’s shaking [Prea]. . . . . . . . . . . . . . . . . . . . . . . . . . . . . . . . . . 1.5 The Vitruvian Man: a drawing by Leonardo da Vinci done around 1490 depicting a man in two superimposed positions with his arms and legs apart and inscribed in a circle and square [Vit]. . . . . . . . . . . . . . . . . . . . 1.6 The onion skining tool in Autodesk Maya [Oni]. . . . . . . . . . . . . . . . . 1.7 A freeze-frame drawing representing a lion running from left to right discovered at the La Vache Cave [AR12]. . . . . . . . . . . . . . . . . . . . . . . 1.8 A reconstruction of the The Laugerie-Basse spinning disk by Rivère shows a chamois in different positions on each side: standing on one side of the disc (left image), and lying on the other (right image) [AR12]. When the disk is twirled on a string, the creature appears to move (see animation in [Dis]). . . 1.9 Top: a demonstration of a bird and cage thaumatrope [Thaa]. Bottom: Both sides of a bouquet and vase thaumatrope from 1825 [Thab]. . . . . . . . . . . 1.10 (a) Mechanism of the chronophotographic gun, (b) Marey used the gun to study the movement of birds, (c) an “animated photograph” recording 12 movement’s phases of a group of birds [Mara; Marb]. . . . . . . . . . . . . . 2.1 A staged animation to support navigation between directories in a 3D tree-map visualization. When a user opens a directory, (a) the directory begins with a fade-out, (b) followed by a short pause, then (c,d) the new current directory is expanded to fill the space formerly occupied by its ancestor. [BCK05] . . . . 2.2 Illustration of Role 2: Details of an animated transition between a PDF article and its corresponding LaTeX source code in Gliimpse [DHC11] . . . . . . . 2.3 Illustration of Role 3: PlanePlotter [Air] visualizes air traffic in real time. . . 2.4 Illustration of Role 4: Mnemonic Desktop [BDB06] reveals hidden parts of windows by showing motion trails and a dusty appearance that will fade out as changes are being replayed. . . . . . . . . . . . . . . . . . . . . . . . . . 2.5 Illustration of Role 5: When the user selects a tool in Google Sketchup’s instructor [Ske], the instructor shows her an animation that explains the basic use of this selected tool. . . . . . . . . . . . . . . . . . . . . . . . . . . . . . 2.6 Illustration of Role 6: GestureBar [Bra+09] shows an illustrative animation to teach the user the gesture to perform in order to delete a shape. . . . . . . . . 2.7 Illustration of Role 7: Educative animation using bouncing arrows to illustrate blood flow in the heart–adapted from “Exploring the Heart-The Circulatory System!” by AboutKidsHealth (Youtube). . . . . . . . . . . . . . . . . . . . 2.8 Illustration of Role 8: An animation that illustrates how the bubble sorting algorithm works [Vis]. . . . . . . . . . . . . . . . . . . . . . . . . . . . . . 1.1. © 2018 Tous droits réservés.. 1 2 2. 2. 2 2 3. 3 4. 5. 16 17 18. 18. 21 21. 22 23. lilliad.univ-lille.fr.
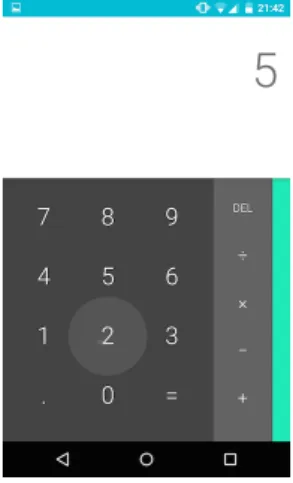
(11) Thèse de Amira Chalbi Neffati, Université de Lille, 2018. xi 2.9 2.10 2.11. 2.12 2.13 2.14 2.15 2.16 2.17. 2.18. 2.19 2.20. 2.21. 2.22 2.23. 2.24. 2.25. 3.1. © 2018 Tous droits réservés.. Illustration of Role 9: An animation in NodeTrix [HFM07] that explains step-by-step the change from a node-link diagram (1) to an adjacency matrix (5) Illustration of Role 10: Soundhound [Sou] mobile app plays an animation of radiating bubbles of changing colors while listening to user’s voice input. . . Illustration of Role 11: In the game HayDay [Hay], each time the player wins a star, a animated star jumps from the play scene to the the stars’ counter on the top and a blinking star indicates the increase of the score. . . . . . . . . . Illustration of Role 12: An animation is used to simulate a curtain effect when sliding a window to reveal underneath content on a mobile phone [Eke17]. . . Illustration of Role 13: A cartoon-style animation of progress bar to entertain online visitors while the website is loading. . . . . . . . . . . . . . . . . . . Illustration of Role 14: Ephemeral adaptation progressively reveals content in menus based on history–adapted from [Fin+09]. . . . . . . . . . . . . . . . . Illustration of Role 15: A 3D tour in Urbane [Fer+15] to understanding the impact of different building designs. . . . . . . . . . . . . . . . . . . . . . . Illustration of Role 16: Ripple animation effect in the calculator application on Android. . . . . . . . . . . . . . . . . . . . . . . . . . . . . . . . . . . . Illustration of Role 17: Animated bubble chart on Gapminder website representing the change of the number of babies per woman and life expectancy over years. Viewers can select specific countries and choose to display trails during animation in order to be able to compare the evolution of these countries. [Gapa] . . . . . . . . . . . . . . . . . . . . . . . . . . . . . . . . . . . Illustration of Role 18: To convey randomness, Han et al. [Han+12] used animation to randomly change the pattern of dark icons (representing people suffering from cancer) every 2 seconds . . . . . . . . . . . . . . . . . . . . . Illustration of Role 19: Polly is a walking prism whose motion conveys a mood [Pol] . . . . . . . . . . . . . . . . . . . . . . . . . . . . . . . . . . . Illustration of Role 20: In Mobilistes [Sch+06], different categories of transportation means are animated in different manners. (a) Airplanes fly over the list from the right . (b) Buses get compressed, make a reverse gear to the left and then got inserted in their new position. (c) Cars get compacted, then make a half turn to the left towards their new position. . . . . . . . . . . . . . . . . Illustration of Role 21: Four-stage animation in “Fallen of World War II’ featuring the global evolution between 1940 and 2010 of colonial wars first (purple bars), then interstate wars (green bars) followed by civil wars (yellow bars) and finally civil wars with foreign intervention (orange bars). An additional stage allows a presentation change: a zoom operation for better overview [Fal]. . . . . . . . . . . . . . . . . . . . . . . . . . . . . . . . . . Illustration of Role 22: In this data-story video, animation is used to highlight the content of focus during the narration. [Wea] . . . . . . . . . . . . . . . . Illustration of Role 23: Animation shows how flu spreads in a population of vaccinated (blue) and vulnerable (yellow) children– Adapted from The Guardian [Mea] . . . . . . . . . . . . . . . . . . . . . . . . . . . . . . . . . The number of participants in our preliminary exploration that mentioned examples of animation illustrating each role in our taxonomy of 23 animation roles. . . . . . . . . . . . . . . . . . . . . . . . . . . . . . . . . . . . . . . . The number of practionners in our validation interviews that mentioned examples of animation illustrating each role in our taxonomy of 23 animation roles. . . . . . . . . . . . . . . . . . . . . . . . . . . . . . . . . . . . . . . . The Reference Model pattern, adapted from [HA06] . . . . . . . . . . . . . .. 24 25. 26 27 27 28 29 29. 31. 31 32. 32. 34 34. 35. 37. 38 45. lilliad.univ-lille.fr.
(12) Thèse de Amira Chalbi Neffati, Université de Lille, 2018. xii 3.2 3.3 3.4 3.5 3.6 4.1 5.1. 5.2. 5.3. 6.1. 6.2. 6.3. 6.4. © 2018 Tous droits réservés.. Our simplified model of information visualization based on the Reference Model pattern [HA06]. . . . . . . . . . . . . . . . . . . . . . . . . . . . . . Components of a visual representation of data . . . . . . . . . . . . . . . . . An excerpt of an imaginary dataset comparing elevation and prices of three categories of accommodation. . . . . . . . . . . . . . . . . . . . . . . . . . A sketch of visualization representing the maximum elevation of three categories of accommodation: house, apartment building and skyscraper. . . . . . Overview of the data and visual components based on our simplified model. . A scatterplot-like visualization where both the position, size and color of dots can evolve over time. . . . . . . . . . . . . . . . . . . . . . . . . . . . . . . User interface of our study, during a DS-SL task. Here, A-B and C-D are pairs of SL-similar objects, whereas A-D and B-C are pairs of DS-similar objects, forming the two concurrent possible groupings. . . . . . . . . . . . . . . . . Summary of the mean grouping strength for all visual variables examined in our study. Error bars are 95% CIs. The leftmost column shows the mean grouping strength per variable, for all comparisons it was involved in. The fact that the CIs of DP and DS fall to the right of the plots shows that these dynamic visual variables have stronger grouping strength than any other tested variables. Each cell in the tabular view shows the mean grouping strength of the corresponding visual variable in row (in orange) vs. that of the visual variable in column (in blue), for this task only. . . . . . . . . . . . . . . . . . Mean grouping strength for the dynamic variables (DP, DS, DL) in the context of a conflicting static grouping. Error bars are 95% CIs. That all CIs fall to the right of the halfway mark (0.5) shows that these dynamic variables have stronger grouping strength than static ones. . . . . . . . . . . . . . . . . . . Example of staging strategies animating the evolution of a population between two years. a) Elements are grouped and animated by gender: male first, then female. b) Elements are grouped and animated by behavior: increasing income first, followed by stable, then decreasing. . . . . . . . . . . . . . . . The design space of animation choreography. A design is informed by fixed dimensions, which include characteristics of the dataset, changes in the data or (re)presentation, and the task of the observer (end-user) of the visualization. The designer of the staging can vary the variable dimensions, including setting a strategy for staging which informs the decomposition and timing of the staging design. . . . . . . . . . . . . . . . . . . . . . . . . . . . . . . . . . Staged animation from an initial visualization showing the emergence of antibiotics in the US over years, to a final visualization presenting a list of all antibiotics, showing the original drug (blue square) and its derivatives (gray squares). (1) labels disappear and several blue squares (antibiotics) change to gray (derivatives). (2-3) squares shrink, disperse and organize into groups, aligned horizontally; (4-5) labels and legend appear while squares continue to move to form groups. . . . . . . . . . . . . . . . . . . . . . . . . . . . . . . The three scheduling alternatives, based on Allen’s seven primitive time relationships between two stages [All84]. . . . . . . . . . . . . . . . . . . .. 45 46 46 47 47 58. 82. 85. 86. 93. 97. 102 104. lilliad.univ-lille.fr.
(13) Thèse de Amira Chalbi Neffati, Université de Lille, 2018. xiii 6.5. 6.6. 6.7. 6.8. 6.9. 6.10. 6.11. © 2018 Tous droits réservés.. Comparison of a full (top) vs. staged (bottom) animation of Gapminder data (x-axis: fertility rate, y-axis: life expectancy, size: population, color: region). In full animation, all data points evolve simultaneously through their n states. Each frame of the animation shows all countries at the same year of their evolution. Staged animation decomposes by region across n states. The first and last frames of the animation correspond to the initial (year 1800) and final data state (year 2016). Each other frame shows data points at different time of their evolution. For instance, the frame at the second position shows the American countries (in yellow) during their evolution from year 1800 to 2016, whereas all other countries are still displayed with their state in 1800. Subsequent frames show the animation for the rest of the regions. . . . . . . 107 Staged animation of Gapminder data. As in Fig. 6.5, the staging decomposes the animation by region, one at a time. As the status panel at the bottom shows, the “America” and “East Asia & Pacific” regions have already been animated, the “Europe & Central Asia” is being animated and “South Asia” “Sub-Saharan Africa” remain to be animated. . . . . . . . . . . . . . . . . . 109 Six-stage animation showing the evolution of characters and their relations between 2 episodes (initial) and (6) of a TV-show [Got]: (1) edges disappear, (2) cluster hulls disappear, (3) nodes disappear, (4) remaining nodes (characters common to the two episodes) are repositioned to leave room for appearing nodes (new characters), (5) cluster hulls appear, and finally (6) edges appear to form the final network. . . . . . . . . . . . . . . . . . . . . . . . . . . . . 109 Example of a 3-level deep staging hierarchy, decomposing a full animation based on the criteria C1 (salary value), C2 (salary change), and C3 (job sector value). The leaf nodes correspond to the resulting stages S i , to be animated in order (depth-first traversal). . . . . . . . . . . . . . . . . . . . . . . . . . . . 114 Staging hierarchy for the co-authorship network scenario: (a) one-level staging based on the presence change of authors (Data Attribute Change);(b) one-level staging based on the topic (Data Attribute Value); (c) two-level staging based on the topic, then presence change of authors (Data Attribute Value and Data Attribute Change). . . . . . . . . . . . . . . . . . . . . . . . . . . . . . . . . 115 Gapminder data displayed in our prototype. The chosen staging decomposes the animation by region, one at a time. Here, the “America” and “East Asia & Pacific” regions have already been animated, the “Europe & Central Asia” region is being animated and the “South Asia” and “Sub-Saharan Africa” remain to be animated. . . . . . . . . . . . . . . . . . . . . . . . . . . . . . 119 Partial listing for a Gapminder animation staged with two levels, the first one depending on the country region and the second one on the initial fertility rate. 120. lilliad.univ-lille.fr.
(14) Thèse de Amira Chalbi Neffati, Université de Lille, 2018. xiv. List of Tables. 2.1. 2.2 5.1 6.1 6.2 6.3. © 2018 Tous droits réservés.. Taxonomy of roles by category. A ’4’ mark indicates a role that is present in Baecker and Small’s taxonomy [BS90]. A J mark indicates a role with notable research opportunities. . . . . . . . . . . . . . . . . . . . . . . . . . 15 Classification of animation drawbacks . . . . . . . . . . . . . . . . . . . . . 42 Summary of the different tasks generated from the comparison of our six visual variables. . . . . . . . . . . . . . . . . . . . . . . . . . . . . . . . . . 79 Classification of literature based on fixed and variable dimensions of animation choreography . . . . . . . . . . . . . . . . . . . . . . . . . . . . . . . . . . 105 Classification of data narrative examples from work by McKenna et al. [McK+17] based on fixed and variable dimensions of animation choreography . . . . . . 105 Classification of staged animations collected from data journalism, oral presentation applications and web advertisements . . . . . . . . . . . . . . . . . 106. lilliad.univ-lille.fr.
(15) Thèse de Amira Chalbi Neffati, Université de Lille, 2018. Chapter 1. Introduction. 1. Chapter 1 Introduction. Animation is not the art of DRAWINGS that-move but the art of MOVEMENTS that-are-drawn. — Norman Mclaren (1968) As illustrated in Mclaren’s quote above, animation in its broad definition involves all the various ways that have been used to convey different forms of movement. Humans invented many centuries ago various techniques to convey movement and dynamism which have evolved over the years as technology has progressed. A reading through history reveals that our ancestors have started depicting dynamic phenomena by drawing motion as early as they have acquired the capacity to draw. Even more fascinating, many archaeological studies unveil that our ancestors used cave paintings not only to represent movements but also narratives [Azé11; CA05c]. A notable example is the “Grand Panneau” painting at the Chauvet Cave in France that was deeply studied by the two French investigators Marc Azéma and Florent Rivère (see Figure 1.1). Azéma and Rivère claimed that the piece represents a hunting story composed of two main events running from left to right along the decorated wall. The first scene (see left rectangle in the Figure) shows several lions, ears back and heads lowered, stalking a prey. Mammoths and other animals appear nearby. The second scene of the painting (see right rectangle in the Figure) depicts a pride of 16 lions, some drawn smaller than the rest to appear farther away, lunge toward fleeing bison [Sto; AR12].. Figure 1.1: One of the Chauvet Cave paintings illustrating a scene of hunting. Azéma and Rivère claimed that flickering torches passed over these painted scenes would have heightened onlookers’ sense of seeing live-action stories thanks to the optical phenomenon known as the persistence of vision [Sto; AR12].. In addition to representing narratives and telling stories by sequencing events, Azéma and Rivère found that ancient Europeans were using cartoon-like techniques to give observers. © 2018 Tous droits réservés.. lilliad.univ-lille.fr.
(16) Thèse de Amira Chalbi Neffati, Université de Lille, 2018. Chapter 1. Introduction. 2. the impression that animals were moving across cave walls [Sto; AR12]. Thousands years ago, ancient artists created graphic stories in caves and illusions of movement and action using various techniques of “Stone Age Animation” [Sto]. Azéma and Rivère [AR12] claimed that the main Stone Age animation technique consisted of breaking down movement based on tow different processes: the superimposition of successive images, and the juxtaposition of successive images. The two investigators highlighted that “by these two procedures, prehistoric men foreshadowed one of the fundamental characteristics of visual perception, retinal persistence”. Stone Age artists primitively applied the technique of “split-action movement” by superimposing two or several successive images of animals at different stances to create the illusion of running (Figure 1.2), head tossing (Figure 1.3) or trail shaking (Figure 1.4). The famous “Vitruvian Man” (Figure 1.5) drawing by Leonardo da Vinci represents a more recent implementation of this ancient superimposition process. Nowadays, cartoon animation artists use a contemporary version of this process known as the “onion skinning” technique (Figure 1.6).. Figure 1.2: Ancient artists at Chauvet Cave superimposed drawings of two stances of a bison to depict the movement of running [Prea].. Figure 1.3: A painting discovered at Lascaux Cave where three images of horse’s head are superimposed to depict the movement of head tossing [Prea].. Figure 1.5: The Vitruvian Man: a drawing by Leonardo da Vinci done around 1490 depicting a man in two superimposed positions with his arms and legs apart and inscribed in a circle and square [Vit].. Figure 1.4: A drawing found at the Cave of the Trois-Frères where ancient artists drew two superimposed images of an animal trail to depict the movement of trail’s shaking [Prea].. Figure 1.6: The onion skining tool in Autodesk Maya [Oni].. In addition to superimposition, ancient Europeans used images’ juxtaposition to represent movement and add life to their paintings. In this process, positions taken up by the animal successively in a given time period are juxtaposed one after another and turned in the same direction. The most notable illustration of this Stone Age animation, is a drawing found in. © 2018 Tous droits réservés.. lilliad.univ-lille.fr.
(17) Thèse de Amira Chalbi Neffati, Université de Lille, 2018. Chapter 1. Introduction. 3. the La Vache Cave, showing a lion running from right to left (see Figure 1.7). This primitive principle has evolved over the years and is known nowadays as the freeze-frame technique.. Figure 1.7: A freeze-frame drawing representing a lion running from left to right discovered at the La Vache Cave [AR12].. Azéma and Rivère [AR12] suggested that Stone Age Europeans invented also a kind of optical animation toy. Archaeologists discovered in several sites in France and Spain stone and bone disks, typically with center holes, showing opposing images of sitting and standing animals. Rivère has reproduced these engraved disks and looped strands of animal tendon through the center holes. By twisting these strands, the disks rotate back and forth rapidly enough to make animals appear to be sitting down and standing up. Azéma and Rivère believe that the flickering images engraved on ancient discs represent “Palaeolithic thaumatropes”. A thaumatrope is an optical toy that was popular in the 19th century. It consists of a disk with a picture on each side that is attached to two pieces of string. When the strings are twirled quickly between the fingers the two pictures appear to blend into one due to the persistence of vision. The most common thaumatrope pictures include a bird on one side and a cage on the other, as well as a bouquet of flowers opposed to a vase (Figure 1.9). Azéma and Rivère considered that Palaeolithic thaumatropes “can be claimed as the earliest of the attempts to represent movement that culminated in the invention of the cinematic camera”.. Figure 1.8: A reconstruction of the The Laugerie-Basse spinning disk by Rivère shows a chamois in different positions on each side: standing on one side of the disc (left image), and lying on the other (right image) [AR12]. When the disk is twirled on a string, the creature appears to move (see animation in [Dis]).. © 2018 Tous droits réservés.. lilliad.univ-lille.fr.
(18) Thèse de Amira Chalbi Neffati, Université de Lille, 2018. 4. Chapter 1. Introduction. Figure 1.9: Top: a demonstration of a bird and cage thaumatrope [Thaa]. Bottom: Both sides of a bouquet and vase thaumatrope from 1825 [Thab].. Over the years, humans have continued to explore various techniques to depict motion ranging from simply manipulating hands and using minor mechanics in the shadow play [Sha] and magic lantern [Mag] to introducing more advanced methods boosted by the rise and spread of the Industrial Revolution in Europe and North America. Multiple techniques aimed at generating the illusion that images are moving have been invented, among which the Zoetrope used to show progressive phases of motion based on the principle of stereoscopy, as well as the preeminent Marey’s chronophotographic gun made by Étienne-Jules Marey in 1882 (Figure 1.10). This instrument was capable of taking 12 consecutive frames a second, with all the frames recorded on the same picture designated by “animated photograph”. Marey’s instrument was among the most pioneer works that contributed to the emergence of the cinematography field.. © 2018 Tous droits réservés.. lilliad.univ-lille.fr.
(19) Thèse de Amira Chalbi Neffati, Université de Lille, 2018. Chapter 1. Introduction. 5. b c. a. Figure 1.10: (a) Mechanism of the chronophotographic gun, (b) Marey used the gun to study the movement of birds, (c) an “animated photograph” recording 12 movement’s phases of a group of birds [Mara; Marb].. At the beginning of the 20th century, cartoon animation emerged and was produced as animated films in studios using mainly the technique of stop-motion photography applied to hand drawn images to create visual actions. The most notable cartoons of this early period include Fantasmagorie (1908), Gertie the dinosaur (1914), Felix the cat (1919) and Mickey Mouse (1928) that shaped the success of the Walt Disney studio. Walt Disney along with many other studios like Warner Brothers, MGM, and Fleischer have achieved the “Golden age” of American animation that has later been widely developed and expanded in both cinema and television during many decades [His]. Around the 1980s, traditional animation has evolved towards computer-generated animation thanks to the tremendous progress of computer-generated imagery. Hand drawing has been replaced by 3D modeling to generate 3D computer animation that got major inspiration from the Disney’s twelve basic principles of animation that were introduced by the Disney animators Ollie Johnston and Frank Thomas in their book The Illusion of Life: Disney Animation [JT81] and re-adapted by Lasseter [Las87] to be applied to 3D computer animation. Among these twelve principles we can cite, for example, the Slow In and Out effect (alternately named as Ease In and Out)–that dictates to slow down the speed of animation near its beginning and its end and accelerate it in between to help essentially with apprehension, and the Exaggeration effect–consisting mainly of applying extreme alterations on the physical features (e.g. movement, size, shape, color, etc.) of the the animated visual items to emphasize the essence of realism. 3D computer animation has been progressively expanded to other domains, beyond cartoon animation, to be adopted for example in the domain of computer simulation to replicate natural and physical phenomena [SKP08; MCG03], and in virtual reality applications to mimic realistic behaviors of Humans and physical components of a virtual scene [MTFCY06; KC02]. Researchers in Human-Computer Interaction have started very early to explore how animation can be used in interactive systems for the main purpose of improving the usability of the graphical user interfaces especially in terms of effectiveness and user satisfaction [Sta93]. In the context of graphical user interfaces, an animation consists of a sequence of images that, presented to the observer in a sufficiently fast pace, gives the illusion of motion. Animation usually involves a series of graphic transformations (e.g. movement, color change, resize, change of shape etc.) on a number of graphical objects across successive states of an interactive system evolving over time. The animated transition is a particular class of animation which consists of making the abrupt visual change between two successive states more fluid and continuous, usually by interpolating between these two states. Animation involves a set of parameters including the animation trajectory, start time, duration, and pacing. The trajectory defines how an animated visual component moves and the visual aspect that. © 2018 Tous droits réservés.. lilliad.univ-lille.fr.
(20) Thèse de Amira Chalbi Neffati, Université de Lille, 2018. 6. Chapter 1. Introduction. it takes in terms of shape, size, color and so forth, during the animation. Duration is the length of time that an animation takes from the start time, and is generally measured in seconds. The pacing determines how the interpolated values are distributed over the duration of animation–i.e. values spacing. The less intermediate values are spaced, the slower is the animation and vice versa. For example, linear pacing makes the intermediate values spread out evenly over the duration and generates a constant-speed animation. The same animation with a “SlowIn” (“EaseIn”) pacing would begin slowly, and speeds up as the time progresses. As I am writing these lines, animation represents an omnipresent component of user interfaces. It is used in all modern operating systems and platforms and can be seen on different devices ranging from mobile, desktop, tabletop to wall-sized displays. Animation is developed to enrich multiple software applications including games, websites, interactive applications, and information visualizations. Users frequently come across and manipulate multiple types of animation. They get for example an animated visual cue when turning on their phones to inform them how to unlock the screen, and a bouncing animated icon notifies them when receiving a new message. When using their computers, animated transitions allow them to smoothly navigate between windows, and they may use an animated tutorial to learn how to use an new application. Users also commonly use animation in their oral presentations to engage the audience or to better explain their ideas. The wide range of application domains in which animation can be used and the various purposes that it can achieve has certainly expanded its usefulness and multiplied its benefits for users. However, applying animation in various contexts of use (i.e. different domains of application, user profiles, devices, etc.) has in return raised many issues highlighting principally that animation can not always be effective and achieve the same purposes in the same way. This high disparity in the value of animation in user interfaces has consequently led to discrepant opinions between those endorsing the use of animation and those dissuading from using it. This controversy leads us to question: why, despite all the decades that researchers and practitioners have spent designing, studying and using animations, we still face all these contradictions about its value? What makes animation still challenging to design and evaluate? To answer these questions, let us put ourselves in an animation designer’s shoes and follow all the stages of creating an animation in a user interface. That would help us decipher what are the questions that an animation designer is facing to come up with an effective animation. When a designer thinks about using an animation in her graphical interface, she often starts by asking this main question: “Q1: Should I use or not use animation? and why?”. Although animation has been studied and used since many years, we do not have yet definitive or decisive answers to these questions and we still observe many controversies and contradictory results about the merits of animation. For example, while some previous works proved that animation can facilitate learning visualizations [Pla+12], it is considered in other studies as not effective for learning [Tve+07] and for transferring knowledge [HDS02] compared to other ways of teaching. It is also seen as not helpful for some types of visualizations such as process and algorithm visualization [TMB02a; HDS02], which is paradoxical to Stasko [SK96] and Beacker’s [BS90] findings of the possible benefits of using animation in these kinds of visualizations. However, these controversies can reasonably be justified when we take into consideration the difference in their particular contexts. As for any other interface’s usability feature, optimizing an animation to satisfy a subset of usability criteria for a given context of use does not imply that it will remain effective when considering different usability criteria or changing the context. Since our broad question (Q1) concerns the general possible benefits and drawbacks that animation can have in a user interface, we will be able to find only some partial elements of answers by compiling the findings issued from various studies dealing with animation. But, what if we try now to narrow the scope of our question and contextualize it better? In practice, an animation designer often works with animation in a particular context of use, that. © 2018 Tous droits réservés.. lilliad.univ-lille.fr.
(21) Thèse de Amira Chalbi Neffati, Université de Lille, 2018. Chapter 1. Introduction. 7. can be leveraged to inform the relevance of design and use of animation, and suggest many opportunities for applying it, as it can also impose certain constraints on that design and use. Both of these opportunities and constraints should be adjusted in accordance to the goal that an animation is intended to achieve within a given user interface. Hence, the second question that an animation designer should ask: “Q2: For what purpose can I use animation?”. Prior work in literature has attempted to answer this question by providing different views of animation roles in order to guide designers through a better understanding of the different goals for which animation could be used in user interfaces. Notably, Baecker and Small’s taxonomy of animation [BS90] shed light, twenty eight years ago, on the different roles that animation could play in user interfaces. To the best of our knowledge, Baecker and Small’s taxonomy remains the most recent general classification of the roles of animations in user interfaces. Providing such a structured overview of animation roles in user interfaces not only helps the designer deciding the most relevant purposes that animation can achieve in her particular context of use, but it can also enlarge her knowledge about the general goals that animation can achieve in graphical user interfaces as well as inspire alternative uses of animation for future needs. This thesis contributes a revision of Baecker and Small’s taxonomy of animation roles in light of 28 years of animation design and use. Once the designer sets the goal that animation is aimed to achieve, the next logical question that arises is: “Q3: How I can achieve my goal using animation?” Being successful in achieving the targeted goal using an animation depends essentially on the way how this animation is designed. Let us break down this process: to design an animation, the designer needs to i) understand the different animation parameters and ii) decide how to define them. Most of prior works in literature deal with animation as a whole where all parameters are defined in accordance to a specific context and a particular purpose. Only a few works focus on studying particular animation parameters, yet still evaluate such parameters in specific contexts of use and do not provide a holistic knowledge about their design. Examples include Dragicevic et al.’s [Dra+11] study of the pacing functions, or Du et al.’s [Du+15] study of position trajectories. Both works focus their study on the effectiveness of animation for visual tracking while other aspects such as the value of animation as a cognitive aid or for visual appeal are also important to consider. Hence, the animation parameters remain under-explored and still not deeply understood. Moreover, to decide how to set these parameters, the designer needs to refer back to a set of design guidelines and practices. Although we can find in literature many such guidelines, they are either overly general–making it not so trivial to transpose them when deciding one’s own animation parameters (e.g. what does the apprehension principle imply for animation trajectory?), –or inversely overly specific to a particular use case (e.g. animation duration in many research works is defined according to the characteristics of a particular interface and/or use). Furthermore, many of the general design guidelines are generated from empirical studies where animation is evaluated as a whole. That makes these guidelines questionable because we can not easily isolate the impact of each parameter and how much it contributes to the results of such evaluations. To overcome these limitations that challenge both the understanding and the definition of animation parameters, the designer needs first to understand more in depth animation parameters and get acquainted by design guidelines that cover the various animation’s goals she wants to fulfil and that are more adapted to the different animation parameters, ideally derived from empirical studies studying each of these parameters in isolation. Let us suppose that the designer designed the animation in such a way that it should effectively achieve the targeted goal. She needs now to answer the following question: “Q4: How can I assess that my goal has been achieved?”. There are different metrics that allow to measure the usefulness and effectiveness of animation. Animation is a complex visual composition and as such it has different facets and can be seen through different lenses. © 2018 Tous droits réservés.. lilliad.univ-lille.fr.
(22) Thèse de Amira Chalbi Neffati, Université de Lille, 2018. Chapter 1. Introduction. 8. and measured using different metrics. To assess the value of animation in a thorough and informative way, the designer needs to study it from different perspectives. However, the evaluation of animation in literature has been concentrated around a subset of evaluation metrics such as those related to multiple objects tracking. Consequently, many metrics remain still under-used. Examples include, for instance, the metrics allowing to measure the semantic value of animation and its impact on the understanding and interpretation of information, as well as those allowing to assess its aesthetic value. We argue that applying a limited range of evaluation metrics does not provide a sufficiently informative knowledge about the value of animation. The three animation aphorisms by Tversky illustrate very well our claim: “Seeing is not perceiving, Perceiving is not understanding, Showing in not explaining” [Tve+07].. 1.1. Thesis statement and goals. In this thesis, we argue that if we want to move forward towards better designed and more effective animation, we first need to step back in order to analyze, synthesize and structure the knowledge that prior research has provided about the merits and downsides of animation for user interfaces as well as its design and evaluation. We argue that if we do not proceed regularly to realize this work of revising and restructuring our understanding of animation, we will keep on creating isolated instances of animation and our vision of animation will remain narrowed by our exclusive contexts of application. Hence, we will pass over multiple lessons that can be learned from each others experience. We believe that the very noticeable lack in literature in such works of synthesis and reflection about animation represents one among the principal reasons of the multiple unresolved challenges of the design and evaluation of animation. In this perspective, this thesis aims at providing a structured understanding of the use, design and evaluation of animation. Such structured understanding would provide a formal and common ground that would facilitate carrying purposeful and constructive discussions in the future. It would also help spotting gaps in the current state of the art exploring animation and paves the path to relevant future research opportunities. After providing a structured overview of the general benefits and drawbacks of animation in user interfaces. We explored its design and evaluation methods in the context of a particular application domain, namely, information visualization. In this context, we studied more in depth the design and evaluation of particular animation parameters (i.e. trajectories and staging). Information visualization domain represents a rich use case that allows us to explore different facets of animation including the functional (e.g. usability), semantic (e.g. expressivity), and aesthetic facets. It also represents a relevant demonstration of the possible harmful impacts that a poorly designed animation can have on the readability, comprehensibility and interpretation of the animated content. Such destructive effects of animation can considerably reduce the value of animated visualizations, violate their meaning and impair the process of exploration and sense making. We do consider that using animation in the field of information visualization has to be studied with much more care and depth. In this perspective, among the multiple parameters of animation, we chose to focus our exploration on the trajectory and staging parameters because we believe that they incarnate a great potential in terms of the readability and expressivity of visualization that have not yet been explored and hence represent relevant research perspectives.. 1.2. Research contributions. This thesis makes the following contributions to the fields of Human-Computer Interaction and Information Visualization:. © 2018 Tous droits réservés.. lilliad.univ-lille.fr.
(23) Thèse de Amira Chalbi Neffati, Université de Lille, 2018. 1.2. Research contributions. 9. 1. A structured view of the animation goals in user interfaces through a taxonomy of 23 roles, organized in 5 categories, illustrated by examples borrowed from academic sources and our observations in the wild. This taxonomy additionally highlights both the positive and negative facets of each category of roles, and discusses the findings of a qualitative exploration that we conducted with people to investigate their use of animation and their perception of its positive and negative impacts as well as a series of validation surveys that we conducted with practitioners to validate our taxonomy. 2. A structured view of the drawbacks of animation that we constructed based on the findings of our qualitative exploration mentioned above. We suggested a classification of the drawbacks of animation perceived and experienced by the participants of our exploration using a set of factors characterizing both the design and use of animation in user interfaces. 3. A theoretical framework to help animation designers gain a deep understanding of dynamic information visualizations. We proposed a set of dimensions to characterize dynamic changes in visualizations that allow animation designer to answer the main following questions: what makes a visualization change? what are the precise components that are affected by a given dynamic change? and how these components change? 4. A discussion of animation fundamentals and challenges in the context of information visualization. We start by formalizing the basics of animation for dynamic visualizations. We then provide a structured view of the design and evaluation of animation where we discuss the limitations of the current state of the art exploring the animation parameters and providing design guidelines. We also suggest a list of metrics to measure the value of animation, discuss the general methods of animation evaluation and point out the different challenges that researchers encounter when assessing the effectiveness of animation and the limitations in some approaches they have adopted. 5. A crowdsourced graphical perception study of the meaning of Common Fate for animated transition in visualization. In this experiment, we asked participants to make perceptual judgements on a series of trials involving four graphical objects under the influence of conflicting static and dynamic visual factors used in conjunction. Our results yield the following rankings for visual grouping: motion > (luminance, size, dynamic size); dynamic size > (dynamic luminance, position); and dynamic luminance > size. We discuss the implications of our findings for the design of dynamic information visualizations. 6. A design space that allows a holistic characterization of staged animation across several visual states of a dynamic visualization. We surveyed and characterized literature and practice using our design space, thereby identifying the limitations of existing staging approaches and highlighting novel opportunities. To support the design of staged animation, we provided a paradigm for authoring staging alternatives based on varying the decomposition and timing parameters, and demonstrated our approach with a concrete scenario. We discussed the design considerations of an authoring tool for staged animation and described our prototype.. © 2018 Tous droits réservés.. lilliad.univ-lille.fr.
(24) Thèse de Amira Chalbi Neffati, Université de Lille, 2018. Chapter 2. Roles and drawbacks of animation in user interfaces. 10. Chapter 2 Roles and drawbacks of animation in user interfaces. Just as there are good and bad uses of color, so there are good and bad uses of animation. Inappropriately applied, animation will seem childish and drive users away. But sensibly applied, it can make an interface more graceful and enjoyable to use. — Thomas and Calder [TC01] In this chapter, we start by focusing on understanding the roles of animation and asking the following preliminary question: “Why and for what purposes animation has been used?” Answering this question will help us gain an overview of the contexts of application in which animation has been used and the goals it has been targeted to achieve. The literature and practical state of the art of animation include hundreds of works that have been realized across many decades. The very early uses of animation in graphical user interfaces involved using animation to animate the change of viewports during navigation [RMC91a] as well as to illustrate algorithms [BM86]. Since then, it has been widely expanded to include for instance directing attention of users to points of interest [MCS01], improving the understanding of dynamic processes [MA92] and time-varying systems [Sta93]. Hence, considering the great number of goals that animation has been used for, if we attempt to investigate our question without any structured guidance, our task proves to be not so trivial to accomplish. In this perspective, some prior research proposed different taxonomies to characterize the uses of animation in user interfaces in general, while others were interested in the use of animation in more specific contexts such as information visualization. “Animation at the Interface” by Baecker and Small [BS90] is the most pioneer taxonomy and was proposed twenty eight years ago. In this seminal paper, the authors went beyond the early use of animation to illustrate processes and algorithms, and exposed the fundamental idea that animation can help make interfaces more understandable. Their paper described a set of scenarios, mostly hypothetical at the time, illustrating that animation could help users track objects of interest, choose what to do and see how to do it, but also get feedback on what just happened, or see summaries of what happened in the past. Later works provided several elements to characterize animation in the user interfaces. Partial characterization of animation include for example the seven functions of animation suggested by Novick et al. [NRW11]: signal different context, signal different value, signal different status, signal importance or urgency, signal different function, signal referent (pointing), and signal salience. The Novick et al.’s taxonomy provides a set of relevant communicative functions of animation in user interfaces, but it does cover only a fraction of the rich spectrum of its possible functions. Other works focused on characterizing the functions and use of animation in more particular contexts of application including for instance the domain of computer based instructions for which Weiss et al. [WKM02] suggested five functions of animation: cosmetic function, attention gaining function, motivation function, presentation function and clarification function. The two latter functions were particularly explored in depth as ways for enriching the expressivity and readability of dynamic information visualizations. In this context, several works characterized the use of animation for information visualization. One among the most relevant examples is the work by Bartram [Bar97b] listing potential applications of motion in visualizations such as using motion to communicate data relationships or for representing change.. © 2018 Tous droits réservés.. lilliad.univ-lille.fr.
(25) Thèse de Amira Chalbi Neffati, Université de Lille, 2018. 2.1. The 23 roles of animation in visual interfaces. 11. Another example is the taxonomy by Heer and Robertson [HR07] presenting transition types between data graphics in the context of statistical visualizations. They identify seven transitions between data graphics based on operators such as view transformation, filtering or data schema change. Building upon this work, Fisher [Fis10] suggested a taxonomy describing the types of change that can occur in visualizations and distinguishes six types of transitions related to data and view transformations. Both taxonomies focus on a single specific role of animation, namely, support the transitioning between different views or states of a system. Both works list tasks and situations in which animated transitions may be appropriate, but do not explore the other roles animation can play in graphical user interfaces. Besides the taxonomy of transitions, Fisher [Fis10] discusses the context in which the animation are used in visualization, distinguishing between presentation (i.e. the data is well known to the presenter and the viewer is passive), and data exploration where the data is still unknown, but where the viewer has full control over the interactions. While he does not explicitly discuss roles of animation per se, Fisher still stresses that animation can be designed for different purposes (presentation vs. exploration). In summary, there have been many efforts towards classifying and describing how animation are used, especially in data visualization, but we do observe the lack of recent works surveying and providing reflections about the general uses of animation in user interfaces. In this chapter, we propose a taxonomy that builds upon several of the prior efforts and expands on them by providing several novel roles of animation for graphical user interfaces (GUIs) in general. We enrich our discussion of the animation roles as well as their benefits and drawbacks with findings from our preliminary qualitative exploration of animation as used and seen by people. This exploration allowed us to highlight to which extent people are aware of the various roles of animation, for what purposes they use it and for what reasons they refrain from using it, and how they perceive its value. For each category of roles, we highlight the most relevant caveats of roles and discuss research opportunities. Highlighting the caveats of animation roles reveals its negative facets that range from role-specific drawbacks to more general ones involving mainly temporal and cognitive complexity. We will discuss in the next chapter the drawbacks of animation based on the findings of our preliminary exploration.. 2.1. The 23 roles of animation in visual interfaces. In this chapter we revisit the roles of animation in graphical user interfaces, twenty eight years after Baecker and Small [BS90] seminar paper. We started by conducting a preliminary exploration through an online survey and a series of semi-structured interviews to investigate how people use animation and perceive its value. We then reviewed academic publications and commercial systems, and interviewed 20 professionals of various backgrounds. Our insights led to a taxonomy of 23 roles of animation that provides an expanded set of roles played by animation in interfaces today for keeping in context, teaching, improving user experience, data encoding and visual discourse. We illustrate each role with examples from practice and research and discuss most notable findings from our preliminary exploration and the practitioners’ interviews. This expanded description of roles aims at gaining a global understanding of roles that animation has been used to accomplish during the last decades and to exhibit the evolution and the expansion of these roles. We use the broad definition of animation by Betrancourt and Tversky [BT00]: “computer animation refers to any application which generates a series of frames, so that each frame appears as an alteration of the previous one, and where the sequence of frames is determined either by the designer or the user.” We chose this definition as it captures the essence of animation as a technique, while not specifying what the animation is supposed to convey or support. It also embeds both passive and active use.. © 2018 Tous droits réservés.. lilliad.univ-lille.fr.
(26) Thèse de Amira Chalbi Neffati, Université de Lille, 2018. 12. 2.1.1. Chapter 2. Roles and drawbacks of animation in user interfaces. Preliminary qualitative exploration. We based our preliminary qualitative exploration on an online survey and a series of semistructured interviews that aimed at investigating and understanding a) why and b) for what purposes people use or discard animation, c) how they use it and d) to which extent they are aware of both its beneficial and harmful aspects. We also asked participants about positive and negative impressions they kept about animation instances that they have seen as part of, for example, presentations, interactive visualizations, mobile apps, websites, and so forth. The online survey contained 14 questions (including 3 demographic questions) that were structured in three parts. The first part was dedicated for the demographic questions. In the second part, we focused on the use of animation in the context of oral presentations. We chose to focus on this particular use of animation because it arguably represents the most common use of animation for people who are not expert in designing animation and who are using it simply as a tool in their scholarly, academic or more generally professional presentations. We asked participants to give us their motivation and rationales behind using or discarding animation in their presentations and provide some examples of the types of animation they most often apply. The questions asked in this first part are as follows: – Do you use animation in your oral presentations? – If no, why? Do you have any particular reasons for not using or discarding animation? – If yes, why do you use animation? for what purposes? – Could you cite some types of animation that you often use (e.g. display text paragraph by. paragraph, enlarge image, etc.)?. In the third part of the survey, we wanted to explore the eventual positive and negative experience that participants had with animation instances that they have encountered in various contexts (e.g. oral presentations, web sites, mobile apps, etc.). We varied the questions in such a way that both the most known benefits and drawbacks of animation were covered. The questions asked in this second part are as follows: – Could you remember an animation that you saw somewhere (in an oral presentation, a web site, mobile app, etc.) that you liked? Could you describe it? – Could you remember an animation that you saw somewhere (in an oral presentation, a web site, mobile app, etc.) that helped you understand an information or an idea? Could you describe. it? – Could you remember an animation that you saw somewhere (in an oral presentation, a web site, mobile app, etc.) that made you have an emotional reaction? Could you describe it? – Could you remember an animation that you saw somewhere (in an oral presentation, a web site, mobile app, etc.) that convinced you about an idea? Could you describe it? – Could you remember an animation that you saw somewhere (in an oral presentation, a web site, mobile app, etc.) that caused you frustration? Could you describe it? – Could you remember an animation that you saw somewhere (in an oral presentation, a web site, mobile app, etc.) that confused you? Could you describe it? – Could you remember an animation that you saw somewhere (in an oral presentation, a web. site, mobile app, etc.) that misled you? Could you describe it? The two last parts of the survey allowed us to understand how people perceive and judge the value of animation both as designers and as end users.. © 2018 Tous droits réservés.. lilliad.univ-lille.fr.
(27) Thèse de Amira Chalbi Neffati, Université de Lille, 2018. 2.1. The 23 roles of animation in visual interfaces. 13. Our survey was created and hosted on GoogleForms [Gfo] and spread through social media and emails. Overall, 33 participants answered to our survey. 21 were female and 12 were male, and their age ranged from 20 to 35 years. Participants were students (19/33), software engineers (8/33), computer science teachers (3/33) and researchers in HCI and information visualization (2/33). When asked about whether they use or not animation in their oral presentations, most of the participants had a positive answer (78.8%, 26/33). The semi-structured interviews were comprised of two parts. In the first part, we asked participants about the different contexts of application in which they use animation. Most of them use animation especially in their oral presentations, whereas some others used animation also in interactive applications, information visualizations and websites. Questions were inspired from those of the second part of the online survey and were as follows: – Do you use animation? – If no, why? Do you have any particular reasons for not using or discarding animation? – If yes, in which particular contexts do you use animation? for what purposes? – Could you cite some types of animation that you often use?. In the second part, we were interested to explore how participants design their own animation in order to know if they founded their choices on design rationales and if they communicated certain meanings through these choices. We asked participants about the factors that they take into consideration when designing their animation (e.g. category of audience, type and content of animated information, duration of oral presentation, etc.) and how they set the different animation parameters such as duration, speed, temporal sequencing and so forth. When possible, participants presented to us examples of animations that they designed and explained the rationales behind the choice of each animation parameter. Overall, we interviewed 23 participants. 14 were male and 9 were female, and their age ranged from 26 to 42 years. Participants were students (11/23), software engineers (3/23), computer science teachers (3/23), administrative assistants (3/33), researchers in HCI and information visualization (2/23) and game designers (1/23). When asked about whether they use or not animation in their oral presentations, most of the participants had a positive answer (73.91%, 17/23). We will discuss the findings of our preliminary exploration in three steps: (i) In this chapter, we will start by presenting why and for what purposes our participants use animation, and the positive impressions that we found they have about it. These insights will be presented at the end of the description of each corresponding role as the answers provided by participants did not cover all the roles of our taxonomy. We will also analyze the coverage of our taxonomy’s roles in order to give some preliminary insights into the degree of popularity/recognition and usefulness of each role according to respondents. (ii) In this same chapter, we will discuss why our participants refrain from using animation and what are the negative impressions they have about it. (iii) Finally, we will discuss howour respondents design animation in the fifth chapter of this thesis 4.. 2.1.2. Taxonomy Methodology. Our methodology to identify the 23 roles of animation in interfaces, consisted of a multi-step process as follows: Review. We first searched for related taxonomies discussed in the introduction of this chapter. Then, we surveyed animation examples we were most familiar with as researchers in both. © 2018 Tous droits réservés.. lilliad.univ-lille.fr.
Figure
![Figure 1.7: A freeze-frame drawing representing a lion running from left to right discovered at the La Vache Cave [AR12].](https://thumb-eu.123doks.com/thumbv2/123doknet/3640981.107261/17.892.137.724.185.329/figure-freeze-frame-drawing-representing-running-discovered-vache.webp)

![Figure 2.2: Illustration of Role 2: Details of an animated transition between a PDF article and its corresponding LaTeX source code in Gliimpse [DHC11]](https://thumb-eu.123doks.com/thumbv2/123doknet/3640981.107261/31.892.129.755.144.223/figure-illustration-details-animated-transition-article-corresponding-gliimpse.webp)
+7
![Figure 2.8: Illustration of Role 8: An animation that illustrates how the bubble sorting algorithm works [Vis].](https://thumb-eu.123doks.com/thumbv2/123doknet/3640981.107261/37.892.252.612.492.720/figure-illustration-role-animation-illustrates-bubble-sorting-algorithm.webp)
![Figure 2.10: Illustration of Role 10: Soundhound [Sou] mobile app plays an animation of radiating bubbles of changing colors while listening to user’s voice input.](https://thumb-eu.123doks.com/thumbv2/123doknet/3640981.107261/39.892.185.671.577.807/figure-illustration-soundhound-animation-radiating-bubbles-changing-listening.webp)
![Figure 2.14: Illustration of Role 14: Ephemeral adaptation progressively reveals content in menus based on history–adapted from [Fin+09].](https://thumb-eu.123doks.com/thumbv2/123doknet/3640981.107261/42.892.357.567.677.866/figure-illustration-ephemeral-adaptation-progressively-reveals-content-history.webp)
![Figure 2.20: Illustration of Role 20: In Mobilistes [Sch+06], different categories of transportation means are animated in different manners](https://thumb-eu.123doks.com/thumbv2/123doknet/3640981.107261/46.892.160.767.838.992/figure-illustration-mobilistes-different-categories-transportation-animated-different.webp)

Documents relatifs
