HAL Id: sic_00601568
https://archivesic.ccsd.cnrs.fr/sic_00601568
Submitted on 19 Jun 2011
HAL is a multi-disciplinary open access
archive for the deposit and dissemination of
sci-entific research documents, whether they are
pub-lished or not. The documents may come from
teaching and research institutions in France or
abroad, or from public or private research centers.
L’archive ouverte pluridisciplinaire HAL, est
destinée au dépôt et à la diffusion de documents
scientifiques de niveau recherche, publiés ou non,
émanant des établissements d’enseignement et de
recherche français ou étrangers, des laboratoires
publics ou privés.
Assessing the Return on Investments in GL for
Institutional Repositories
Joachim Schöpfel, Chérifa Boukacem-Zeghmouri
To cite this version:
Joachim Schöpfel, Chérifa Boukacem-Zeghmouri. Assessing the Return on Investments in GL for
Institutional Repositories. Grey Literature in Library and Information Studies, De Gruyter Saur,
pp.1-20, 2010. �sic_00601568�
Chapter 14
Assessing the Return on Investments in GL
for Institutional Repositories
Joachim Schöpfel & Chérifa Boukacem-Zeghmouri
14.1 Good (and bad) reasons for assessment
A main feature of usage statistics is their benefits for an evaluation of return on investment, especially in the era of big deals between academic libraries, consortia and publishers. Libraries and funding organisations invest heavily and increasingly significant amounts of money in e-journals, e-books, databases and other online resources, and they need to know what they get in return – not (only) in terms of content, but in terms of value for end users.
The evaluation of value for money in the use of public spending is on the agenda of academic and research organisations. The new public research policy requires funding to be linked to performance and commitment of results. Library and information science (LIS) professionals have to justify their investment choices, and they need to show return on investment (ROI) to their resource allocators. In other terms, they must merge elements of cost analysis and usage assessment.
One explanation is that the importance of the role of the library as a gateway for locating and accessing information has fallen over time (Housewright et al. 2008). As Lauridsen (2009) observed recently, while library expenditures keep going up, growth in usage statistics slows down.
Nobody can reasonably expect academic libraries to generate net income. But this value gap (Tenopir, 2009) asks for monitoring. Any information service needs some kind of assessment so as to improve quality and performance and to optimize the impact of public spending. “Methods of cost-benefit analysis, such as ROI, are important tools in assisting one in making informed decisions (…) and to gain more credibility from various stakeholders” (Linn, 2009).
Academic libraries look back on a longstanding tradition of statistics and metrics, and international standards facilitate assessment and comparison (ISO, IFLA; see Heaney, 2009). In spite of this tradition, the rapid development of digital resources, open access and e-science appears to challenge the LIS professionals’ capacity of monitoring and assessment.
14.2 Grey business?
This chapter is about money. Not the money one can earn by providing information services. But the money public institutions spend on the acquisition, promotion, dissemination and preservation of scientific grey literature through open archives, in particular institutional repositories.
Introducing economics to grey literature may seem paradoxical because of the non-commercial character of grey literature. Compared to the academic journal market, there are only (very) few studies on business models and the value chain of grey literature (see Roosendaal in this book). Grey is often (mis)understood as free.
Of course, this is wrong. As wrong as the idea that most grey stuff one day will be published and disseminated through the usual (e.g. commercial) distribution channels. In fact, only a small part (probably not more than one third) crosses the border and becomes white – Ph.D. dissertations edited by book publishers, conference proceedings published in special issues, scientific reports edited in a serial collection. The other material never enters the information market.
One corollary of this situation is that the processing and preservation of grey scientific literature is mainly if not exclusively non-for profit business, managed by public information services on a local, national or international level.
The grey acquisition budget appears generally to be relatively low. Partly grey literature is collected without any direct expenditure, through legal deposit of research reports or submission of theses and dissertations. Yet, a grey collection bears at least indirect costs. Human resources are needed and have to be paid; other cost centres are the information system, storage facilities, records production and management, dissemination of copies, and so on.
Grey does not mean free. Correlated to the overall number of items, the acquisition of grey material may come out as more expensive than expected. Big deals with commercial publishers or database producers may be very expensive, but divided through the overall number of articles, issues or records, the item price often is rather low. On the other side, while a library may spend only a small part of its budget on grey literature, divided through the number of grey items, the individual acquisition and processing costs may be rather high.
This may seem a paradox. In fact, it highlights the value and relevance of grey literature. The important STI centres have a specific “grey footprint” as the different chapters of this book and our own studies clearly show (Boukacem-Zeghmouri et al., 2006; Schöpfel et al., 2009). They define a specific grey acquisition and collection policy, they invest in a specific way, and they offer specific services to their communities and customers.
But while some for-profit companies developed “grey” added value services such as alert products based on data mining of conference announcements and abstracts, public STI centres rather granted open (free) access to grey literature.
14.3 Grey content in institutional repositories
They did so for political and financial reasons. STI centres are part of scientific communities and endorse their decisions. Since 2002 (OAI Budapest Declaration), universities, research organisations and scientific communities opt for and invest into the creation of institutional repositories in order to facilitate and speed up the
direct scientific communication and to develop an alternative to the commercial scientific information market (“serials crisis”).
Following Jones (2007), an institutional repository is a safe place to store a critical mass of intellectual work in digital format, where the collection is linked to a specific organisation or community, together with (in particular) descriptive metadata and a method of finding it again. It fulfils two requirements: a method of disseminating outputs under the aegis of the organisation (outward facing), and a central location and focus for the collection of the outputs of the organisation.
For a STI centre or an academic library, the project of an institutional repository with facilities for deposit and metadata creation by the author may also on the longer term simplify and rationalize the preservation, processing and dissemination especially of grey documents.
Institutional repositories are a key element of the emerging landscape of open access to research and scholarship (Willinsky, 2006). Generally considered as the “green road” to open access (Harnad et al., 2008), the number of open archives referenced by the international directory OpenDOAR increased steadily since 2007 at an annual rate of around 30% and attains today more than 1,500 sites; more than 80% are institutional repositories hosted by universities or other scientific structures. Yet, these figures are underneath the reality, as surveys from Spain and France prove (Melero et al., 2009; Schöpfel et al., 2009). In France the number of open archives nearly tripled last year, growing from 56 in 2008 to 1501 in 2009.
The part of grey literature in these archives is extremely different, varying from 0 to 100%. Some figures:
All institutional repositories contain one or more types of grey material – often electronic theses and dissertations, but also unpublished working papers, courseware, conference proceedings or project reports.
Grey material accounts for 16% of the open archives’ content in France, for 21% in Spain. Nevertheless, the part of grey material is significantly higher in institutional repositories than in other categories:
Type of repository Part of grey literature
Institutional 41% Non-institutional 9%
All 16%
Table 1: Part of grey literature in French open archives (2009)
What is the relative part of the main types of grey literature? Most of the grey items in French institutional repositories are communications:
Type of documents Part in IR
Communications* 55% ETDs** 19% Reports 10% Working papers 3% Courseware 0,1%
Other 13%
Table 2: Part of grey document in French institutional repositories (2009) (*conference proceedings; **electronic theses and dissertations)
The problem with these figures is that they depend on the definition of grey literature and also, on the repositories’ metadata quality. Sometimes it is difficult to distinguish different document categories. Many repositories simply don’t define their categories and probably leave it to the authors (and visitors) to make the choice. Together with the often more or less poor search facilities in repositories, the lack of standards and shared understanding makes assessment and evaluation difficult.
14.4 Usage assessment
One way to cope with the need to assess the return on investment (ROI) is the collection and evaluation of usage statistics. Projects like COUNTER and SUSHI are designed to assist publishers, vendors and libraries in this task, through the precise definition of terms and concepts, through standardization of procedures, figures and presentations, and through labelling of products (Shepherd, 2005).
The real use of individual items, journal titles, articles and downloaded records, is a central argument in the negotiation on licensing (Bevan et al., 2005). COUNTER statistics enable library managers to empirically assess and shape investment decisions. Without proof of value, the library’s profile will weaken.
LIS professionals have to deal with the phenomenon of long-tailed statistics of digital libraries: some intensely used items, and a lot of stuff rarely or never used. And publishers have to explain why and how they sell content on the long tail.
Based on these statistics, new business models emerge that propose for instance a combination of subscription to core collections with a pay-per-view offer for the other items, or even open access to a part of them.
On the other hand, usage statistics provide an in-depth insight into the information seeking behaviour and routines of end users. The CIBER study on scholarly journal usage developed a methodology – deep log analysis – for the evaluation of session patterns and distinguished between different user groups, especially between repeat and occasional users (Nicholas et al. 2005). Among the analysed patterns are the type of items viewed (list of issues, table of content, abstract, full text HTML and PDF), the median item view time, the day of week, the subject category, the user’s geographical location, the place where the journal viewed was published, the number of items viewed in a session, the referrer link (search engine, library, publisher’s platform), access through authentication (Athens), attempts to purchase individual items online (pay-per-view).
The significance of these results is that they show what the end users really do. Together with a qualitative survey of the reason why they do so would enable publishers “to deliver more closely to the needs of the user/researcher, hence creating more traffic and more readership, and greater exposure for authors and brands” (Nicholas et al. 2005, p. 278).
But usage statistics provide more information. Like citations, lending and document supply (Salaün et al., 2000), usage statistics may be interpreted as a
marker of scientific value of the accessed content. The underlying idea is that “what is used has value”.
Unfortunately, little empirical evidence has been published so far on the usage of grey literature in open archives. In the early period of open access initiatives, technical and political aspects prevailed. It was more important, too, to find sustainable and interoperable solutions than to reflect on the real usefulness, e.g. return on investment.
We reported elsewhere on first results from different repositories (Schöpfel et al., 2009). The figures are consistent: the average download rate of grey items comes out to be higher than for journal articles and other published work. This would highlight the specific value of grey items and also, their valorisation through open repositories (see also Harnad et al., 2009).
Nevertheless, we should be careful with interpretation. Repository usage statistics are biased by search strategies, accessed content and referring tools. Traffic and readership are enhanced through web citations, and even if we didn’t find empirical evidence in published studies so far, usage statistics are probably linked to web based citations, in the way that more an item is cited, greater is the probability that it is used. Also we should keep in mind that compared to academic journals, we know much less about citation patterns and impact of theses, reports or working papers.
We already mentioned another problem – the poor quality of metadata and the lack of standards for usage statistics and grey literature in repositories. Actually, some projects in the UK, Germany, France and Japan tackle these problems. On the agenda: usage assessment on the item-level, a common terminology, a set of recommendations for repository usage statistics (code of practice), including suggestions for added value services (references PIRUS and DINI to be added).
14.5 Cost analysis
A short glimpse on the literature confirms Linn’s (2009) statement that “it is unfortunate that there are so few good examples of how librarians can use cost-benefit analysis”. Estimates of ROI call for budget figures. By capturing cost information for an institutional repository, it would be possible to determine the development cost for one item (full text deposit and/or metadata); over time, it would be possible to link these figures to usage data. But what has become a routine for other kind of digital libraries (Byrd et al., 2001; Boukacem et al., 2008) is still largely absent for institutional repositories.
"The costs of digital preservation in general are still difficult to calculate, and it is unclear as yet how much of the work will be funded. It is equally unclear how open-access in general will be funded. Establishing costing and funding models for digital preservation of open-access materials is therefore doubly difficult.” (Pinfield et al., 2003).
There is consensus on one point: “Someone has to pay the costs for (…) repositories” (Kennan et al., 2006). No doubt: the institution that produces and hosts a repository has to bear the costs itself.2 “Institutions have the resources and
2
This may not be a sustainable business model for all repositories. In January 2010, the Cornell University Library announced a new voluntary, collaborative subscription-like business model to engage institutions that benefit most from arXiv;
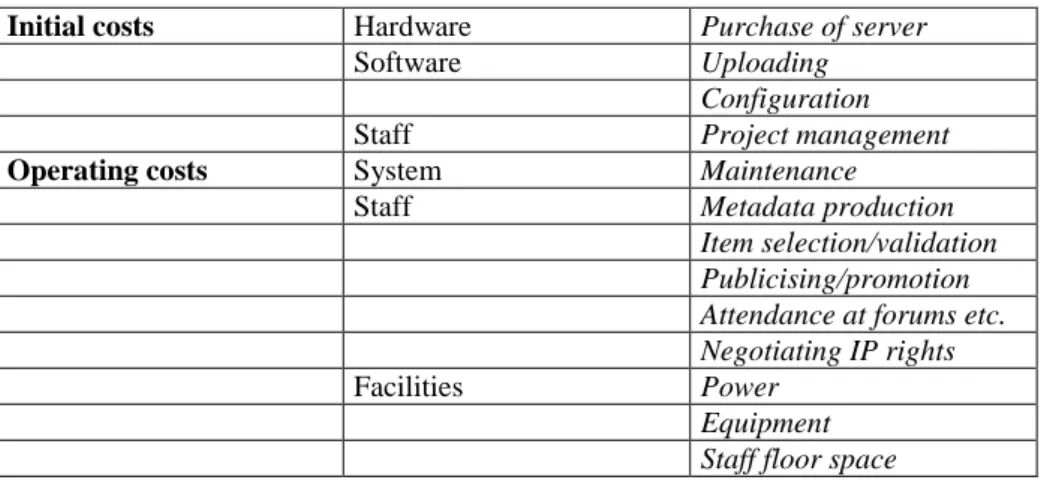
infrastructure to set up, support and fund repositories” (idem). But which are the cost elements related to repositories? A literature survey3 uncovers some main cost centers:
Initial costs Hardware Purchase of server
Software Uploading Configuration
Staff Project management
Operating costs System Maintenance
Staff Metadata production Item selection/validation Publicising/promotion Attendance at forums etc. Negotiating IP rights
Facilities Power Equipment Staff floor space
Table 3: Cost elements of an open repository
Repository software such as EPrints or DSpace are open source, designed for easy implementation - one day of work for someone experienced with setting up Web servers - so that the major initial cost probably will be the purchase of hardware (Horwood et al., 2004).
McDonald (2005) assessed the amount of $30,500 as startup first year costs for an institutional repository, with more than 60% for staff.
This is compliant with data from the University of London Computing Centre for another project on digital preservation where the staff accounted for 70% of total costs and the next greatest cost was maintenance for hardware and software associated with access (Granger et al., 2000).
Depending on the project, other tasks may include identifying metadata elements, obtaining and tracking permissions, scanning of documents and workflow coordination. Piorun et al. (2008) reported on the creation of an institutional repository with initially 320 theses. They estimated the processing costs for each item (digitizing, uploading) at around $70, with an average processing time of 170 minutes per item.
Willinsky (2006) stated that the annual funding of the best known e-print archive, arXiv.org, was $300,000 prior to its move to Cornell University in 2001, corresponding to costs of $9 per paper. The arXiv currently costs $400,000/year, with costs projected to reach $500,000 in 20124, corresponding to an annual increase
these institutions should support arXiv through annual contributions to the operating costs. http://arxiv.org/new/#jan2010
3
Granger et al. (2000), Horwood et al. (2004), McDonald (2005), Kennan et al. (2006), Piorun et al. (2008)
of 5-10% and an average cost per item of about $75. The French HAL archive was told to bear an annual budget of approx. €200,000. This would correspond to costs of €5 per item for the hosting structure.
It is generally admitted that publishing via an institutional repository is not very expensive, even if the deposit costs are added. With an average deposit time of 15 minutes per item this corresponds to costs of roughly €15 per deposit and metadata creation. Costs are low because of missing peer review procedures.
Nevertheless, even if some figures have been published, information about institutional repository costs is incomplete and a general framework for a cost analysis is (still) missing. In particular, it seems quite difficult to estimate costs in a distributed network of repositories.
14.6 Metrics
Derived from usage statistics, cost analysis and other data, at least six measures can be calculated that provide elements for the assessment of return on investment for institutional repositories (IR), especially in comparison with other repositories and digital libraries.
(1) IR costs per item: Which is the part of annual expenditures related to one
item? Corresponds to the “cost per article” metrics for serials. Examples following Willinsky (2006) and recent data (see above):
arXiv 2006 $9 arXiv 2009 $6 arXiv 2012 $8 HAL 2008 €5 Table 4: Open repository costs per item (examples)
The figures for open repositories seem higher than for (commercial) e-journals collections, probably because of the relatively low number of annual deposits in IR. But this indicator evolves over time, and with increasing input and controlled budget this cost indicator would decrease.
(2) Cost per item request: Which is the part of annual expenditures related to
one item request (in terms of access and download)? Corresponds to the “full-text article requests” metrics for serials. Example: in the case study published by Piorun et al. (2008) on an IR of digitized dissertations, the average cost per item request for the first year was around $1,90. This corresponds approximately to usage metrics for e-journals (see Boukacem et al., 2008). Improved referencing and promotion but also the effect of a critical mass (“long-tail effect”) will boost this measure.
(3) Item requests per collection: Which is the average access and download
number per item in a given collection? Corresponds to the “full text article requests per title” metrics; can be calculated for the whole IR but also for sub-collections or document types. Some examples for collections of document types:
5
See http://openaccess.eprints.org/index.php?/archives/702-Annual-Costs-Per-
Articles* 40 Articles** 8 Theses* 100 Theses** 70 Reports** 30 Table 5: Item requests per collection (examples)
(*Malotaux, 2009; ** Merceur, 2007).
The interest of this indicator is that it allows for comparison of usage of different document types (here grey literature vs. published articles), laboratories etc., according to the particular structure and metadata of an IR. It provides elements for the assessment of interest and usage of specific sections of the IR.
(4) IR costs per user: Which is the part of annual expenditures related to an
individual user? Links the overall expenditures to the number of users. This measure requires an analysis of the log files and would provide an additional element to the assessment of impact, popularity and readership. No valid data for the IR with cost information.
(5) IR costs per depositing author: Which is the part of annual expenditures
related to an individual depositing author? Links the overall expenditures to the number of users in terms of depositing authors. Requires an analysis of metadata and would provide information about the acceptance and use in the institution. No valid data.
(6) IR items per scientific output: Which is the part of the institution’s
publications that has been deposited in the IR? Provides an estimation of the part of a given institution’s scientific production available through its own institutional repository. Two examples:
Institution Output* IR % INSERM (France) 34,235 3,115 9 ETH Zurich 8,886 4,013 45 Table 6: IR items per scientific output (2003-2007)
(*source: SCImago Institutions Rankings 2009 World Report)
High rates were reported from institutions with a mandatory policy, like University of Southampton or ETH Zurich. Yet, accurate data on scientific production, especially of grey literature, are difficult to obtain, especially because of missing metadata. Also, mandatory policies may result in uploading of metadata without full text. –
The problem with all theses measures is that their quality depends largely on the availability and quality of metadata, usage statistics and cost elements. Actually, it seems much more difficult to obtain precise data on this part of the STI market than for (commercial) digital libraries. If we want to know more on the function and place of non-for profit (grey) literature in this new landscape, these data are badly needed.
Another point is that the cost-related metrics change with the development of IR and the depreciation, e.g. the reduction in the value of the initial investment in hard- and software. Even if these measures are defined for a given period (one year) they could also be calculated in a cumulative way.
Alternatives to this ROI assessment are impact measures derived from ranking (webometrics6) or link analysis. But these measures remains on the repository level and do not allow for deeper analysis of IR content, such as grey literature.
14.7 Concluding remarks
The question of ROI in institutional repositories renders grey literature more discernible in the global economic reasoning of scientific information. Concretely, associating the concept of ROI and institutional archives could lead to a new business model with grey literature gaining new legitimization.
The actual political framework of research – project funding – is related to the evaluation of institution, and incidentally, of institutional repositories which could become, through a mandatory policy of green or gold road, a kind of grey backup reservoir, an alternative to the big deal business model that seems to approach its limits.
One benefit of an evaluation approach covering institutional repositories would be to strengthen the academic library’s integration into the scientific project of the university and to replace the scientific information into the centre of the scientific policy. In this context, institutional archives and grey literature could become a central part of scientific evaluation.
The ongoing PEER project7, launched by STM publishers and co-funded by the European Union, may provide more evidence on economic impact and financial issues of open archives but the PEER research is limited to mostly English-speaking journals and doesn’t take into account other, unconventional material.
Grey literature is not a specific category of document but a specific (non commercial) way of access and dissemination of information. The definition of grey literature is an economic definition, nothing else. With the changing research environment and new channels of scientific communication, it becomes clear that grey literature needs a new conceptual framework. The ROI approach with its cost-benefit-analytical tools contributes to this new theory of grey literature.
Bibliography
S. Bevan, et al. (2005). `How usage statistics can inform national negotiations and strategies'. Serials: The Journal for the Serials Community 18(2):116-123.
C. Boukacem-Zeghmouri & J. Schöpfel (2006). `Document supply and open access: an international survey on grey literature'. Interlending & Document Supply
34(3):96-104.
C. Boukacem-Zeghmouri & J. Schöpfel (2008). `On the usage of e-journals in French universities'. Serials 21(2):121-126.
6
See http://repositories.webometrics.info/
S. Byrd, et al. (2001). `Cost/benefit analysis for digital library projects: the Virginia Historical Inventory Project (VHI)'. The Bottom Line: Managing Library
Finances 14(2):65-75.
S. Chapman (2004). `Counting the Costs of Digital Preservation: Is Repository Storage Affordable?'. Journal of Digital Information 4(2):208-214.
S. Granger, et al. (2000). `Cost Elements of Digital Preservation'.
S. Harnad, et al. (2008). `The Access/Impact Problem and the Green and Gold Roads to Open Access: An Update'. Serials Review 34(1):36-40.
S. Harnad, et al. (2009). `Open Access Repositories - maximizing and measuring research impact through university and research-funder open-access self-archiving mandates'. Wissenschaftsmanagement 4(4):36-41.
M. Heaney (ed.) (2009). Library statistics for the twenty -first century world :
proceedings of the conference held in Montréal on 18-19 August 2008 reporting on the Global Library Statistics Project. K.G. Saur.
L. Horwood, et al. (2004). `OAI compliant institutional repositories and the role of library staff'. Library Management 25(4/5):170-176.
R. Housewright & R. Schonfeld (2008). `Ithakas 2006 Studies of Key Stakeholders in the Digital Transformation in Higher Education'. Tech. rep.
C. Jones (2007). Institutional Repositories: Content and Culture in an Open
Access Environment. Chandos.
M. A. Kennan & C. Wilson (2006). `Institutional repositories: review and an information systems perspective'. Library Management 27(4/5):236-248.
H. Lauridsen (2009). `Are libraries dead?'. In Ressources électroniques
académiques: mesures et usages. Colloque international.
M. Linn (2009). `Cost-benefit analysis: a disparagement of its misuse and misexplanation'. The Bottom Line: Managing Library Finances 22(3):82-85.
R. H. McDonald (2003). `D-Scholarship @ FSU'. In The New Frontier of
Institutional Repositories Three Different Libraries, Three Different Plans, One Common Goal. CNI Fall 2003 Project Briefing Monday December 8, 2003.
S. Malotaux (2009). `OATAO Archive ouverte multi-établissements. Bilan après un an d'existence'. In Journées d'études sur les archives ouvertes. Consortium COUPERIN. 2 et 3 avril 2009.
R. Melero, et al. (2009). `The situation of open access institutional repositories in Spain: 2009 report'. Information Research 14(4).
F. Merceur (2007). `Gestion d'une archive et d'un moissonneur, l'exemple de l'IFREMER'. In RPIST 2007, 20 juin 2007.
S. Pinfield & H. James (2003). `The Digital Preservation of e-Prints'. D-Lib
Magazine 9(9).
M. Piorun & L. A. Palmer (2008). `Digitizing Dissertations for an Institutional Repository: A Process and Cost Analysis'. Journal of the Medical Library
Association : JMLA 96(3):223-229.
J.-M. Salaün, et al. (2000). `Demand for Scientific Articles and Citations: An Example from the Institut de l'information scientifique et technique (France)'.
Scientometrics 47(3):561-588.
J. Schöpfel, et al. (2009). `Usage of grey literature in open archives'. In GL11
Conference Proceedings. Eleventh International Conference on Grey Literature: The Grey Mosaic: Piecing It All Together. Washington D.C., 14-15 December 2009.
J. Schöpfel & H. Prost (2009). `Document supply of grey literature and open access: an update'. Interlending & Document Supply 37(4):181-191.
P. Shepherd (2005). `COUNTER 2005: a new code of practice and new applications of COUNTER usage statistics'. Learned Publishing 18(4):287-293.
C. Tenopir (2009). `The Value Gap'. Library Journal .
J. Willinsky (2005). The Access Principle: The Case for Open Access to Research