EVALUATI G THE CANADIAN REGIONAL CLIMATE
MODEL THROUGH PROCESS TE
DE
CIES AND
DATA
ASSIMILATIO
N
THESIS
PRESE
T
TED
AS P RTIAL REQ
IREME
T
FOR PHD
DEGREE I
T
EARTH A
D
ATMOSPHERIC SCIE CES
BY
KAMEL CHIKHAR
UNIVERSITÉ DU QUÉBEC À MONTRÉAL Service des bibliothèques
Avertissement
La diffusion de cette thèse se fait dans le respect des droits de son auteur, qui a signé le formulaire Autorisation de reproduire et de diffuser un travail de recherche de cycles supérieurs (SDU-522 - Rév.0?-2011 ). Cette autorisation stipule que «conformément
à
l'article 11 du Règlement no 8 des études de cycles supérieurs, [l'auteur] concède à l'Université du Québec à Montréal une licence non exclusive d'utilisation et de publication de la totalité ou d'une partie importante de [son] travail de recherche pour des fins pédagogiques et non commerciales. Plus précisément, [l'auteur] autorise l'Université du Québec à Montréalà reproduire
, diffuser, prêter, distribuer ou vendre des copies de [son] travail de recherche à des fins non commerciales sur quelque support que ce soit, y compris l'Internet. Cette licence et cette autorisation n'entraînent pas une renonciation de [la] part [de l'auteur] à [ses] droits moraux ni à [ses] droits de propriété intellectuelle. Sauf entente contraire, [l'auteur] conserve la liberté de diffuser et de commercialiser ou non ce travail dont [il] possède un exemplaire.»ÉVALUATIO
DU
MODÈLE
RÉGIONAL
CA ADIE
DU
CLIMAT
À
TRAVERS LES TE DANCES DES PROCESSUS ET
L'ASSIMILATIO DE DON
ÉES
THÈSE
PRÉSENTÉE
COMME EXIGE CE
PARTIELLE
DU DOCTORAT E
r SCIE CES
DE LA
TERRE ET
DE
L'AT !lOSPHÈRE
PAR
KAMEL
CHIKHAR
Je tien à remerci r . incèr ment mon dir ctem d th' e 1 Prof. Pi rr Gauthier, prof ss mau D'partement d s Sei nees de la Terre et de l'Atmosphère, pour avoir accept' d dirig r c tte r ch rche n continuation à notre précédente collaboration dans le cadre de ma maîtris . C tt r ch rch n'aurait jamais été possibl sans son entière implication à traver le support cientifique, ses précielL'< conseils, son exemplaire disponibilité t sa grand gén'rosité.
Je tien également à remercier le Dr. B rnard Dugas pour ses pr 'cieux et incontournables conseils concernant l'utilisation d s différents mod '1 s num'riques utili és. Mes remerciements vont également à iladame Katja Winger Monsieur Mich 1 Valin t la Dre Ping Du pour leur in timable assi tance technique. Je rem rcie 'gal ment 1 s profess ms t coll'gues du Départ ment des Sciences de la Terre et de l'Atmo phère de l'UQAM et duC ntr sur l''tude t la simulation du climat à l'échelle régionale (ESCER) qui ont contribué de près ou d loin à l'aboutissement de ce travail.
Ce proj ta ét' finauc' par le Ministère du D'v lopp m nt Économique, de l'Irmovation et d l'Exportation (MDEIE) du Qu'b c, Environnement Canada, le Con eil der cherch sen sei ne natur ll s t n g'ni du Canada (CRSNG), 1 Réseau canadi n pour 1 climat régional et les proc ssus météorologiques (en an-glais Canadian Network on Regional Climate and Weather Processes, C RCWP) ainsi que par des bourses d'études FARE de la Faculté des cienc s de l'UQAM. L s r ssomce n calcul d haute performance ont été fournies par le consortium régional Calcul Québec de Calcul Canada sur la plateforme Guillimin.
J t rmin rai en rem rciant n1on épou e Ounissa pour sa pati nee, son ou-ti n t ses ncourag ments.
Él 0 CÉ D'ORIGINALITÉ ET DE CONTRIE TION PERSONNELLE
Dans c tt 'tud , le modèle régional canadien du climat (MRCC5) a été évalué en utilisant d s outils généralement appliqué en prévision numérique du temps. La probl'matique d 1 équilibre initial ainsi que l'impact des conditions aux frontières a été traitée dan un cacb:e à la frontière entre la prévision numériqu du temp et la mod'lisation du climat.
Les aspects originaux présent dans cette étude sont :
- L'application de iagnostique de prévision num'rique du temps à un mod 'le régional de climat
- La réalisation d cycles d'assimilation de données avec un modèle à aire limitée, le MRCC, sur d s période de un à deux mois
- L'étude de l'impact des conditions latérales sous un nouv ll p rsp ctiv
Les résultats de l''tude visent à yalider le modèle régional canadi n du climat pour 'v ntuellem nt produire de réanalyses r'gional s. En s'appuyant sur le MRCC5 et le système d'analyse variationnelle d'Environnement CaJ.1ada, on bénéficie du travail considérable de validation de ces deux composantes.
Les résultats de c tte recherch ont 'gal ment permis de met tr en lumière le pot ntiel de nouv ll s approch s d validation du modèl régional canadien du climat p rmettant d mieux comprendre l'action de processus physiques et del s amélior r.
LI T OF FIGURES .. LIST OF ACRONYMS RÉS MÉ .. ABSTRACT I TRODUCTION CHAPTER I
CONTE TS
IMPACT OF ANALYSE 0 1 THE DYNAMICAL BALA !CE OF GLO-BAL AND LIMITED-AREA ATMOSPHERIC MODELS
1.1 Introduction . . . . vii X lU xv xvii 1 7 11 1.2 Diagnosing dynarnical balance based on average. of physical t ndencies 13
1.2.1 Total initial tendency . . . .. . . . .
1.3 Model, as imilation system and exp rim nt
1.3.1 The Global Environrnental Multiscale model .
1.3.2 The Canadian R gional Climat mod 1 . 1.3.3
1.3.4
Assimilation system
onfiguration of the xp rim nts
1.4 Impact of the assimilation method 1.5 U of xt mal analyse
1.6 Timc to clynarnical equilibriurn
1. 7 Ass ssing the balane of a regional climat rnod 1 1.8 Concluding rernarks
CHAPTER II
ON THE EFFECT OF BO DARY CO DITIO S 0 THE CA ADIA REGIONAL CLIMATE MODEL : SE OF PROCE TE
DEN-14 16 16 16 17 18 18 21 24 27 32 CIES 37 2.1 Introduction . . . . . . . . . . 40 - - -
-, - - - - -- -
-Vl
2.2 Model and xperiments description
2.2.1 .1ethodology .. .. 2.2.2 CRCM5 description . 2.2.3 Configuration of xp rim nts 42 42 44 45
2.3 Impact of the botmdary conditions on the temperature tendency . 46
2.3.1 Total tendency .. . . .. .
2.3.2 Contributions from th individual physical proc ss s 2.4 Specifie humidity . . . .
2.5 T ndenci s climatology . 2.6 Concluding remarks ..
CHAPTERIII
ASSESSMENT OF REGIONAL CLIMATE MODELS THROUGH DATA 46 . 50 53 58 61 ASSIMILATION 63 3.1 Introduction . . . . . . . . . . . . . . . . . . . . . . . . . . 66 3.2 The regional assimilation system d sign and experim ntal fram work 68
3.3 Evaluation of th regional assimilation system 69
3.3.1 The mean analysis increments . . .
3.3.2 Ob ervation d partures from background and analysis.
3.4 Assimilation using only radiosonde data . .
3.5 Use of initial systematic tend ney technique
3.6 Comparison to global analyses .
3.7 Overall verification . 3.8 Concluding r marks CONCLUSION REFERE CES 70 71 73 7 81 83 88 91 97
Figur
1.1 Zonal m an of (a) av raged temperatur increments (K) and (b) av rag d total phy ical tendency mtùtiplied by the tim tep x-pre sed on the right-hand ide of Eq. (1.2). Th v rtical coordinate
Page
is linear in pressure. . 15
1.2 Th CRCM ornain.
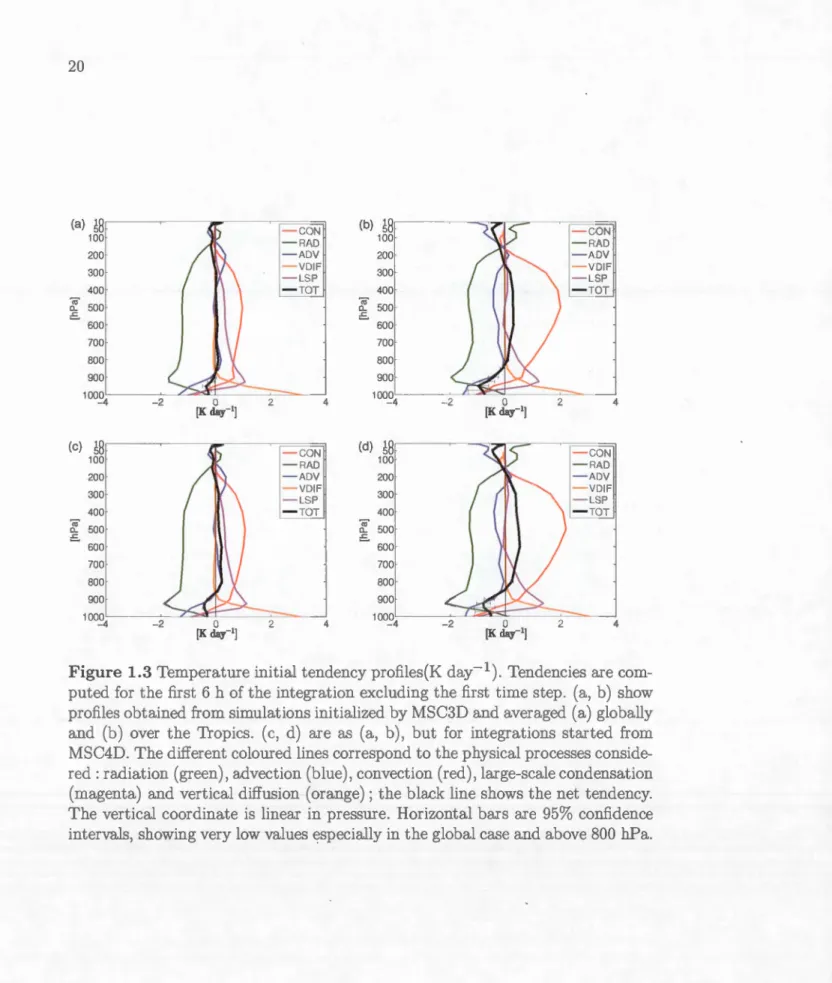
1.3 Temperatur initial t ndency profil s(K day-1). Tendenci are comput ·d for th first 6 h of the integration excluding the first tim step. (a, b) show profiles obtained from simulations initiali-zed by MSC3D and averaged (a) globally and (b) over th Tropic . (c, d) are as (a, b), but for integration tart d from MSC4D. The differ nt coloured lines correspond to the physical proc ss s con i-d red : radiation (green), advection (blue), convection (r d), large-scale condensation (magenta) and v rtical diffusion (orang ) ; the black line shows the net tendency. The v rtical coordinat i. linear in pressure. Horizontal bar ar 95% confidenc intervals, showing
17
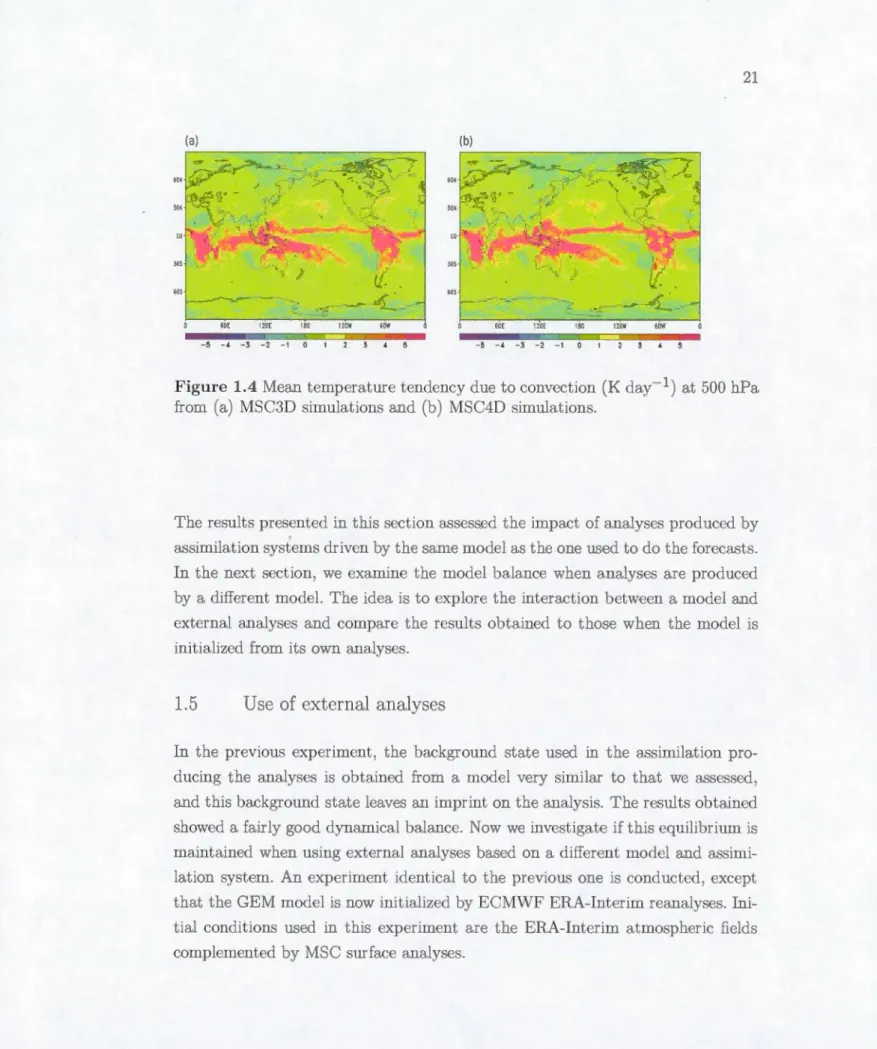
very low values esp cially in the global case and abov 800 hPa. . 20 1.4 1[ an temperat1.u-e tend ney due to convection (K day-1) at 500
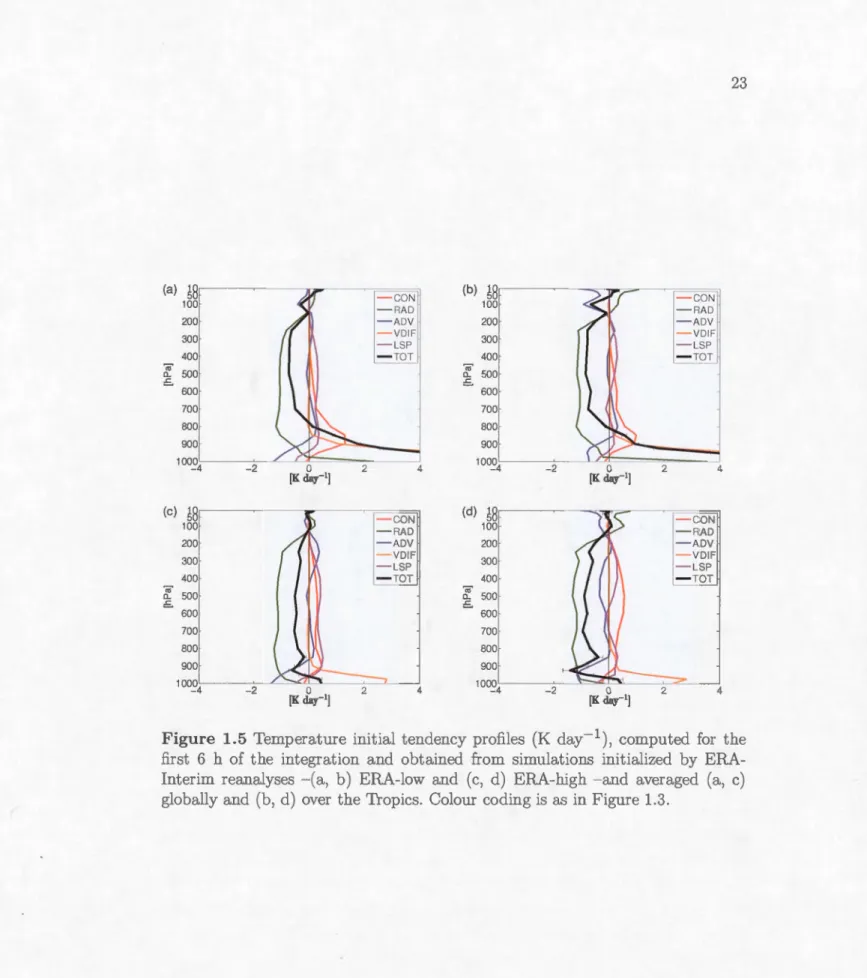
hPa from (a) MSC3D imulations and (b) MSC4D simulations. . . 21 1.5 11 mp rature initial tendency profiles (K day-1), computed for th
first 6 h of the integration and obtained from simulations initialized by ERA-Int ri.m r analys s -(a, b) ERA-low and (c, d) ERA-high -and averaged (a, c) globally and (b, d) over th Tropics. Colom· coding is as in Figure 1.3. . . . . . . . . ·. . . . . . . . 23 1.6 Temperatme initial t ndeucy profil (K day-1) computed for the
fir t 6 h of integration with th initial conditions d grad d (a) in horizontal resolution and (b) in v rtical r olution. More d tail are giv n in th t xt. . . . . . . . . . . . . . . . . . . . . . . . 24 1.7 Temporal evolution of th m an total t. ndency profiles (K day-1)
after (a) 1, (b) 5, (c) 10 and (d) 15 days for th global GEM mod l. imulations ar initialized with MSC4D. . . . . . . . . . . . . . . 25
Vlll
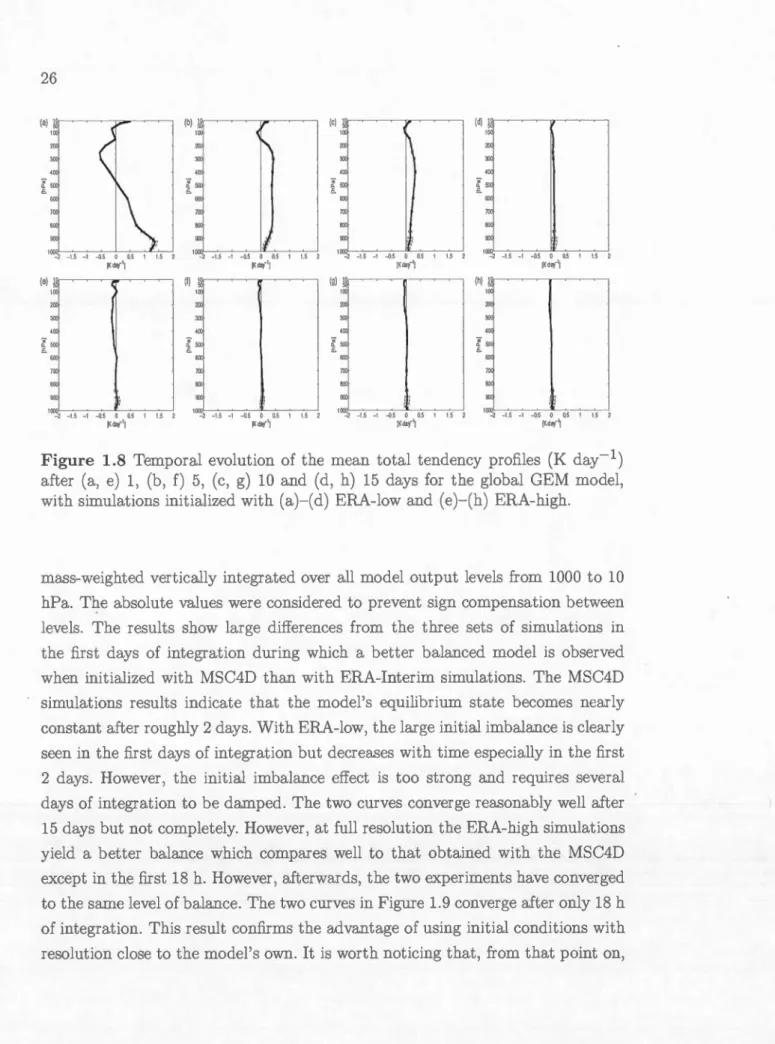
1.8 'D mporal evolution of the mean total tendency profiles (K day-1) after (a, e) 1, (b, f) 5, (c, g) 10 and (d, h) 15 days for th global GEM model, with imulations initialized with (a)-(d) ERA-low and (e)-(h) ERA-high. . . . . . . . . . . . . . . . . . . . . . 26
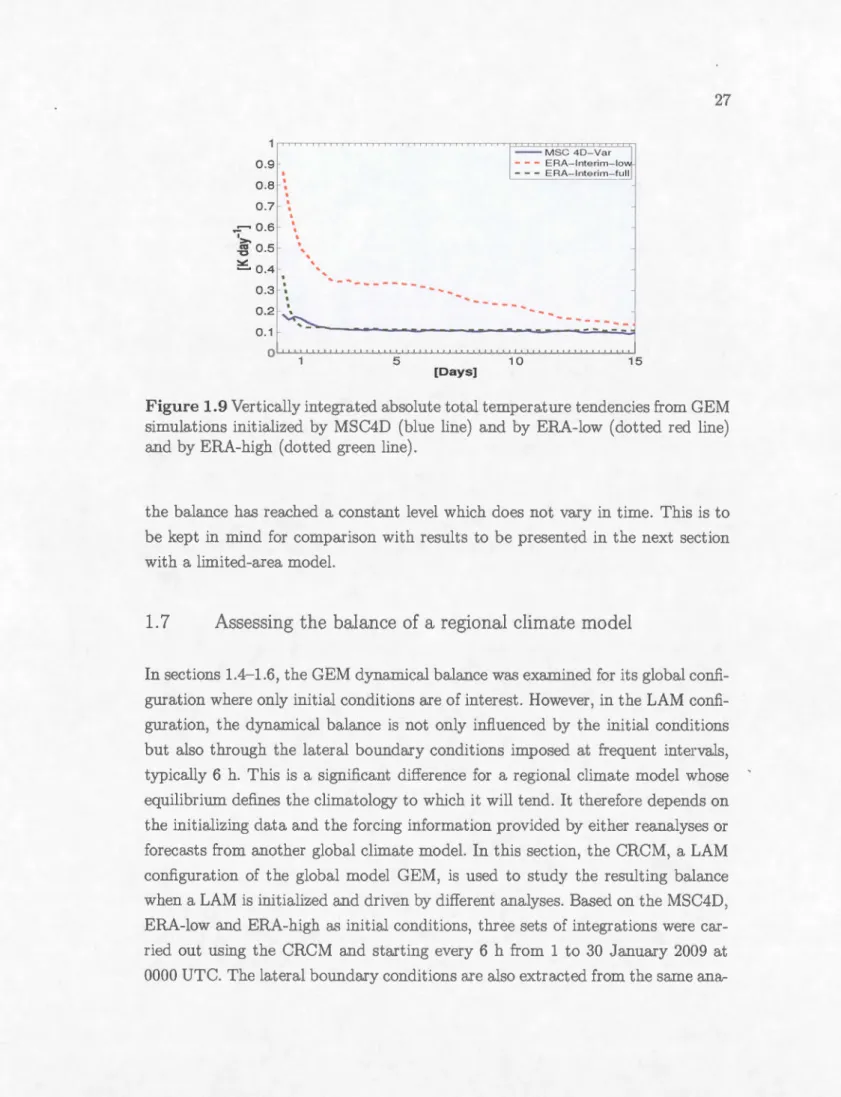
1.9 Vertically int grated absolute total temperature tendencies from GEM simulation initialized by MSC4D (blue lin ) and by ERA-low (dotted red line) and by ERA-high (dotted green line). . . . . 27
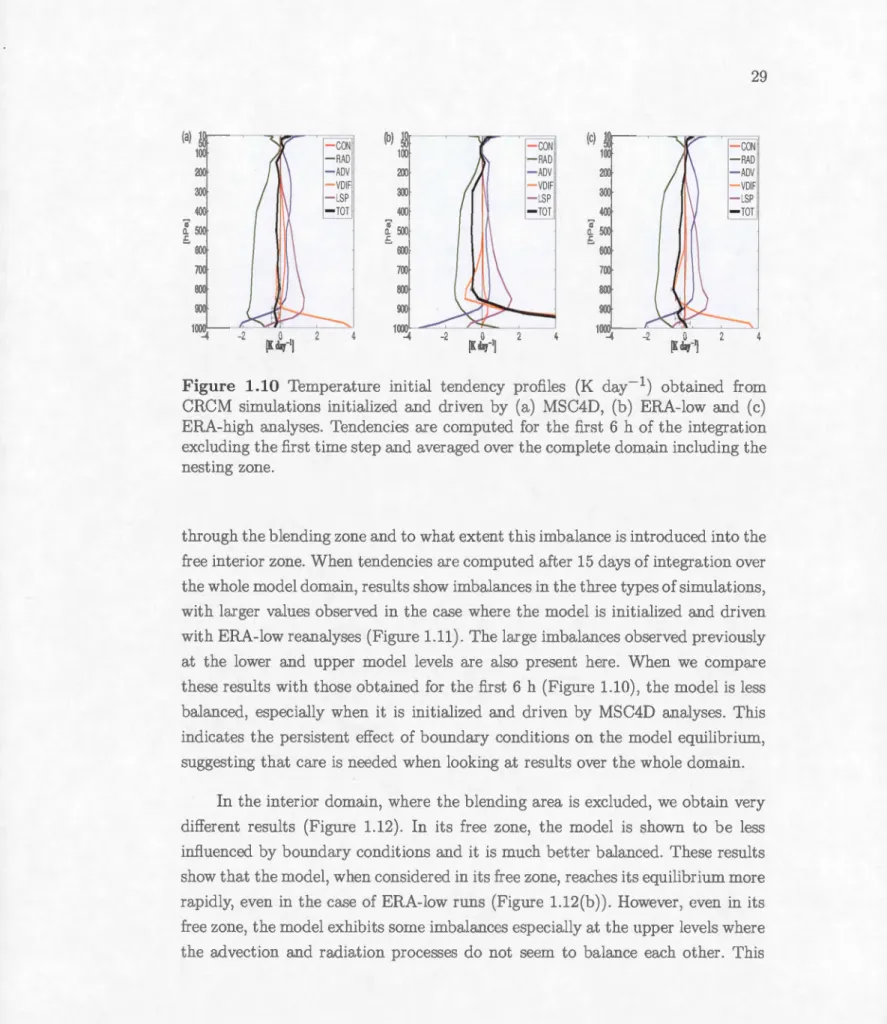
1.10 Tem1 erature initial tenclency profile.
(K
clay-1) obtainecl from CRCM imulations initializecl and clriven by (a) MSC4D, (b) ERA-low and (c) ERA-high analys s. Tenclencies are computed for the first 6 h of th integration exclucling th first time step and a ver ag cl over th complet domain inclucling the ne ting zone. . . 291.11 Temperature tend ney profil s computecl aft r 15 clay. int gration over the whole CRCM domain inclucling the blencling zone, from runs using initial and bounclary conditions from (a) MSC4D, (b) ERA-low and (c) ERA-high analy . . . . . . . . . . . . . . 30
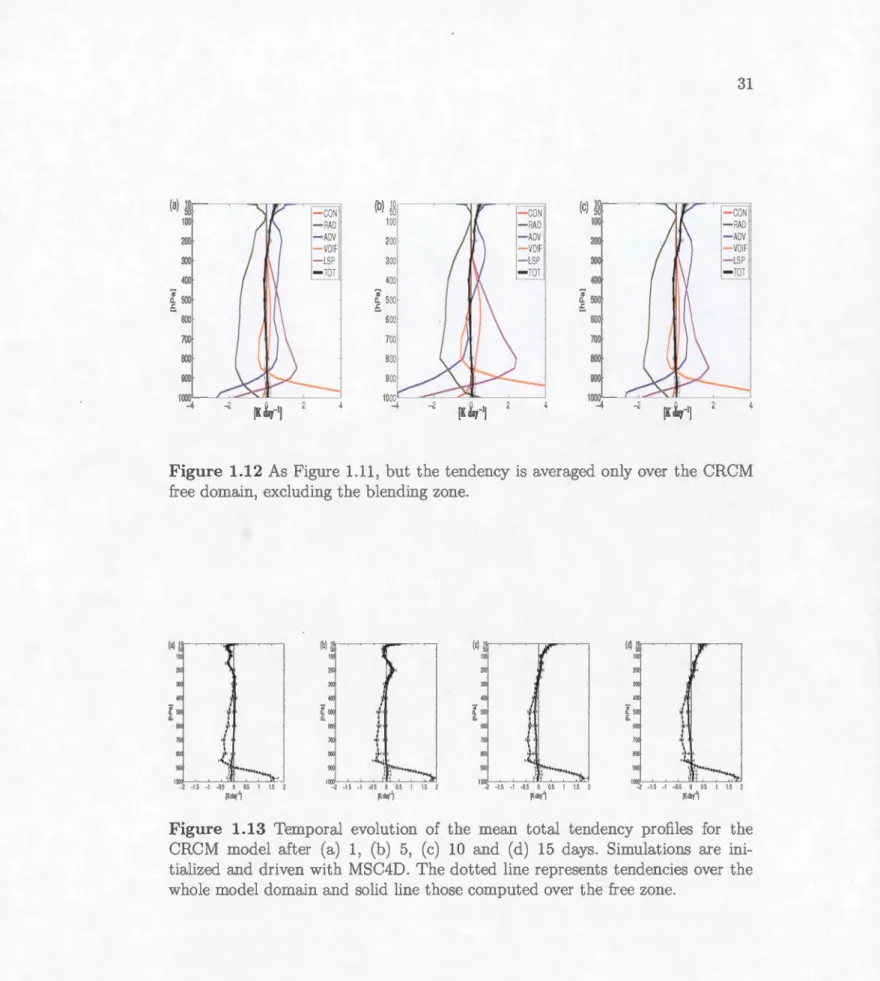
1.12 As Figur 1.11, but the tenclency is averagecl only over the CRCM free domain, excluding th bl ncling zone. . . . . . . . . 31
1.13 'D mporal volution of th rn an total tendency profile for the CRCM model after (a) 1, (b) 5, (c) 10 and (d) 1 clay . imu-lations are initializ cl and clriv n with MSC4D. The clottecl line r pr s nt tendenci s over th whol mod 1 domain and solid lin those computed ov r the fr e zone. . . . . . . . . . . . . . . . . . 31
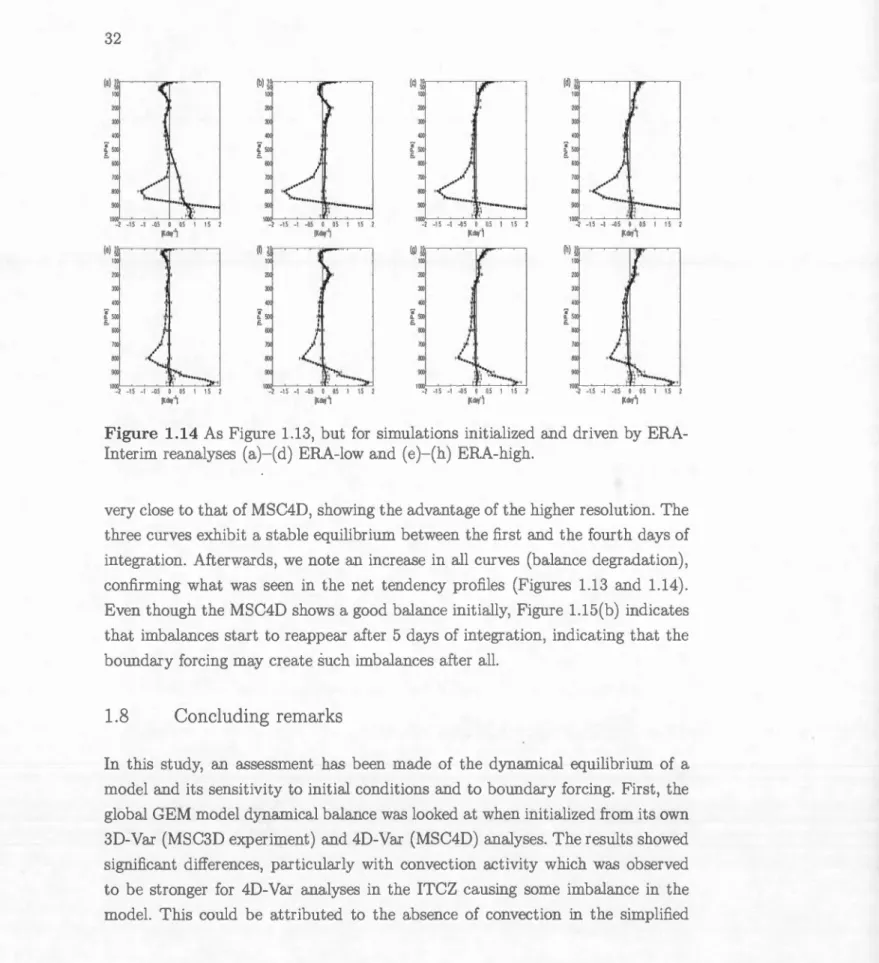
1.14 As Figur 1.13, but for simulations initializecl and driv n by ERA-Int rim r analyses (a)-(d) ERA-low and (e)-(h) ERA-high. . . 32
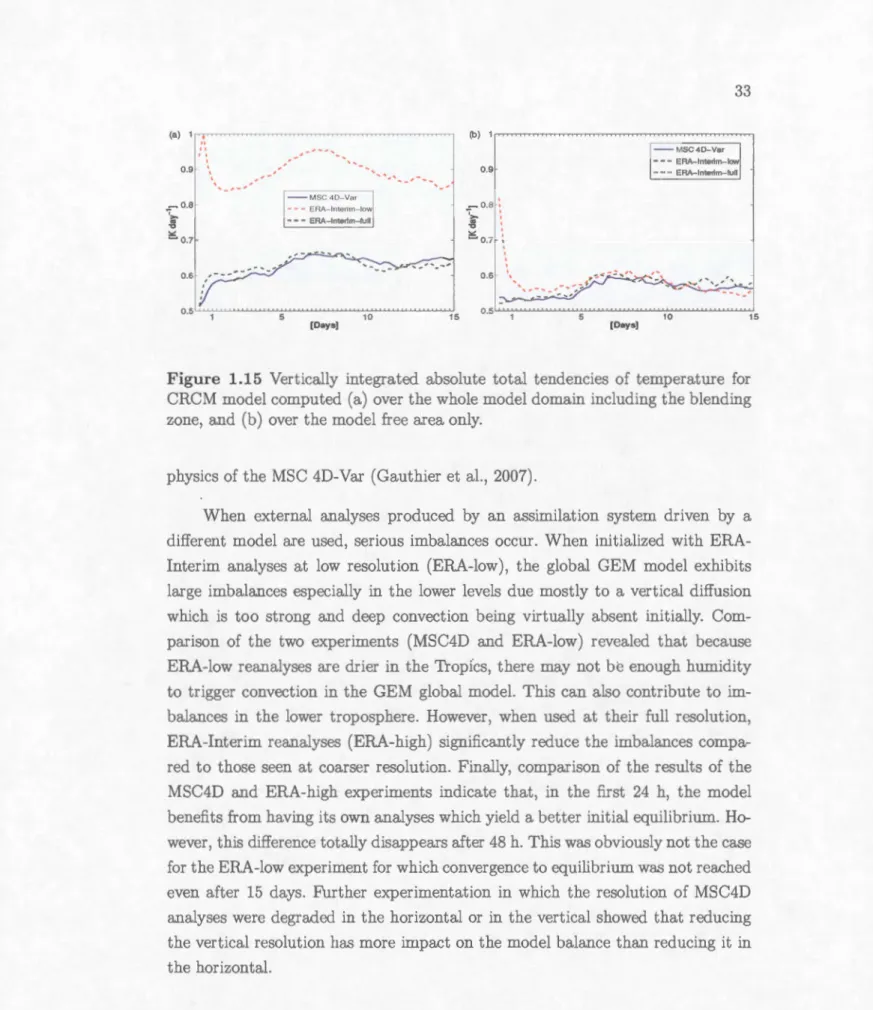
1.15 V rtically integrated absolute total tend n i s of t mperatur for CRCM mod 1 compute (a) over the whole mod 1 domain including the blending zon , and (b) ov r the model free area only. . . 33
2.1 CR.CM5 domain. Th inn r light dotted line delimits the model free
2.2 Total temperatm tendency profiles in K/day computed for each simulation. Total DJF tend ncies for CRCM-Can, CRCM-MP~ and CRCM-ERA are giv nin (a), (b) and (c) respectively. Th obs rv d (from r analyses) t ndency is hown in (d). Total tendency bia CRC 1-Can-TB and CRCM-MPI-TB ar pr ent d in (e) and (f) resp ctively whereas g indicates the structural bias CRCM-SB. Fi-nally, the lateral ffect biases CRCM-Can-BC and CRCM-MPI-BC are shown in h and i respectively. Vertical coordinate is linear in pressure . . . . . . . . . . . . . . . . . . . . . . . . . . . . 47
2.3 DJF temp rature total tend ney in K/day comput d over the CRCM domain for CanESM2 ( olid line) and MPI-ESM (thick dott d line). ERA-Interim temp rature total t ndency is plotted in thin dotted line . . . . . . . . . . . . . . . . . . . . . . . . . . . . . . . . . . . 49
2.4 Individual proc ss t mp ratur t nd ncies in Kjday comput d for ach simulation, CRCM-Can (a), CRCM-MPI (b) and CRCM-ERA (c). Lat ral botmdary effect bia: e Can-BC and CRCM-MPI-BC are shown in (d) an (e) respectively. Difference between CRCM-Can-BC and CRCM-MPI-BC is depicted in (f). Colored li nes repre ent radiation (green), vertical diffusion( brown), convec-tion (red), la.rge scale condensation (magenta) and dynamics (blue). The thick black line is the net tendency, i.e. the smn of all process tendencies. Note the change in x-au-xis scale in ( d-f) . . . . . . . . 50
2.5 Temperature tendency due to convection in K/day computed at lev 1500 hPafor CRCM-Can (a), CRCM-MPI (b) and CRCM-ERA (c). Diff r nee b tw en CRCM-MPI and CRCM-Can is d picted in (d) . . . . . . . . . . . . . . . . . . . . . . . 52
2.6 Difi'er nee in mean DJF sea surface temperature (in °K) b tw n that of the MPI-ESM and that of the CanESM2 av raged ov r the domain of the CRCM . . . . . . . . . . . . . . . . . . . . . . . . . 54
2.7 Temperature tend ncies biases in K/day computed at 200 hPa for CRCM-Can (a), CRC if-MPI (b) and CRCM-ERA (c). Lat ral boundary effect bia. cs CRCM-Can-BC an CRCM-MPI-BC ar
x
2. DJF mean temperature (0
C)
and geopotential h ight (gpm) at 200 hPa computed for CanESM (a), 1PI-ESM-LR (b) and ERA-Int ( c). Temperature is in shaded co lor-s while contours repr s nt g o-potential height. The latter, plotted every hundred meters is pre-ented as indicative of the rn an g n ral circulation . . . . . . . . 56 2.9 Temperatur tend nci s lateral biases in K/day computed for
dy-namics process at 200 hPa for CRCM-Can (a) and CRCM-MPI (b) . . . . . . . . . . . . . . . . . . . . . . . . . 56 2.10 Sam as Fig. 2.2 but for sp cific hmnidity 57
2.11 am as Fig.2.4 but for specifie humidity tendencies in g/Kg/day. Color coding is the same as in Fig. 2.4 . . . . . . . . . . . . . . . 59 2.12 ERA-Interim DJF tendency climatology for temperatme in K/day
(a) and sp ci fic hmnidity in gjkg/ day (b). Hor-izontal egment cl
-note 95% confidence interval . Shaded ar-ea repr s nts the tendency standard deviation around the mean . . . . . . . . . . . . . . . . 60
3.1 The domain used in the experimental r gional a similation yst m. Th inn r thin dotted lines indicate the free model zone limit whil th ar a betw n the two dotted lines r pr s nts th bl nding r -gion. Th r-d line indicates the grid equator. . . . . . . . . 70
3.2 Temp rature mean analysis increment in °C averag d over (a) Ja -nuary 2011 and (b) July 2011 for pr ssur l vels 100hPa, 250hPa, 500hPa and 850hPa from top to bottom r sp etivey. . . . . . . . . 72
3.3 otmcling stations used in the data monitoring indicated by blue filled circle . . . . . . . . . . . . . . . . . . . . . . . 73
3.4 Mean [0 - F] (blue lin ) and [0- A] (red line) for temperature soundings in th Iorth rn Canada indicated in 3.3 over the month of January (left) and July (right) 2011 at levels 100hPa, 250hPa, 500hPa, 700hPa and 50hPa resp ctively from top to bottom. See text for [ 0 - F] and [ 0 - A] cl finitions. . . . . . . . . . . . . . . 7 4 3.5 Mean analysis incr ment over th month of January 2011 at l v ls
100hPa (a) and 250hPa (b) from January 2011 as imilation cycl using only racliosond s observation . . . . . . . . . . . . . . . 75
1"
3.6 M an [0 - F] (blue line) and [0 - A] (red line) computed for temperature from the same soundings considered in Fig.3.4 at lev l 100hPa (a) an:l 250hPa (b) from January 2011 assimilation cycle
Xl
using only radiosondes observations. . . . . . . . . . . 76 3.7 Same as Fig.3.6 but for a similation cycle using only radiosondes
observations and QC-Var turned off. . . . . . . . . . 77 3.8 Mean temp rature initial syst matie t nd ney in K day-1
compu-ted for the month of January 2011 and averag d ov r th fr mo-del zone. Th cliff r nt colors indicat th cliff r nt proc sses in-volved, i.e. radiation (gre n), conv ction(red), large . cal conden-sation (mag nta), v rtical diffusion (brown) and dynarnics (blue). The black lin is the net t nd ney. . . . . . . . . . . 79 3.9 Mean temp rature initial syst matie t nd ney r lat d to dynamics
in K day-1 computed for the month of January 2011 at levels 100hPa (a) and 250hPa (b). . . . . . . . . . . . . . . . . . . . . . . . 79 3.10 Geopotential height 6-h for cast valid on January 22 at 18 :00 GMT
for l v ls 100hPa (a) and 250hPa (b). . . . . . . . . . . . . . . . . 80
3.11 Mean analysis increment computed for January 2011 global cycl over the regional model domain for levels 100hPa (a) and 250 hPa (b) . . . . . . . . . . . . . . . . 82
3.12 Same as Fig.3.6 but for the global cycle. . . . . . . . . . . . . 82 3.13 Mean initial tendencies in K day1 from the global mod l averaged
over the CRCM5 free zone. . . . . . . . . . . . . . 83
3.14 Mean analysi increm nt computed for January 2011 for level. 100hPa (a) and 250 hPa (b) from cycle where CRCM5 is driven by global analys s produced using the global cycl (s text for detail ). . . . . . . . . . . . . . . . . . . . . . . . . . 84
3.15 Bia: (top) and RMS (bot tom) for the backgrotmd 2-m temperatures for January 2011 (left) 3Jld July 2011 (right). . . . . . . 85
3.16 Bias (top) and RM (bottom) for analysis temperature fits tora-diosondes observations for January 2011 (l ft) and July 2011 (right). 86
3.17 Bias (top) and RMS (bot tom) for first-gu ss temp rature fits to radiosond s observation for January 2011 (left) and July 2011 (right). 87
3D-Var Thr e-dim nsional variational data assimilation
3D-Var FGAT Three-dim nsional variational data
as
imilation with first gu ssat appropriate timc 4D-Var 4DEnvar CanESM2 CGCM CLAS CO RD EX CRCM5 ECMWF EnV ar ERA-Int rim ESC ER GEM GEMCLIM GEM-LAM IFS ITCZ
Four-dim nsional variational data a similation
Four-dim nsional ensemble-variational data assimilation
Sccond-gen ration anadian Earth System Model
Coupl cl Global Climat Model
Canadia.n Land Smfac Schem
COordinated R gional Climate Downscaling EXpcrim nt
Fifth-g n ration Canadian R gional Climate Mod l
European Ceutr for Medium-Range \tVeather Foreca ts
Ensemble-Variational data assimilation
Emopean C ntr for M dium- Rang Weather Forecasts
reanalyses data
Étud t Simulation du Climat À l Éch lle R'gional
Global Environmental Multi cal
CRCM5 global version used in ESCER c ntre
Global Environmental Multiscale Limited Arca Moclel
Integratecl Forecast ystem
XlV
LAM ME RRA
Limited Area Madel
Mod rn-Era Retrospective Analysis for Research and
Applications
MPI-ESM-LR Ma.'C Planck In titute for M
t
orology's Earth Sy tem Madel(Low Resolution) MSC MSC30 MSC4D ARR NCEP NWP QC-Var RCM SST
Meteorological S rvice of Canada
MSC analyses obtained by using 3D-Var data as. imilation system
MSC analyses obtained by using 40-Var data assimilation
system
orth American Regional Reanalysi
National C nt ers for Environmental Prediction umerical W ath r Prediction
Variational quality control R gional Climate Madel Sea Surface Temperature
L'objectif d cett thèse 'tait d'utiliser une nouvelle approche basée sm celle propos'e par Rodwell and Palmer (2007) (désignée dorénavant par RP07) p01.u valider le Modèle Régional Canadien du Climat (MRCC5). Cette appproche uti-lise le tendances tempor lle initiale des proces u phy iques du mod 'l pom évaluer l'équilibre dynamique r' ultant de l'utilisation de différent s conditions initiale fournies soit par des r'analyses ou de simulations globale du climat. Ceci apporte d s informations détaill' es sur les interactions entre c s différents processus t compl 't l s outils clas ique de validation des modèles régionaux de climat. Pour un rnodèl de climat global l'impact des conditions initiales s' s-tomp n cours d'intégTation t n'a donc pas d'influence directe ur une simulation climatique. Par contre, un modèle régional d climat est constamm nt forcé à se frontières soit par des réanaly es globale ou le résultat d une . imulation globale du climat produite à l'aide d'un modèle ayant de caractéri tiques différentes. Cette thè e propo e d'étudier en premier lieu la sensibilité d'un modèle régional du climat aux conditions initiales et aux frontières telle qu'évalu' epar le diagnos-tiques sur les tendance. initiales. Le MRCC5 (CRCM5 en anglais) est une version à aire limitée du modèle global GEM (Global Environmental Multi-échelle) d' En-vironnement Canada. Les tendances initiales ont d'abord 'té calculée pour la configuration global de ce modèle pour un ensemble de comte intégrations dé
-marr'es d'analys sis u s d'un système d'assimilation utilisant le même modèl pom produir d analyses 3D-Var et 4D-Var d'Environnement Canada (EC). Le mod '1 st gén'ral m nt bi n équilibré mais une dégradation est notée au ni-veau de la zon de convergence inter-tropicale (ZCIT) pom le 4D-Var. Lorsqu le modèle démarre d'une analy e produite par tm autre rnodèl , dans notr cas le r'analyse ERA-Int rim du C ntr Emop'en de pr'vision m't'orologique à moyen terme (CEPMMT, ECMWF en anglais) à basse et haute résolution, m1e quasi-absence de la conv ction st notée dans le premiers instants de l'intégration lorsque 1 s r'analys s à bas r' olution sont utilisées. L'équilibre est meillem avec 1 s r 'anal ys s à haut r' olution. Il est égal rn nt noté qu\me d'gradation d la résolu ti on v rtical est plus dommageabl que celle de la r '. olution horizontal . Pour le MRCC5, les conditions aux frontières utilisées pom le pilotage ont ét', d'un partd sanalys s4D-Vard'EC td'autr partd sr'analysesERA-Interimà bass t haut résolution. L s diagno tics des t ndances montrent un déséquilibre p rsistant au-d là d 15 joms dans le cas des r 'analy es à faible résolution. Dan 1
XVI
cas des réanalyses ERA-interim à haute résolution tl s analys 4D-Va.r d'
Envi-ronn ment Canada., 1 modèle affiche un bon équilibr initial mais une légra.dation
commence à apparaître apr's 5 jours environ en s propageant 2::raduell m nt v rs
l'intérieur du domaine. Dans la. d lL'<ième partie, l' ffet du pilotag sur l MRCC5
est éva.lu' par sa r'ponse à différents types de conditions aux frontières produites
par le modèle Canadien du climat (CanESM2), le modèl de l'Institut Max-Planck
(MPI-ESM) ainsi qu 1 s r' analyses ERA-interim. Les diagnostics des tenda.nc s
montrent un récha.uff m nt xc ssif du modèle dans les basses couches et un r
-froidi ment plus haut et c ci pour 1 s différentes doun' d pilotag . Évalué s
t moyennée sur un saison, l s tendance d t mpérature ont révélé un r fr
oi-dissement dans les basses couches lorsque le mod 'l st pilot' par CanESM2 et
un récha.uff ment lor qu'il est fore' par MPI-ESM. Les tendances d l'humidité
spécifique montrent égal ment des frets différents selon 1 typ de donn' s de
pi-lotage. Dans RP07, les t ndances initiale sont obtenu dans 1 cadre d'un cycl
d'as imila.tion de donné s dans lequell modèl 'valué est c lui utilisé pour fair
l'as. imilation. La. troisième parti de cette thèse pr'sent l'évaluation d'un syst 'me
régional d'as imilation de données basé sur le MRCC5 sur la région d l'Amérique
du Nord. Le système d'as imila.tion va.ria.tionn 1 d'Environn m nt Canada a ét'
adapté pour produire des ana.lys s aux 6-h pour les mois de Janvier et Juillet
2011. Bi n que cell s-ei concordent as z bi n avec celles d'autr sources, l s
in-cr'ment. d'analy e moyens, les écart aux ob rva.tions moyens (monitoring) et les
tendances initiale ont révélé de anomalies pr's de la. fronti 're nord du MRCC5
indiquant un problème avec le couplage aux frontière en présence de rapide va
-riations dans la circulation transversale. La po sibilité de faire de l'assimilation
avec le MRCC5 ouvre la. possibilité d'étudier différ ntes approches permettant 'aborder cette qu stion et l diagnostic ur l tendance constituent un atout
important pour élucider cette qu stion.
Mots clés : Assimilation de donnée , équilibre dynamique, modéli ation régionale
The objectiv of this the is is th as ssm nt of th fifth g n ration Canadian
Regional Climate Model (CRCM5) using a new approach based on that
propo-sed by Ro well and Palm r (2007) (RP07, h reafter). In this approach, initial
tendencies of resolved phy ical Emd dynamical proces s ar used to evaluat th
dynamical balane when th model i initialized and driven 1 y reanalyses of
dif-ferent sourc sor output from global climate imulations. This technique provid s
detail d information on int raction b tw n thes diff r nt proc sses and
comple-m nts classical tools us d in r gional climat mod ls validation. For global climate
models, th impact of th initial condition fades away progr s iv ly dming the
integration aJ.ld consequently has no ffect on th climat simulation. In the case
of regional climate models, they aJ.·c constantly fore d at th ir lat ral botmdaries
by global reaJ.lalyses or outputs from global climate models with diff rent
chaJ·ac-teristic . This thesis aims to first xarnine sensitivity of regional clirnate mod 1
to initial and boundary condition using the initial tendencies diagnostic.
Th madel us d h r is the fifth-gen ration Canadian Regional Climate Madel (CRCM5), a limited-area v rsion of the global madel GEM (Global Environm
n-tal Multiscal ) of Environment Canada. Th initial tend ncies me first comput d
for the global G EM mod 1 configmation by p rforming an nsemble of short
inte-grations ini tialized by a11alys . from an assimilation system using th . aJ.n madel
producing 3D-VaJ.· and 4D-VaJ· analys of Environrnent Ca11ada. R sults show that the mod 1 is fairly well balanced with a slight degradation in the case of
4D-Var analy es in the inter-tropical convergence zone (ITCZ). When the madel
i initializ d by analyses based on a different madel, in this case low and high
resolution ERA-Interim reanalyses from th Emopean Center for Medium-range
W ath r Forecasts (ECMWF), the re. ults show a quasi-absent convection in th
first steps of the integration when low resolution reanalyses a1· used. Th r ason
could be a lack in humidity in low r 1 v ls prev nting the triggering of convection.
It is also not d that d grading th v rtical r solution is mor da111aging than using
a coa1·s r horizontal r solution.
CRCM5 simulations have b en conducted using driving data from 4D-Va1· analyses
and ERA-Interirn reanalys s at low and high resolution and th r sults showed p rsisting imbalances ven after 15 day for th coms r reanaly e . When con
xviii
Hovv ver, after 5 day of integration imbalances r app ar d gradually, propagating
into the interior of the model domain.
Th second part looked at the eff ct of different driving data on the regional cli-mat response by prospecting proc ss tendenci s. For this, the CRCM5 i as s d
when driven by different boundary conditions. The latt r are supplied by outputs
from th s cond generation Canadian Earth Syst m Mod l (CanESM2) and th
Mau'< Planck Institut for 1 t orology's Earth System fod 1 (MPI-ESM-LR) and
also from ECMWF ERA-Int rim reanalyses. Process tendencies diagnostics show
a model excessive heating in low r l v ls and a cooling at higher levels for all
differ nt driving data. 'Ii mp ratur tendencies valuated and averaged over a
sea-son r vealed a cooling in lower l vel when the model is driv n by CanESM2 and
a heating when driven by MPI-ESM2. R sults from sp cific humidity tendenci s
also showed various impact d pending on the driving data used.
In th third part, r sults from r gional data assimilation xp rim nts using the
CRCM5 over 1 orth America are pr s nt d. Thi y tem is adapted from the varia-tional data a: similation syst m of Environment Canada to produce 6-h analyses
for January and July 2011. Th se analy e are close to tho. obtained with other syst ms (e.g., ERA-Interim, MSC analyses). However, the mean analysis
incre-ments, mean departure from obs rvation (monitoring) and initial tendencies
revealed anomalies near th model orth rn oundary due to problems in the
driving procedure in the pre ne of rapid variation in transversal circulation. A
regional data as imilation based on th CRCM5 makes it possibl to evaluat dif-f rent approaches to study this issue and, a propos d in RP07, initial tendencies diagnostic will b very u eful for thi .
Key Words : Data as imilation, dynamical balance, regional climate modeling,
Cont xt
Climat simulation. ar obtain .d by using v ry complex climat model which talee into account s v ral physical proc ss . to r pres nt in the best po sible way the evolution of the climate. The compl xity of such coupl d models is associated with its various compouents (e.g., atmo ph r , oc an, biosphere, cryo phere, tc.) which leads to incr asing somc s of une rtainty in climate imulations. On of the main source of une rtainty ar mod l rrors p cially their deficiencies in the treatment of physical processes. Thi. is mainly du to their coar r . olution but also to lack of cientific understanding of these phy ical proc sse and how th y interact with one another. Sorne tudi s tr ated the uncertainty related to mod l errors by using probabilistic approach in which an ns mble of model's ver. ions is employed (Stainforth et aL, 2005; Mmphy t aL, 2004) to produce an ensemble of climat imulations leading to probability d nsity function (PDFs). Thi approach is computationally xpensive and showed som limitations on how to con truct the ns mbl rn mb rs as pointed out by Rodwell and Palmer (2007)(RP07 h reaftm-).
Inde d, th y howed that the ens mbl can iuclude a.rtificially tmbalanc d mem-bers, l ading to an unr ali tic appraisal of int rnal variability. Furth rmore, this internal varia.bility ha.s b en shown to b v ry s nsitive to the pa.ra.m terizations
used in th mod l (Créta.t and Pohl, 2012).
The origins of model nor ar till difficult to id ntify and repr sent a. chal
-lenging issue. The most popular way to asses model rrors is the confrontation to observation w hi ch al o con tain som err or, including bi ases and variances. These rn trics provide an estimate of model skill without fmth r information or details r lat d to ev ntua.l deficiencies in repr senting particular physica.l processes. Ad-ditional tools arc needcd to provid a. more detailed assessm nt of model -rror.
2
Another issue in limat model validation i th high computational cost invol-v d as the model to b a essed i often run for c long p riod and compared to
the ol s-rved climat . In numerical weather prediction, diagnostic tools axe us-d to
evaluate th realism of fast acting physical processes and may be useful to evaluate the same processes in use in climate mod ls. This could be less time consuming than having to run long climate simulations. These tools should be complemen-tary to the traditional assessments proc dur and can 1 e seen as preliminary test with a lower computational cost.
For r gional climate models (RCM ) , contrary to global elima te models, the model error issue is complicated by the fact that RCMs are limited-area mod 1 (LAMs) that must be driven continuously by ext mal data provid d by coupl d glo al climate models (CGCMs) or reanalyses. This driving or nesting can create inconsist ncies in th blending zone that can p netrat in the interior of the RCM model domain. This is due to everal factors such a the coar er patial re
olu-tion in driving data aJ1d diff r ne s in mod ls th ms lv s sp cially th way th y repre nt phy ical proces
Th
e
tota
l
initi
al
tendency
di
ag
no
st
i
c
During a model integration at ach tim step, th atmospheric stat is updat d. This involves diff r nt physical and dynamical proc sses aff cting the progno tic variabl s. RP07 propos d a diagnostic bas d on the physical processes tend n-ci s computed in th first moments of the model int gration, typically 6h. They showed that, wh n averaged over a larg number of integrations, this measure is equival nt to th mean analysis increm nt brought in by the data assimilation. On the other hand, a rn an analysi increment av raging to zero is an indication that the model us d is unbias d with r spect to obs rvations and that th assi-milation is well balanced. Giv n the quivalence to the m an analysis increm nt,
on could us th initial tendency diagnostic to assess the dynamical equilibrium of th mod 1. This approach can then easily b us d, provid d th mod 1 ass ss d is the sam as th on u ed in the data assimilation ystem. Th RP07 proc -dur consists in an ens mble of short int grations staJted from analy es obtained from an assimilation system using th sam model. As w av rage over th first
moments of th int gration, only the fast-acting physical processes are taken into
account in the initial tendency computation. For a variable X, the mean total
initial tendency can b xpres d as,
wh re subscripts 1, 2, ... , N represent the different physical process s involved in
th X variabl updat . The symbol ( ... ) denotes an average intime and space as
the average can be done spatially over a particular r gion or globally.
Using an approach introduced by Klink r and Sardeshmlù<:h (1992), RP07
used th initial tendency diagno tic to assess the European Center for Medium
-range \iVeather forecasts (ECMWF) model, over a particular region, by modifying
orne param ters used in the convection paramet rization schem . They d mon
s-trated the effect of those perturbed parameters on th mod l's dynamical balane
and how this diagnostic points to inconsist nci s in th mod 1 phy ic . In their study, RP07 modifi d the entrainment rate used in the convection scheme to re -gulat the moistur mixing b tw n th convective plume and the environment. Th y found that this param ter setting can degrade significantly the dynamical balance. They also used this diagnostic to examine the improvement in the model
balance when a new cloud schem is incorporat d as is often done in numerical
weather prediction. They also made th point that this approach has a c
ompu-tational cost of only "' 5o/c of that associat d with the evaluation by performing
sev ral climate simulations. Rodwell and Jung (2008) u ed the same diagno tic on th ECMWF mod 1 wh n a n w a rosol climatology is used and showed its impact on the radiatiou parameterization sch rn and the subs quent impact on other processe .
Reg
i
ona
l
data
assimi
l
at
i
on
RP07 hav shown that the initial t ndency diagno tic suitably averaged is a useful diagnostic to valuat. th dynamical balane of a rnodel. A good balance is to b expected wh n the different physical and dynamical proce es are consistent wi th one another. RP07 also showed that this diagnostic provid s a d tailed d sc
rip-4
tian on how th madel treats very process and can h lp to id ntify vvhich one is poorly or badly represented and how each process react to a chang in th mod l.
However, tou e this diagnostic, the mod l valuate has to b u. d within a data
assimilation system providing the analy s us d to initialize that madel. Cons -qu ntly, this is a good inc ntiv to us a climate madel within a data assimilation system to be able to apply this initial tend ney diagnostic. Moreover, assessing a regional climate mod 1 usinrr this diagnostic requires a regional data assimilation syst m.
Implementing a fully cycled r gional data assimilation is a challenging task r quiring a d tailed validation of compon nts a sociat d with ob rvations, and
error statistics of observations and the short-tCI·m forccast of th climate madel w hi ch would provid the a priori estima tc rcferred to as the background state.
Mor ov r, r gional data assimilation needs to fac the difficulti s associat d with th fact that the madel is dTiven at its lateral boundaries. This rai issu . in the way observations must be treated in th particular bl nding zone wh r
discontinuiti sor strong gradient can occur.
A regional data assimilation system bas d on th 11fth g n ration Canadian
r gional climat mod l (CRCM5) (Zadra et al., 2008), d velop d at the ESCER
(Étud t Simulation du Climat à l'Échelle Régionale) c ntre, would certainly be
very us ful to the madel development using th initial tendency diagno tic to it
fullest. Moreover, the as imilation would provid a dir ct comparison to obse r-vations through the so-called innovations, defin d as the d partur betwe n the background stat and th obs rvations. Furthermor , thi r gional ata a
imila-tion syst m can b a first tep towards a reanaly i. at a higher r solution, whi h
would b u eful for r gional climate studies.
Pr
ev
iou
s
work
Initial and lat ral conditions impact on the madel simulation repres nts an
im-portant aspect that ne ds to be consid red with care. Wu et al. (2005) hav shawn that initial and lateral conditions have a significant impact on climate simulations.
mo-ment of the integration while the lateral condition can induce biases. Analy e are know11 to produce spinup imbalances associated with spmious gravity waves (Gauthi r and Thépaut, 2001). This issu is addr ss d using digital filters (Lynch,
1997) or normal mode initialization (Machenhauer, 1977). In a previou work,
Chikhar (2011) studi d imbalances associated with the initial conditions for the
Global Environm ntal Multiscal mod l (GEM). Using 3D-Var and 4D-Var ana-lyses from the Met orological Service of Canada (MSC) (Gauthier et al., 1999,
2007) produced with a model very similar to the one being assessed, the r ult.
show d significant differ nees in the TI:·opics between 3D-Var and 4D-Var experi
-m nts. In the case of 4D-Var, the convective activity was found to be more intens particularly in the Intertropical Convergence Zone (ITCZ). This counter-intuitive result could b explain d by the simplified physic in the MSC 4D-Var sy tem which does not include convection. The impact of non-native or external analys s was also examined. singERA-Interim reanaly es from ECMWF, the model us d in the data assimilation sy tem is then different from the GEM model to be as
-s -s d. Th initial tendency diagnosed reveal d cl arly the so-called 'initial shock' (Klocke and Rodwell, 2014) grading consid rably the mod l's balane due to inconsistencies b tw n the two models. Th initial t ndency diagnostic showed that the vertical diffu ion is very strong in the fir t moment. of the integration whereas the convection process is nearly absent. The presence of a very table lo-wer layer as well as drier analys . (in the TI:·opics) could explain the non triggering of th convection.
The Canadian R gional Climat Mod l (CRCM5) dynamical equilibriurn was also investigat d. In this case, th model is supplied with diff r nt initial and bm.mdary conditions. Restùts showed that the CRCM5 is better balanced wh n initializ d and driv n by MSC analy s, refl.ecting the fact that the CRCM5 is built from th limit d-ar a configmation of th GEM mod l (same physics and similar
re olution). It was al o hown that th global mod l GE 1 is better balanced over the CRCM5 domain than the r gional model. This result suggests that a high r resolution r gional analysi could be better suited for the CRCM5. vVhen
initia.liz d and driv n by ERA-Interim r analyses, the CRCM5 initial balance shows similar ehavior as wh n it is driv n by th global GEM analys s.
6
Ob
j
ctiv
sand
methodology
The main objectives of this thesis is to investigate the potential benefits of using
th tendency diagno tic as an ass ssm nt tool in the CRCM5 development, as well
as applying new tools made available from a regional data assimilation ystem. This th sis is structur d in th form of cientific pap rs presented as chapt rs.
In the first chapter, it is aimed to answer qu stion such as "How do initial
and lateral conditions affect the CRCM5 dynamical balance in th first mom nts
of the integration?" and "To what xt nt initial conditions resolution impact the
mode! dynamical balance?". To address these questions, the initial tendency diag -nostic is employ d using differ nt initial and driving data as MSC 4D-Var analyses and ERA-Int rim r analyse at lovv and high resolution. In th cond chapt r, th question to b answered was "How does the CRCM5 r pond to varions boundary
conditions for long r integrations ? 11
• To address this issue, 14 mon th simulations ar p rform d using diff r nt driving data (outputs from CanESM2 and MP
I-ESM mod ls and ERA-Interim reanalyses). Analysis and compaJ·ison b tw n the different simulations are done through the proc ss tendencie computed and averaged ov r a season. Finally, the third chapt r aims to pr sent and evaluate a regional data assimilation system bas d on CRCM5 over orth America, the
objective being the validation of the model using the RP07 initial tendency diag -nostic. This regional syst m is adapted from the Envar data as imilation system of
Environment Canada and assimilates th same sets of obs rvations. Fully cycl d analys s 31· produced very 6-h over the month of January aJld July. R sults aJ'
evaluated through the xamination of mean analysis increments and data moni-toring in ad di ti on to comparison to anal y e from oth r sourc .
Th ov rail obj ctiv of this thesis is to provid n w tools to assess CRCM5 through diff r nt persp ctive . This will hop fully contribute to the madel d ve -lopment.
IMPACT OF
A ALYSES
0
THE
DY
IAM
I
AL BALANCE
OF
GLOBAL A
D LIMITED
-AREA
ATMOSPHERI MODELS
This chapt r is pres nt d in th format of a sei ntific articl . I is publish d in
th Quarterly Journal of the Royal M teorological Society. Thi articl is
entirely 1 ased on my work with the co-author involv d in sup rvising all the tasks and text revision. The detailed r ferenc is:
Chikhar K, Gauthier P (2014) Impact of analyses on th dynamical balane of
global and limit d-area atmo ph rie mod l . Q.J.R. Meteorol. Soc., 140: 2535-2545. doi: 10.1002/qj.2319
Impact of analy cs on the dynamical balance of global and limited-ar a atmo pheric mod ls
Kan1 l Chikhar and Pierre Gauthier
CentreE CER (Étud t Simulation du Climat à l'Échelle Régionale), D'partem nt de ci ne s de la Terre et de l'Atmosphère
niv rsité du Québec à Montréal (UQAM) B.P. 8 8, Suce. Centre-ville
Abstract
Dynamical imbalanccs can induce purious variability which can b diagnos d from th phy ical tendeucie observed in th first mom nts of short-t nn forecasts using as initial onditions analyses obtain d from an as imilation system u ing this model. In thi. articl this approach is tak n to inv stigate differences in th balane ob tain cl from 3D- and 4D-Var analys s, using the for cast-assimilation syst rn of th M t orological rvi of Canada (MSC). The result indicatc that th mod 1 i. th n in goocl balane globally but the 4D-Var anal y es slightly up et the balane in th Tropic , thereby alt ring th characteristics of th Int rtropical Convergcnc" Zon (ITCZ). As th a: imilation is clriv n by a particular mocl 1, th r sulting analy e k p ém imprint of th clynamics of that moclel and us of thi analy i with an th r mod lmay not b as w 11 in balance duc to th differences betw en th two models. To. tudy this point, ERA-Int rim 4D-Var reanalyses were used as initial ondition first at a low r horizontal and v rtical r olution, and then at a re olution clo r to that f the Global Environmental Multiscale (GEM) model. Th high r-rcsolution r analy es led to a b tter balance than that with a low r-r solution version of th ER -Interim reanalyses. The coars r analyses cr at ignificant imbalance. in the Canaclian global mocl 1 which p r i t for more than 5 day . In particular, it was not cl that conv ction i n arly abs nt arly on as if at a lower r olution, th ERA-interim analy clicl not inj ct ufficient humiclity to trigg-r conv ction. It was also notecl that r ducing th v rtical resolution is mor damaging than u. inga coarser horizontal r solution. In limitecl-ar ar gional climat mo el , xternal analy are u ed to defin the boundary conditions and the Cauadian Regional Climate Mod l ( CRCM) was u cl to ass ss th impact of diff rent way to define the boundary condition,. Th CRCM is a limit d-ar a configuration of the GEM global mod lu d in th 3D- ancl4D-Var assimilation. Exp rim nts w re concluct d in which th botmdary conditions driving th CRC i
ar provicl d v ry 6 h a is usually don for the CRCM climat simulation .. When using 4D-Var R.nalys s émd ERA-Int rim reanalyses ( coarse and full re. olution) to clefin the bouudary condition. , the results indicat that imbalance p rsist even after 15 days and ar mor . ignificant for the coars r analy es. Mor ov r, ev n though th mod l xhibits r lativ ly goocl balane initially after days imbalances
10
appear gradually in th int rior of the r gional mod l domain.
K y Words : data assimilation; dynamical balane ; phy ical proc sses; limited -area models ; mun rical w ath r prediction ; regional climate modeling
1.1
In
troduction
Futm climat proj ction. ar obtained by using incr asingly compl x mocl 1 . Th s proj etions are as ociat cl vvith uncertainties related to cliff rent rror. ourc s
(Stainforth et al., 2005; furphy et al., 2004). An important somce of uncertainty
is the mo del rror. Inde cl, mo dels con tain err or of different kinds and th se can lead to unrealistic simulation . A recognized source of error in the modcl lies in
cl fici nci s in th representation of subgTid physical proc ss . The mod 1 errors
ar usually quantifi cl by comparing the forecasts to obs rvations. Thi, t chnique provides an stimation of th model errors without a pr cise information on their origin. The latter is much hard r to identify especially when multiple error factors
combine. Complementary tools are then need cl to assess models' perfonnanc and
identify ev ntual errors mor clearly and with more detail . Rodwell and Palm r
(2007), hereafter RP07, 1 ropo ed a diagno tic tool based on the initial syst m
a-tic t ndencies. It provides useful information about the consistency of th model's physics as it relaxes toits own climatology in th first mom nts of the integration. How v r, it is w 11 known that analys s can themselv s cr at spin-up probl m
that can b addres cl u ing normal mode initialization or digital filtering to
re-move. pmious gravity waves. Gauthier and Thépaut (2001) showed that 4D-Var
analyses provide initial conditions that are better balane cl and do not requir as much the application of other constraint to maintain this equilibrium.
Th approach proposcd by RP07 consist in carrying an n mbl of u cces-SlV short tim int grations from whieh phy ieal t nd ncies ar . xtract cl. Each
in-tegration starts from an analysis produeed by a data assimilation syst m using the am mocl l. Th m t orological variable (e.g. temp rature or sp cific htmüdity) tendencies associatecl with each individual physical process are then determined
and, when a.veraged intime and over a. specifie region, they yield systema.tie initial t nd nci s whieh giv a reliable measur of the mod l's dynamical quilibrium. A w Il-balane cl mod 1 would yi ld syst matie t ndenci s clos to z ro, whil lm·ge
valu s would indieat imbalanees and th u ineonsist neies in the r pr s nta.tion of phy. i al proce s s of the model. In this article, this diagnostic is us cl first to
examine the Global Environm ntal Multiseal (GEM) model's dynamical balane when initializ cl by its own 3D-Var and 4D-Var analyses produced at th M t
o-12
rological S rvice of Canada (MSC) (Gauthier et al., 1999, 2007). On could also be interested to assess the equilibrium of the GEM madel when initialized by
'external' analyses. In th present case, the Emopean Centre for Medium-range
Weather Forecasts (ECMWF) reanalyses 'ERA-Interim' (Dee et al., 2011) were
us d and refiect th particular equilibrium of the madel used in the assimilation system. The result indicate that better balance is obtained if spatial resolutions ar close, particularly in the vertical. Finally, as regional climate mod ls ar driven through lat ral boundary conditions d fined by a diffei· nt mod l, w wanted to a s ss th dynamical balance of the Canadian Regional Climate Madel (CRCM) when initialized and dr iv n by MSC 4D-Var analys s or ERA-Interim reanalyses. To assess how long it takes to recover from an initial imbalance, the madel balance
xamin d wh n the models are int grated over a longer p riod (15 days). The article is organized as follows. In section 1.2, them thod us d to com
-put th total initial tendency is pr sented. The mod ls us d, th data assimilation system and the experim nts achi v d are de crib d in section 1.3. The different r sults obtained are pre ented and discu sed in sections 1.4 to 1.7. Further dis-cussion and som conclusions ar given in section 1.8.
1.2
Diagnosin
g
dynamica
l
ba
l
ane
ba
s
d
on av
ra
g s
of physica
l
tendencies
When initial conditions defin d by an analysis are used, the model may xhibit a transi nt b haviom that can persist for sorne tim . To avoid this numerical w ath r pr diction ( WP) mod ls have resort d to nonlin ar normal mode ini-tialization or digital filters to filt r out th spmious gravity wav s as ociat d with this initial imbalance (Machenhauer, 1977; Baer and Tribbia , 1977). Klinkcr and Sardeshmukh (1992) xamined th initial physical t nd nci s of the model as a mcasur of th imbalance. Rodwell and Palmer (2007) th n pointed out that the av rag of the physical tendencies over a period of 6 h corresponds, but with th opposi t sign, to the analysis increment brought in by the assimilation. Th refor , sine th analysis increments average to zero over a large number of analys s, on would th n expect that, similarly, the total physical tendency would also av rag out to z ro. It is important that, for this to hold, the madel used should b th
ame as th on used to do th as. imilation.
In th RP07 procedure, the first time step is exclud db cau of it di tinc-tive natme with r sp ct to th subs qu nt ones. The analysi being used as initial conditions, the first tim step has a strong imprint from the analysis. Mor ov r, a cold start is often us d in which som physical tend ncies are set to z ro, knowing that th-y will b quickly r stor d within a few tim steps. Averaging over a period of 6 h is ab tter approach to captur variations associated particularly with th diurnal cycle, when the thermal tendencies a.re con ider d. In their study, RP07 highlighted that th se initial imbalanc s refi ct pot ntial fiaws of fast-acting phy-sical processes which can creat artificial variability. This information could b
-particularly helpful to as ess th valu of multimod l climate simulations oft n us d to e timate the une rtainty associated with climate cenario (Stainforth t al., 2005). Another interesting application is that pr s nt d in Ro lwell and Jtmg (2008), who used th teudency diagnostic to evaluat the improv rn nt obtained wh n modifications are made to the forecasting system.
In our study, this RP07 procedure will be u ed to comput om t ndency diagnostic. A d tailed d scription is given in the n xt subsection.
14
1.2.1
Total
initial t
e
nd
e
ncy
The atmo. phere is simulated by mod ls through a r pr sentation of a s t of phy -sical and dynamic processes, and prog;nostic variabl ar updated by all r lat d
proc ss s at ach int gration tim step. The resulting total temporal tendency of
a c rtain variabl consists of the combination of the individual tendencies from all
proces. es. Th diagnostic for temperatur tendency used in this study is d fin d
a. M . M k
~
" ' j ;. total=
~
" ' " '
j;.P M ~ t M ~~ z i=l i=lp=l (1.1)where M i the total forecasts mm1b r, t/otal is the total tend ney, and
t
l,
p=
1, ... , k, repr ent the individual tendencies of th k physical proc ss s,namely adv tion, shallow and deep conv ction, radiation, larg scal-condensation and vertical diffusion. As shown in RP07, the a ver ag of th anal y is increm nts
ol tained over an assimilation window T corresponds approximately to the average
of the tcmperatur tcndencies taken also over the period. If T
=
nb.t is the lengthof the as. imilation window, and considering Nf con cutiv analys s at times ti with i
=
1, ... , M, it can e shown that the av rage of the analy is incr rn nts correspond approximately to the average physical total tendency(1.2)
where Ti(.j)
=
Ti(ti+
jb.t). A detailed demonstration of this correspondence canro a... ..s:::: 200 400 600 (a) - 0.6 -0.4 -0.2 (b} - 200 - 400 - 600 0.0 0.2 0.4 0.6 0.8
Figure 1.1 Zonal mean of (a) averaged temperature incr ments (K) and (b) averaged total physical t nd ney multiplied by the time st p as xpressed on th right-hand side of Eq. (1.2). The v rtical coordinate is linear in pr ssm .
step so that t mp rature i upclated every time step by ali phy ical proc s s. The initial tendenci s are av rag d over a ix hours period, th fir t time tep being excluded as di cu sed pr viously. '] nd ncies are computed for ach grid point
aJ.ld then averaged spatially ov r th whole globe as well as ov r sp cilie regions lik the Tropics, for exan1ple. These spatial av rages axe obtained by weighting
ev ry grid point by the size of the mesh. In order to evaluate the equivalence b tw en the mean increment and th mean total physical tend ney, an assimilation cycl for one month has b en complet d and the two sid s of equation (1.2) have
been comput d for that period. The result is presented in figme 1.1 where this
16
1.3
Model
,
assimilation
system an
d
e
xp
e
rim
e
nt
s
1.3.1
The Global
Environmental
Multiscal
e
model
The Global Environmental Multiscal (GEM) model has been developed at the Meteorological Service of Canada (MSC) (Côté et al., 1998; Mailhot et al., 1998) and can be run in global mode with uniform or variable resolution, and also up-ports limited-ar a configurations for high-r solution regional forecasts. The global uniform configuration used in this study has a horizontal grid mesh of approxima
-tely 50 km at the Equator and us s a hybrid coordinat and has 80 v rticall vels with a top at 0.1 hPa. The time step is 15 min. Th model configuration considered here uses the following parametrization schemes: corr lated-K sol~Œ and terrestrial radiations of Li and Barker (2005), Kain-F1:itsch for deep convection (Kain and FJ·itsch, 1990, 1993), Kuo transient for shallow convection (Kuo, 1974), Sundqvist for large-scale condensation (Sundqvist, 1978), the vertical diffusion of Mailhot and Benoit (1982) and ISBA (Int ractions between Soil-Biosph r Atmosph r ) for surface processes (Noilhan and Planton, 1989). A d tail d 1 scription of the model physics can be found in Mailhot et al. (1998) and Bélair et al. (2009).
1.3.2
Th
e
C
a
nadian Regional Climat
e
mod
e
l
Th r gional mod l used in this work is the CRCM5, a limited-area version of the GEM mod 1 (Zadra et al., 2008) that could be set over any area on the globe. In
our study, the CRCM domain covers North America (Figur 1.2) with a 20 km horizontal grid me h and 10 min time step. It has the am vertical discretization with the lid at 0.1 hPa an the same param trization schemes as tho e of the global configuration d scribed above. The CRCM lateral boundary condition are supplied using a one-way nesting m thod (Davie , 1976; Yakimiw and Rob rt, 1990).
17
Figure 1.2 Th CRCM domain.
1.
3
.
3
A
similation system
Th thre -dim nsional variational data assimilation (3D-VaJ·) system was impl
-rn nted at MSC in 1997 and xt nd d to four-dim nsional variational data as
-similation (4D-Var) in 2005 (Gauthi r t al., 1999, 2007; Laroch t al., 2007).
Th variational formulation is ba ed on the incr mental approach ( Com·ti r t al.,
1994). The analysis incr rn nt is calculated at a lower resolution than th fore-cast mod l and is fom1d by minimizing a cost function u ing the quasi-N wton algorithm (Gilbert and Lemaréchal, 1989). In 3D-Var, the backg,Totmd is obtain d from a 6 h for cast and the analysis increment is determined at the centr of a
6 h assimilation winclow. Conventional data are as imilated over a 3 h win low
whereas radiances are assimilatcd over a 6 h window. In the 4D-Var system, the assimilation window i also 6 h and the backgrotmd is now a trajectory obtain d from a 9 h for cast. Data are assimilated over the whole window, thus increasing considerably th ir numb r compared to th 3D-Var syst m. A detail d d cription of thes assimilation syst ms can b fom1d in Gauthi r t al. (1999, 2007).
ERA-Interim reanalyses, us d in this study, are produced at T25v
(rv
79 km) horizontalgrid mesh by a 4D-Var data assimilation system u. inga 12 h assimilation window. The for cast model used to produce th backgrotmd is basecl on Integrat d Fore-cast System (IFS) r l ase Cy31r2 with T255 sp ctral horizontal r solution and 60 verticallevels with a top at 0.1 hPa. A detailed description of th ERA-Interim
1
r analysis can b found in De et al. (2011).
1.3.4
Configuration
of
the
ex
p
er
im
e
n
ts
Several ex1 riments are realized in order to ass s the GEM global model dyna-mical balance as well as that of the CRCM. In the case of CRCM, different typ of initial and boundary conditions ar us d, the obj ctive being the as. essment of th ir eventual eff ct on mod l quilibrium. The initial and boundary conditions
us d in this study ar- MSC 3D-Var and 4D-Var analy s and ECM\iVF
ERA-Int rim reanaly e at low and high resolution. The e datasets will be noted in this article as MSC3D, MSC4D, ERA-low and ERA-high respectively. In ach xp
-riment, sev ral ets of integrations ar p rform d covering the month of January 2009. Short and medium-range simulations are tarted every 6 h from 0000 UTC
on 1 J anuary. W- consid r that th total numb r of int gr at ions is suffi ci nt to
resolve synoptic vaxiability.
In a different set of experim nts, longer-rang simulations are completed with the GEM global model and the CRC f. A b fore, runs ar start d very 6
h from 0000 UT on 1 January. The aim is to examine the t mporal volution
of th dynamical balance when different initial and boundary conditions (for th CRCM) are used.
1
.4
I
mp
act
of
t
h
ass
imil
at
ion m
et
hod
H re, w examin the potential ffect of the assimilation proc dm (3D-Var and 4D-Var) on th model dynamical balane . W expect an improved dynamical
qtùlibrium wh n the model is initialized by 4D-Var analy es, the latter b ing known to b b tt r balanced than 3D-Var analyses (Gauthier and Thépaut, 2001;
Laroche et al., 2007). In this exp riment, GEM model int grations are initialized
by MSC3D and MSC4D produc d by MSC using a GE il model onfigmation v ry
similar to that u d her .
Figme 1.3 hows th r sulting temperature tendency profil s averag d ov r
processes acting on th temperature, and the thick black line r presents the net
tendency (i.e. the total of all individual process tendencies) In general, profiles are similar for the two cases (MSC3D and MSC4D). How v r, when initialized by
MSC4D, the madel is . hown to be lightly mor unbalanc d compar d to
imu-lations using MSC3D, specially in th Tropics (Figm 1.3(d)). Wh n av rag d
globally the balance is established in the middl troposph r b twe n the radia-tiv cooling (radiation) and the heating due to lat nt h at r leas from conv ction
and larg -scale cond n ation. In th Ttopics, th equilibrium is fotmd maiuly b t
-ween cooling du to radiation and downward movement (vertical adv ction) and latent heat release from convection. In the lower 1 vels, th profiles are very
simi-lar except small diff renee. in radiation t ndenci s arotmd 950 hPa and hallow.
conv ction around 900 hPa.
A clos r look at profiles in the Tropics r v als significant diff r ne s in
convec-tion t ndenci between MSC4D and ifSC3D simulation. Th convection activity is found to be stronger in the cas of MSC4D, r sulting in mor h ating in th
atmosph rie mid-1 vel .To xamin more d ply this diff r ne , th t nd ney du
to conv ction is examin d at 500 hPa (Figure 1.4). We can clearly ee that th convective activity along the Int rtropical Convergence Zon (ITCZ) is more in
-t ns in MSC4D simulations, esp cially ov r th oc ans. This' xc s ' in conv ctive
activity is r sponsible for th imbalanc show d by t mperature profiles (Figm
1.3(d)). This is a cotmter-intuitive re ult because 4D-var analyses are known to b better balanced than those produced using 3D-Var system. Specifie humidity te
n-d ncies (not shawn) show larg r deficits in water vapom cont nt and lead to th
same conclusions, i .. more convection in the ITCZ for MSC4D simulations.
Ano-ther issue is the simplified physics used in the MSC 4D-Var syst rn ( vvhich does
not include convection) and this could aL o explain this diff renee. As shawn in Figur 10 of Mahfouf and Rabier (2000), using simplifi d physics without conv
ec-tion result in an increase in the pr cipitation in th first moments of integration.
Comparing th humidity analyses obtain d with 3D-Var and 4D-Var (not hown) indicates that th latt r ar mois ter. The r sul ting precipitation l ads to incr a-s d t mp rature tendency, particularly in th Tropics. This is consistent with the
20 (a) ~;g,--~--.~~~...---r===i! - CON 100 200 300 400 :f 500 E. 600 700 800 900 - RAD - ADV - VDIF - LSP - TOT 1 00_94L _ __ ~2 _.L~~o
::::::
::::::::::;::::= _
_j 4 [K day-1] (cl ssr---~--~~...---r===::~ - CON 100 200 300 400 :f 500 E. 600 700 800 900 -RAD - ADV - VDIF - LSP - TOT 1 oo~4L _ __ 22::2'5~of:::::::::::::::=,___j 4 [K day-1] (b)58
- CON 100 - RAD 200 - ADV 300 - VDIF - LSP 400 - TOT <ij' 500 n. E. 600 700 800 900 1 00_94 -2 0 2 4 [K day-1] (d)58
100 200 300 400 <ij' 500 n. E. 600 700 800 900 100_94 4Figure 1.3 T mp ratme initial tend ney profile (K day-1). Tendencies are com
-puted for th first 6 h of th int gration excluding the first time step. (a, b) show
profil s obtain d from simulations initializ d by M C3D and averaged (a) globally and (1 ) over th Tropic . (c, d) ar as (a, b), but for integrations started from
MSC4D. The different colomed lin s correspond to the physical proc s s
conside-r d: radiation (green), adv ction (blu ), conv ction (r d), large-scal cond n ation (magenta) and vertical diffusion (orange); the black lin shows the n t tendency.
The v rtical coordinate is linear in pres me. Horizontal bars are 95% confidence int rvals, showing v ry low values especially in the global case and above 800 hPa.
(a) (b)
60S
60( 120[ 180 120W 60W 60( 120E 180 120W 60W
-5 -4 -3 -2 -1 0 1 2 3 • 5 -5 -· -3 -2 -1 0 1 2 3 • 5
Figure 1.4 M an temperature tendency due to convection (K day-1) at 500 hPa
from (a) MSC3D simulation and (b) MSC4D simulations.
The re ult pr sent d in this .ection as essed the impact of analyse produced by assimilation systems driv n by th am mod l as the on us d to do the forecasts. In th next ection, w examin th mod l balance when analys s ar produced by a diff rent mod l. The idea is to explor th int raction betw en a model and external analys s and compare the results obtain d to tho when the mod l is initialized from its o>vn ru1alyses.
1
. 5
Us
e
of
e
xt
e
rn
a
l
a
n
a
l
y
ses
In th previous experiment, the background stat used in the assimilation pro-ducing th analyses is obtained from a mod l v ry similar to that we as. css d, aJ1d this background state leav san imprint on the analysis. The results obtain d showed a fairly good dynamical balance. ow w inv stigate if this equilibrium is maintained when using xternal analyses based on a differ nt moclcl and as. imi-lation ystem. An experiment identical to the pr vious one is conducted, cxcept that the GEM model i, now initialized by ECMWF ERA-Int rim reanalyses. I ni-tial conditions used in this xperim nt ar- the ERA-Interim atmospheric fi lds compl mented by 1 C surfac analy. s.