Tropical cyclone activity affected by volcanically
induced ITCZ shifts
Francesco S. R. Pausataa,1and Suzana J. Camargob
aCentre ESCER (Étude et la Simulation du Climat à l’Échelle Régionale), Department of Earth and Atmospheric Sciences, University of Quebec in Montreal, Montreal, QC H3C 3J7, Canada; andbLamont-Doherty Earth Observatory, Columbia University, Palisades, NY 10964-8000
Edited by Kerry A. Emanuel, Massachusetts Institute of Technology, Cambridge, MA, and approved February 28, 2019 (received for review January 15, 2019) Volcanic eruptions can affect global climate through changes in
atmospheric and ocean circulation, and therefore could impact tropical cyclone (TC) activity. Here, we use ensemble simulations performed with an Earth System Model to investigate the impact of strong volcanic eruptions occurring in the tropical Northern (NH) and Southern (SH) Hemisphere on the large-scale environ-mental factors that affect TCs. Such eruptions cause a strong asymmetrical hemispheric cooling, either in the NH or SH, which shifts the Intertropical Convergence Zone (ITCZ) southward or northward, respectively. The ITCZ shift and the associated surface temperature anomalies then cause changes to the genesis poten-tial indices and TC potenpoten-tial intensity. The effect of the volcanic eruptions on the ITCZ and hence on TC activity lasts for at least 4 years. Finally, our analysis suggests that volcanic eruptions do not lead to an overall global reduction in TC activity but rather a redistribution following the ITCZ movement. On the other hand, the volcanically induced changes in El Niño-Southern Oscillation (ENSO) or sea-surface temperature do not seem to have a signifi-cant impact on TC activity as previously suggested.
tropical cyclones
|
ITCZ|
ENSOT
he potential climate effects of large tropical volcanic erup-tions have received wide attention in the climate science community because the injection of sulfur gases into the stratosphere, which is converted to sulfate aerosols, can alter the Earth’s energy balance and hence climate (e.g., refs. 1 and 2). Important climatic impacts are a general cooling of surface temperature and a modification of the El Niño-Southern Oscil-lation (ENSO) phase (3–11). Although the cooling effect of sulfate aerosols on surface temperature is well established and could theoretically affect tropical cyclones (TCs), less attention has hitherto been given by the scientific community to the impact of volcanic eruptions on TC activity.Evan (12) reported a reduction of Atlantic hurricane activity in the years following the eruptions of El Chichón in 1982 and Mount Pinatubo in 1991, using a combination of observations, reanalysis data, and output from a numerical model. However, this study focused on the Atlantic only, and those two eruptions coincided with two strong El Niño events, which are known to reduce North Atlantic TC activity due an increase in vertical wind shear and atmospheric stability in that basin (13–15). More recently, Guevara-Murua et al. (16) revisited the response of Atlantic TCs to volcanism based on reconstructions of volcanic eruptions and Atlantic hurricane counts for the last three centu-ries, confirming the findings of Evan (12) for that basin. They showed that both low-latitude and northern high-latitude erup-tions reduce Atlantic TC frequency. The authors suggested the decrease in local sea-surface temperatures is responsible for TC frequency reduction following low-latitude eruptions, whereas the mechanisms for the decrease in TC frequency after high-latitude eruptions was less clear and needed further investigation.
Using the Community Earth System Model-Last Millennium Ensemble, Yan et al. (17) compared the TC activity of the 3-y preeruption with the 3-y posteruption. They showed that volcanic eruptions alter TC activity and that the latitude of the eruption (tropical, Northern or Southern Hemisphere) is important in
determining where TC genesis is enhanced or reduced. They concluded that volcanic eruptions impact TC activity through changes in radiative forcing and ENSO phase. However, the au-thors did not differentiate between the two. Using the same sim-ulations, Korty et al. (18) showed that the hurricane potential intensity decreased in the seasons immediately following large volcanic eruptions, due to vertical temperature changes: an in-crease near the tropopause and a dein-crease in the lower and middle troposphere. Finally, in Chiacchio et al. (19) a statistically significant relationship between the stratospheric temperature and Atlantic TC frequency was discussed, suggesting a link among the changes in the stratospheric aerosol optical depth, ENSO, and TC activity. A recent study (20) showed that there is no statistically significant robust decrease in global TC activity following recent volcanic eruptions using TC observations, reanalysis, as well as various diagnostics of TC activity from multimodel historical simulations.
Here we use a Norwegian Earth System Model (NorESM1-M; Methods) with an aerosol module embedded to perform a set of volcano and no-volcano ensemble simulations and systematically investigate the response of TC activity to large tropical volcanic eruptions. Our goal is to assess the role of large volcanic erup-tions in altering the large-scale environmental factors that drive TCs, separating the direct and indirect responses to the radiative forcing. In particular, we investigate whether the changes in TC activity are merely a response to the volcanically induced surface cooling or ENSO phase, or whether other factors play a role altering TCs. To capture and separate the effect of the ENSO response from the radiative forcing, we simulate two scenarios in which large boreal summer eruptions occur in the tropical Northern (TrNH) and Southern Hemisphere (TrSH). In doing
Significance
Volcanic eruptions can inject a large amount of aerosol particles, which interact with solar radiation and consequently can affect the climate worldwide, hence the intensity and frequency of extreme events for a few years following the eruption. How-ever, only a handful of studies have investigated the impacts of volcanic eruptions on tropical cyclone activity. Through a set of sensitivity modeling experiments, our study demonstrates that volcanic eruptions by shifting the Intertropical convergence zone can impact tropical cyclone activity up to 4 years following the eruption. These results will prove valuable to society, allowing us to better prepare for the consequences of changes in tropical cyclone activity following large volcanic eruptions.
Author contributions: F.S.R.P. designed research; F.S.R.P. performed research; S.J.C. con-tributed analytic tools; F.S.R.P. and S.J.C. analyzed data; and F.S.R.P. and S.J.C. wrote the paper.
The authors declare no conflict of interest. This article is a PNAS Direct Submission.
This open access article is distributed underCreative Commons Attribution-NonCommercial-NoDerivatives License 4.0 (CC BY-NC-ND).
1To whom correspondence should be addressed. Email: [email protected]. This article contains supporting information online atwww.pnas.org/lookup/suppl/doi:10. 1073/pnas.1900777116/-/DCSupplemental. EARTH, ATMOSPHERIC, AND PLANETARY SCIENC ES
so, we confine the aerosol plume to only one hemisphere––either NH (in the TrNH experiments) or SH (in the TrSH simulations);
SI Appendix, Fig. S1.
For each scenario, two ensembles were generated that start from two ENSO-neutral years of a transient historical simulation carried out in Pausata et al. (21), with greenhouse gas and aerosol emissions, following the protocol detailed in Coupled climate Modeling Intercomparison Project phase 5 (CMIP5). Here we considered the years 1911–1964 as the reference period. Early summer (June 1) eruptions mimicking the largest tropical eruption of the last 500 y (Tambora, Indonesia, 1815;Methods) have been chosen since that time of year is the ENSO developing season and therefore the associated radiative forcing is most likely to affect the ENSO response.
Together with the volcano ensembles, we performed a set of simulations starting from the same initial conditions, but without the volcanic forcing (no-volcano ensemble). Hence, the resulting climate perturbation induced by the volcanic eruption (Δv) can be simply expressed as Δv = STATEv − STATEnv, where STATEnvis the unperturbed climate state, and STATEvis the climate state induced by the eruption. Each ensemble is composed of 20 members that are generated by slightly perturbing the surface temperatures (∼10−14°C) of the day of the eruption.
Although the ENSO response to volcanic eruptions depends on the chosen year (SI Appendix, Fig. S2), the TC activity response does not, and depends mostly on whether the eruption is confined to the NH or SH (SI Appendix, Figs. S3 and S4). Hence, for clarity we merged the two ensembles for each scenario. We focus on the short-term (1–4 y) TC response to volcanic eruptions.
To investigate the potential changes in TC strength, we calculate the potential intensity (PI). We focus our analysis on the Genesis Potential Intensity index (GPI) to summarize the environmental factors (thermodynamic and kinematic) that are most important for TC genesis and hence TC activity; see
SI Appendixfor details. Although widely used to infer changes in TC intensity and genesis, the PI and GPI are not perfect proxies for TC activity changes. Although TC-like vortices can be tracked in climate models (e.g., ref. 22), low-resolution climate models, such as the model used here, cannot accu-rately resolve TC vortices, and hence have large biases in their climatology (23).
TC Response in the Year Following the Eruption
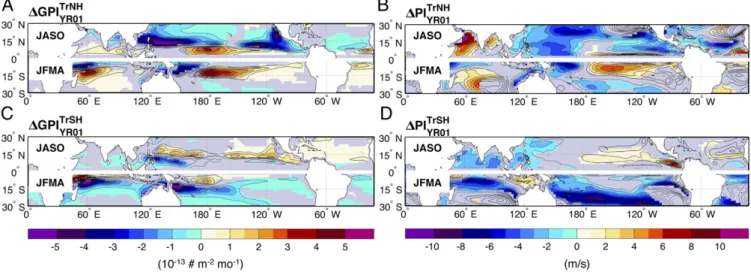
Our results show a clear shift of the locations more prone to the development of TCs in the first NH and SH TC seasons fol-lowing the volcanic eruptions [i.e., July to October (JASO) and January to April (JFMA), respectively] (Fig. 1). In particular, the TrNH eruptions lead to an overall southward shift in GPI both in the NH in JASO and in the SH in JFMA (Fig. 1A). During the boreal summer, a decrease in the GPI is simulated north of ∼10°N while an increase is shown between the equator and ∼10°N. In the SH, the GPI southward shift is accompanied by a west–east translation of the GPI maxima in the southwestern Pacific, with an overall decrease over the coasts of Australia, Indonesia, and Tanzania, and an increase in Madagascar and Mozambique.
On the other hand, TrSH eruptions have almost the exact opposite effect: A general northward shift is simulated in the first TC NH and SH seasons (Fig. 1B). However, the western coast of Australia experiences a decrease in GPI under both types of eruptions.
After TrNH eruptions, PI decreases strongly in most of the Pa-cific and the North Atlantic main development region in JASO, whereas PI increases over the northern Indian Ocean (Fig. 1C). In JFMA, PI decreases over southwestern Pacific Ocean, around Australia and Madagascar. In contrast, PI increases in the central southern Indian Ocean and South Pacific and Atlantic Oceans (Fig. 1C).
PI anomalies from TrSH eruptions are not exactly opposite those from TrSH anomalies as was the case for GPI. PI de-creases in the tropical western North Pacific, as well as Mela-nesia and western Australia, as under TrNH eruptions. Tropical Atlantic PI weakly increases in the eastern part of the main development region, and decreases over the northern Indian Ocean (Fig. 1D). PI decreases occurs over most of the SH.
In summary, tropical eruptions lead to a consistent decrease in environmental variables associated with the number and intensity of tropical cyclones over Southeast Asia, northwestern and northeastern Australia regardless of whether the eruption occurs in the NH or SH. In the other regions, TrNH and TrSH eruptions lead instead to opposing effects. In particular, the variables asso-ciated with number and intensity of TCs decrease in the North Atlantic after TrNH and increase following TrSH eruptions.
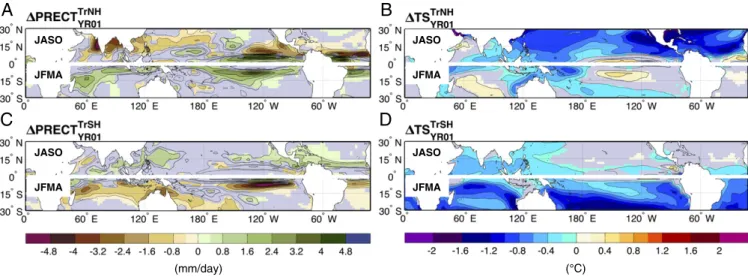
The GPI anomaly pattern closely matches the volcanically induced changes in precipitation, while in many regions the PI
Fig. 1. (A–C) Changes in genesis potential index (GPI) and (B–D) potential intensity (PI) for TrNH and TrSH experiments relative to the no-volcano reference simulations for the first storm season (JASO) in the NH; JFMA in the SH) following the volcanic eruptions in each experiment. Only values that are significantly different at the 5% level using a local (grid-point) t test are shaded. Only PI changes where the GPI is larger than 0.2·10−13events per square meter per month are shaded. The contour intervals (dashed, negative anomalies; solid, positive anomalies) follow the colorbar scale. The zero-anomaly line is omitted for clarity.
anomalies are strongly associated with the changes in sea-surface temperature (SST) (compare Figs. 1 and 2). TrNH eruptions shift the ITCZ southward both in the NH and SH storm season (Table 1). On the other hand, TrSH eruptions tend to shift the ITCZ north-ward in the first TC seasons (Table 1). The ITCZ shifts in our ex-periments are linked to an asymmetric forcing that pushes the ITCZ away from the hemisphere being cooled (8, 24, 25): During TrNH eruptions, the cooling is mostly confined to the NH (Fig. 2B), hence moving the ITCZ southward, while it is limited to the SH after TrSH eruptions (Fig. 2D), therefore moving the ITCZ northward. Negligible Effect of Volcanically Induced ENSO Changes on TC Response
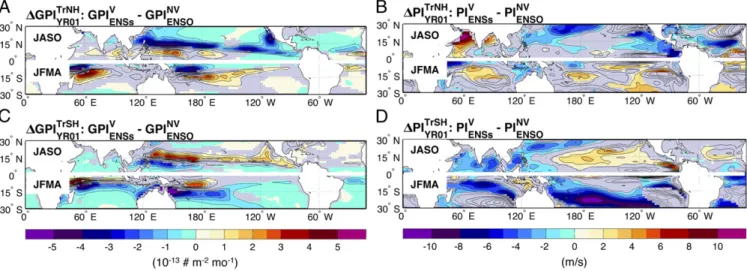
Several studies have shown the impact of ENSO on various as-pects of TC activity on a global scale, including frequency, in-tensity, duration, and track types (13, 26–33). Hence, recent studies (17, 19) have suggested that the TC activity following tropical volcanic eruptions may have been linked to volcanically induced anomalies in the ENSO phase. Tropical volcanic erup-tions tend to favor a positive phase of the ENSO (El Niño), through a southward shift of the ITCZ (11) and changes in Walker Circulation (6), among other processes. However, vol-canic eruptions in which the sulfate aerosol is confined to the SH shift the ITCZ northward and tend to favor a negative ENSO phase (La Niña) (SI Appendix, Table S1; see also refs. 11 and 34). Furthermore, the GPI anomaly patterns associated with the positive and negative ENSO phases (Fig. 3) are notably different from the pattern of the volcanically induced precipitation anomalies (compare Figs. 1 and 3). To better examine the po-tential impact of ENSO changes on the volcanically induced GPI anomalies, we created a composite of GPI associated with ENSO changes matching the magnitude of the volcanically induced anomalies in ENSO for each ensemble (Methods). The model GPI ENSO anomalies match well with those from reanalysis [see figures 6 and 8 in Camargo et al. (15)]. The differences between the GPI ENSO and volcanically induced anomalies highlight that the changes caused by the volcanic eruptions are much larger than those associated with ENSO (Fig. 4).
Finally, the GPI changes are very similar not only in both ensemble setups and for the NH but also for SH eruptions, which have different ENSO responses (La Niña-like vs. Neutral; SI Appendix, Figs. S2 and S3), further supporting that the ENSO changes are not the main cause of the GPI anomalies. Regarding the TC intensity, the PI pattern resembles ENSO anomalies only over the equatorial Pacific (Fig. 1 andSI Appendix, Fig. S6), and
the PI volcanically induced anomalies are much larger than those associated with ENSO changes (Fig. 4).
To understand the reason for the larger changes in the TC frequency and intensity proxies (i.e., GPI and PI) following volcanic eruptions compared with those induced by ENSO, we examine each of the four environmental factors that have a di-rect impact on the TC genesis. Most of them show posteruption anomalies larger than those associated with ENSO variability (SI Appendix, Figs. S7–S9). In particular, wind shear is strongly influenced by the volcanic eruptions even when the volcanically induced ENSO anomalies are small as in the case of TrSH eruptions. The volcanic eruptions impact the upper atmosphere meridional temperature gradient, which in turn affects upper-level winds [200 hectopascals (hPa)] via the thermal wind balance (see alsoSI Appendix, Figs. S10 and S11). Therefore, the vertical wind-shear anomalies are likely one of the main reasons for larger changes in GPI after volcanic eruptions relative to ENSO. TC Response in the Second to Fourth Years After the Eruption
The effects of the volcanic eruptions on TC activity are not confined to the first TC seasons after the eruption but extend far into the fourth season. The hemispherical cooling associated with the tropical eruptions is still widespread during the second, third, and––albeit to a lesser extent––during the fourth TC sea-sons. The associated equatorward shift of the ITCZ (SI Appendix, Figs. S12 and S13) dominates the volcanically induced GPI anomalies (Fig. 5) as in the first TC seasons. The changes in GPI closely follow those anomalies in all TC seasons up to the fourth year, further strengthening the relationship between the changes in GPI and the volcanically induced shifts of the ITCZ rather than ENSO. Moreover, the GPI anomalies in the second TC season (mm/day)
A
B
C
D
JASO JFMA JASO JFMA JASO JFMA JASO JFMAFig. 2. (A–C) Changes in precipitation (PRECT) and (B–D) surface temperature (TS) for TrNH and TrSH experiments relative to the no-volcano reference simulations for the first storm season (JASO) in the NH; JFMA in the SH) following the eruption. Only values that are significantly different at the 5% level using a local (grid-point) t test are shaded. The contour intervals follow the colorbar scale (solid for positive and dashed for negative anomalies). The zero-anomaly line is omitted for clarity and only changes over the ocean are shaded.
Table 1. Latitudinal change in the global ITCZ positions for the TC seasons (JASO in the NH; JFMA in the SH) following TrNH and TrSH eruptions relative to the no-volcano case
TC season TrNH TrSH
JASOΔITCZGLOB −0.9°N (6.3°N–7.2°N) +0.4°N (7.6°N–7.2°N)
JFMAΔITCZGLOB −0.5°N (6.1°S–4.5°S) +1.2°N (4.5°S–5.7°S)
The ITCZ position in the volcano and no-volcano simulations are shown in brackets. The location of the ITCZ is determined based on the maximum of zonal average rainfall over ocean grid boxes only.
EARTH, ATMOSPHERIC, AND PLANETARY SCIENC ES
remain mostly unchanged compared with the first one (compare Figs. 1 and 5), despite large La Niña-like conditions developing in the TrNH case and a weak El Niño-like state for TrSH––i.e., op-posite ENSO changes compared with the first year (Fig. 2 andSI Appendix, Figs. S2 and S12). Furthermore, while in La Niña years there are higher GPI values in the North Atlantic due to a reduced wind shear, the second TC season following the TrNH eruption has reduced GPI values notwithstanding the large La Niña-like anom-alies (Fig. 5). The wind shear over the North Atlantic shows positive anomalies (SI Appendix, Fig. S7) that are a consequence of the changes in temperature gradient aloft associated with the volcanic aerosol rather than the typical La Niña negative anomalies. Finally,
the changes in the temperature near the tropopause are consistent with the changes in GPI rather than the ENSO phase (SI Appendix, Figs. S14 and S15).
Summarizing, the response of the GPI to volcanic eruptions closely follows the precipitation-induced changes, in particular, the ITCZ shift associated with the asymmetrical cooling of the hemispheres following the simulated volcanic eruptions, which lasts for around 4 y. Volcanically Induced ITCZ Displacement as Main Driver of TC Response
The potential impact of volcanic eruptions on tropical cyclones has been recently discussed in the literature, with contradictory
Fig. 4. (A–C) Difference between the GPI and (B–D) PI changes in the first TC seasons (JASO in the NH; JFMA in the SH) following the volcanic eruptions and the ENSO GPI and PI composite changes for TrNH (Upper) and TrSH (Lower) eruptions. In the panel headings, V and NV stand for volcano and no-volcano simulations, respectively. Only values that are significantly different at the 5% level using a local (grid-point) t test are shaded. The contours follow the colorbar intervals (solid for positive and dashed for negative anomalies). The zero-anomaly line is omitted for clarity.
Fig. 3. (A–E) TC seasons (JASO in the NH; JFMA in the SH) GPI and (B–D and F) precipitation anomalies associated with El Niño and La Niña events and their difference. The contour intervals (dashed, negative anomalies; solid, positive anomalies) follow the colorbar scale. Only values that are significantly different at the 5% level using a local (grid-point) t test are shaded. The contours follow the colorbar intervals (solid for positive and dashed for negative anomalies). The zero-anomaly line is omitted for clarity.
conclusions. Some studies have pointed toward a reduction of Atlantic hurricane activity in the first few years following the eruptions (12, 16). Yan et al. (17) have shown that tropical and NH volcanic eruptions generate unfavorable conditions for TC genesis over the whole Pacific and the North Atlantic basin for at least three consecutive years following the eruption. SH volcanic eruptions instead cause unfavorable conditions for TC formation over the southwestern Pacific, but more favorable over the North Atlantic. On the other hand, using a compilation of observations, reanalysis, and multimodel historical simulations, Camargo and Polvani (20) highlighted that there was no statistically significant decrease in global TC activity after recent volcanic eruptions.
One of the issues that makes this problem complex is the co-incidence of El Niño events with recent large volcanic eruptions
(El Chichón in 1982, Pinatubo in 1991). Therefore, it is difficult to separate the volcanically induced effects from the El Niño on TC activity, in particular in the North Atlantic basin.
Currently, no consensus has hitherto been found on the causes behind the observed changes in TC activity following volcanic eruptions. Guevara-Murua et al. (16) surmised that volcanically induced cooling of local SSTs is responsible for the reduction in Atlantic hurricane frequency observed after low-latitude erup-tions, while Chiacchio et al. (19) and Yan et al. (17) suggest that changes in radiative forcing and ENSO phase act in concert to alter TC genesis.
In this study, we make use of large ensemble simulations of very intense volcanic eruptions with asymmetric aerosol distri-bution (either NH or SH) to investigate the mechanisms through which volcanic eruptions impact TC activity. To do so, we use proxies for TC frequency and intensity (namely, GPI and PI). We show that in our simulations the main effect of volcanic erup-tions on TC activity occurs through the volcanically induced ITCZ shift caused by the hemispherically asymmetric cooling. On the other hand, our results also highlight how the volcanically induced changes in ENSO do not seem to affect the TC response. Finally, the TC changes due to volcanic eruptions are much larger than those associated with ENSO, at least in this model.
In our experiments, we mimic the magnitude of one of the most powerful volcanic eruptions in recorded history to clearly discern the volcanic signal from natural variability. Although the effect of weaker eruptions may not scale linearly, it is likely that the conclusions drawn in this study will not be altered. For ex-ample, using the same climate model, Pausata et al. (8) have shown that the ENSO response to NH high-latitude eruptions is a function of the strength of the eruption since it is related to the ITCZ shift, which depends on the magnitude of the hemi-spherically asymmetric cooling [see figure S5 in Pausata et al. (8)]. Moreover, the precipitation anomaly patterns for the high-latitude volcanic eruptions with different strengths are very similar and closely resemble the rainfall anomalies associated with the TrNH eruption [compare figure 2a to S2 b and d in Pausata et al. (8)]. Hence, this suggests that less powerful eruptions likely produce TC anomaly patterns similar––albeit weaker––to those presented in this study.
In summary, we show here that the response of TC activity to large volcanic eruptions in this model is very distinct from ENSO and is indirect, through the ITCZ shift caused by the asymmetric cooling of the hemispheres. These results also allow us to explain why the TC genesis is reduced following NH eruptions as shown in the study of Guevara-Murua et al. (16). Therefore, claims of a reduction of global TC activity following recent volcanic erup-tions are not in agreement with our results, supporting the conclusions of Camargo and Polvani (20). We rather see a re-distribution of TC activity with some regions experiencing an increase and others a decrease, depending on the location of the volcanic cooling and associated displacement of the ITCZ.
Our results agree with observations (12, 16, 20) and provide a clear mechanism relating the changes in TC genesis and volcanic eruptions. The results of this study lay the groundwork for future research to allow a comprehensive understanding of the TC re-sponse to volcanic eruptions and advance the projections of near-term climate response to volcanic eruption. Higher-resolution climate model experiments forced with volcanoes eruptions of vari-ous intensities and in varivari-ous locations will be necessary to further examine the impacts of volcanoes on TCs.
Methods
Model Description and Experiment Design. In this study we perform the ex-periments using the Norwegian Earth System Model––NorESM1-M (35, 36)–– with horizontal resolution 1.9° (latitude)× 2.5° (longitude) and 26 vertical levels. NorESM1-M is composed of a modified version of the Community Atmospheric Model version 4 [CAM4 (37)], CAM4–Oslo, for the atmospheric part of the model. The model includes an updated aerosol module that simulates the life cycle of sea salt, mineral dust, particulate sulfate, and black and organic carbon (38). NorESM1-M has a separate representation of Fig. 5. Changes in GPI for TrNH and TrSH experiments relative to the
no-volcano reference simulations for the second (A and B), third (C and D), and fourth (E and F) TC seasons (JASO in the NH; JFMA in the SH) following the eruption. The contour intervals (dashed, negative anomalies; solid, positive anomalies) follow the colorbar scale. Only values that are significantly dif-ferent at the 5% level using a local (grid-point) t test are shaded.
EARTH, ATMOSPHERIC, AND PLANETARY SCIENC ES
aerosol–radiation and aerosol–cloud interactions, including treatment of the direct effect of aerosols, and the first and second indirect effects of aerosols on warm clouds. CAM4–Oslo is coupled with the updated version of the Miami Isopycnic Coordinate Ocean Model [MICOM (39)]. The sea ice and land models are basically the same as in the Community Climate System Model version 4 [CCSM4 (40)]. For detailed descriptions of model performances see refs. 8, 21, 35, and 36.
NorESM1-M has already been used to simulate volcanic eruptions (8, 9, 21) and to avoid unrealistic aerosol residence time a lower injection height compared with observations or reconstructions needs to be used when simulating tropical eruptions (SI Appendix). In the experiments used in the present study a tropical eruption has been simulated in which 60 Tg of SO2 are injected mostly between∼15 and ∼21 km (upper troposphere/lower stratosphere) over a period of 3 d, to mimic the strongest eruptions in the last 500 y (Tambora, Indonesia, 1815).
Analysis.
Volcanically induced anomalies. The volcanically induced anomalies (Δvolc) are calculated as the difference between the climate state induced by the vol-canic eruption (STATEV) and the unperturbed climate state (STATENV), i.e., without a volcanic eruption:
Δvolc= STATEV–STATENV. [1]
Each mean climate state is defined as the ensemble average of the given ensemble. We average together the two ensembles for each type of eruption, since the patterns of changes are consistent for the same type of scenario (compare Fig. 1 andSI Appendix, Fig. S3).
ENSO indices. In this study we used ENSO indices to characterize the volca-nically induced changes in its phase. The first one is based on monthly SST anomalies averaged over the Niño3.4 region (5°N to 5°S, 170°W to 120°W) (41). We applied a 5-mo running mean to remove uncoupled intraseasonal variations in SST. An El Niño event is defined when the Niño3.4 index ex-ceeds 1 SD (+0.4 °C) for at least six consecutive months.
The second one is based on the thermocline temperature anomalies be-tween 3°S and 3°N, and 150°W and 120°W to avoid biases induced by vol-canically induced surface cooling (see Composite analysis below). The reference thermocline depth at which the anomalies are analyzed is defined as the climatological no-volcano mean depth of the 20 °C isotherm. The climatological SD of the temperature at the thermocline level is about 3.6 °C. Composite analysis. To separate the direct radiative forcing from the dynamical response in the first TC seasons following the eruption (July to October, JASO01 and January to April, JFMA01), we construct a composite of ENSO anomalies matching the volcanically induced changes in ENSO for each en-semble, using the thermocline temperature anomalies. To create such a composite, we consider the unperturbed no-volcano simulations as well as 54 y of the reference historical simulation (1911–1964). To recreate similar ENSO conditions as in postvolcanic eruption boreal and austral summers (JASO01 and JFMA01), we pick the same thermocline temperature anoma-lies (within+0.75°/−0.75 °C range) as those simulated in the TrNH and TrSH volcano experiments in JASO01 and JFMA01, from the unperturbed NV ensemble members and the 54 y of reference historical simulation. Hence, we created four composites of surface temperatures having between 15 and 30 cases resembling the mean ENSO conditions in each of the volcano ex-periment (TrNH, two exex-periments and TrSH, two exex-periments). We can then calculate for example the surface temperature (TS) or GPI anomalies (e.g., ΔTSNV,ΔGPINV) associated with similar ENSO anomalies as in the V–NV ex-periments (e.g.,ΔTSV–NV,ΔGPIV-NV).
Unless otherwise noted, all differences discussed in this study are signif-icant at the 95% confidence level using a Student t test.
ACKNOWLEDGMENTS. We thank Michael K. Tippett for helpful comments on the manuscript. F.S.R.P. acknowledges the financial and logistic support from the Natural Sciences and Engineering Research Council of Canada (Grant RGPIN-2018-04981). S.J.C. acknowledges partial funding from Na-tional Oceanographic and Atmospheric Administration (NOAA) Grants NA15OAR4310095 and NA16OAR4310079. The climate model simulations were performed on resources provided by the Swedish National Infrastruc-ture for Computing at the National Supercomputer Centre.
1. Robock A (2000) Volcanic eruptions and climate. Rev Geophys 38:191–219. 2. Cole-Dai J (2010) Volcanoes and climate. Wiley Interdiscip Rev Clim Change 1:824–839. 3. Mann ME, Cane MA, Zebiak SE, Clement A (2005) Volcanic and solar forcing of the
tropical pacific over the past 1000 years. J Clim 18:447–456.
4. McGregor S, Timmermann A (2011) The effect of explosive tropical volcanism on ENSO. J Clim 24:2178–2191.
5. Maher N, McGregor S, England MH, Sen Gupta A (2015) Effects of volcanism on tropical variability. Geophys Res Lett 42:6024–6033.
6. Khodri M, et al. (2017) Tropical explosive volcanic eruptions can trigger El Niño by cooling tropical Africa. Nat Commun 8:778, erratum (2018) 9:855.
7. Zanchettin D, et al. (2014) Inter-hemispheric asymmetry in the sea-ice response to volcanic forcing simulated by MPI-ESM (COSMOS-Mill). Earth Syst Dyn 5:223–242. 8. Pausata FSR, Chafik L, Caballero R, Battisti DS (2015) Impacts of high-latitude volcanic
eruptions on ENSO and AMOC. Proc Natl Acad Sci USA 112:13784–13788. 9. Pausata FSR, Karamperidou C, Caballero R, Battisti DS (2016) ENSO response to
high-latitude volcanic eruptions in the Northern Hemisphere: The role of the initial con-ditions. Geophys Res Lett 43:8694–8702.
10. Stevenson S, et al. (2018) Climate variability, volcanic forcing, and last millennium hydroclimate extremes. J Clim 31:4309–4327.
11. Stevenson S, Otto-Bliesner B, Fasullo J, Brady E (2016)‘El Niño like’ hydroclimate re-sponses to last millennium volcanic eruptions. J Clim 29:2907–2921.
12. Evan AT (2012) Atlantic hurricane activity following two major volcanic eruptions. J Geophys Res 117:D06101.
13. Gray WM (1984) Atlantic seasonal hurricane frequency. Part I: El Niño and 30 mb quasi-biennial oscillation influences. Mon Weather Rev 112:1649–1668.
14. Tang BH, Neelin JD (2004) ENSO influence on Atlantic hurricanes via tropospheric warming. Geophys Res Lett 31:L24204.
15. Camargo SJ, Emanuel KA, Sobel AH (2007) Use of a genesis potential index to di-agnose ENSO effects on tropical cyclone genesis. J Clim 20:4819–4834.
16. Guevara-Murua A, Hendy EJ, Rust AC, Cashman KV (2015) Consistent decrease in North Atlantic Tropical Cyclone frequency following major volcanic eruptions in the last three centuries. Geophys Res Lett 42:9425–9432.
17. Yan Q, Zhang Z, Wang H (2018) Divergent responses of tropical cyclone genesis factors to strong volcanic eruptions at different latitudes. Clim Dyn 50:2121–2136. 18. Korty RL, et al. (2012) Variations in tropical cyclone genesis factors in simulations of
the Holocene epoch. J Clim 25:8196–8211.
19. Chiacchio M, et al. (2017) On the links between meteorological variables, aerosols, and tropical cyclone frequency in individual ocean basins. J Geophys Res 122:802–822. 20. Camargo SJ, Polvani LM (2018) Very little evidence for a direct effect of volcano aerosols on global tropical cyclone activity. Available at https://ams.confex.com/ams/ 33HURRICANE/webprogram/Paper340148.html. Accessed March 18, 2019. 21. Pausata FSR, Grini A, Caballero R, Hannachi A, Seland Ø (2015) High-latitude volcanic
eruptions in the Norwegian Earth System Model: The effect of different initial con-ditions and of the ensemble size. Tellus B 67:26728.
22. Camargo SJ, Wing AA (2016) Tropical cyclones in climate models. Wiley Interdiscip Rev Clim Change 7:211–237.
23. Camargo SJ (2013) Global and regional aspects of tropical cyclone activity in the CMIP5 models. J Clim 26:9880–9902.
24. Kang SM, Held IM, Frierson DMW, Zhao M (2008) The response of the ITCZ to ex-tratropical thermal forcing: Idealized slab-ocean experiments with a GCM. J Clim 21: 3521–3532.
25. Schneider T, Bischoff T, Haug GH (2014) Migrations and dynamics of the intertropical convergence zone. Nature 513:45–53.
26. Nicholls N (1979) A possible method for predicting seasonal tropical cyclone activity in the Australian region. Mon Weather Rev 107:1221–1224.
27. Chan JCL (1985) Tropical cyclone activity in the Northwest Pacific in relation to the El Niño/Southern Oscillation phenomenon. Mon Weather Rev 113:599–606. 28. Shapiro LJ (1987) Month-to-month variability of the Atlantic tropical circulation and
its relationship to tropical storm formation. Mon Weather Rev 115:2598–2614. 29. Chu P-S, Wang J (1997) Tropical cyclone occurrences in the Vicinity of Hawaii: Are the
differences between El Niño and Non–El Niño years significant? J Clim 10:2683–2689. 30. Camargo SJ, Sobel AH, Camargo SJ, Sobel AH (2005) western North pacific tropical
cyclone intensity and ENSO. J Clim 18:2996–3006.
31. Camargo SJ, et al. (2007) Cluster analysis of typhoon tracks. Part II: Large-scale cir-culation and ENSO. J Clim 20:3654–3676.
32. Kossin JP, Camargo SJ (2009) Hurricane track variability and secular potential intensity trends. Clim Change 97:329–337.
33. Camargo SJ, Sobel AH, Barnston AG, Klotzbach PJ (2010) The influence of natural climate variability on tropical cyclones, and seasonal forecasts of tropical cyclone activity. Global Perspectives on Tropical Cyclones: From Science to Mitigation, World Scientific Series on Asia-Pacific Weather and Climate, eds Chan JCL, Kepert JD (World Scientific, Singapore), pp 325–360.
34. Liu F, et al. (2018) Divergent El Niño responses to volcanic eruptions at different latitudes over the past millennium. Clim Dyn 50:3799–3812.
35. Bentsen M, et al. (2013) The Norwegian Earth System Model, NorESM1-M–Part 1: Description and basic evaluation of the physical climate. Geosci Model Dev 6:687–720. 36. Iversen T, et al. (2013) The Norwegian Earth System Model, NorESM1-M–Part 2:
Cli-mate response and scenario projections. Geosci Model Dev 6:389–415.
37. Neale RB, et al. (2013) The mean climate of the community atmosphere model (CAM4) in forced SST and fully coupled experiments. J Clim 26:5150–5168. 38. Kirkevåg A, et al. (2013) Aerosol-climate interactions in the Norwegian Earth System
Model–NorESM1-M. Geosci Model Dev 6:207–244.
39. Assmann KM, Bentsen M, Segschneider J, Heinze C (2010) An isopycnic ocean carbon cycle model. Geosci Model Dev 3:143–167.
40. Gent PR, et al. (2011) The community climate system model version 4. J Clim 24: 4973–4991.
41. Bamston AG, Chelliah M, Goldenberg SB (1997) Documentation of a highly ENSO‐ related SST region in the equatorial Pacific: Research note. Atmos Ocean 35:367–383.